1.
Introduction
Maize (Zea mays L.) is the cereal with the highest annual production in the world. The production area is widespread and encompasses various environments(1). In Uruguay, maize crops cover approximately 80,000 hectares each year, with average yields of 4.9 Mg ha-1 that exceptionally exceed 6.0 Mg ha-1(2). In the 2015-2016 harvest, the crop presented an average yield under irrigation of 8.5 Mg ha-1, 46% more than the rainfed yield. However, the potential yield of irrigated corn in Uruguay is 15 Mg ha-1(3), so the technological gap is still wide(4).
The main limitation of summer crop yield in Uruguay is water availability. Although there is high interannual rainfall variability, generally the water deficit coincides with the critical period of the crops, due to the higher evapotranspiration values of the year and the low storage capacity of available water in the soil(5)(6)(7). For approximately 15 years there has been an expansion of extensively irrigated crops, coinciding with the number of imported center pivots, which were 51 in 2000 and 422 in 2015(8).
In addition to water availability, another limiting factor for maize crop yield is nutrient availability(9). In this regard, a technological gap is observed since commercial properties with highly advanced irrigation systems use traditional fertilization practices, despite having the possibility of applying fertilizers with water as transport for a rational dosage that synchronizes the application and absorption of nutrients by crops(10)(11).
This research aimed to: a) evaluate alternatives of split fertilization with nitrogen (N) in an irrigated maize crop, and b) preliminarily evaluate the aerial image analysis as a diagnosis of N deficiency in maize. The hypotheses are that: by splitting and fertilizing with N through irrigation, it is possible to increase the efficiency of N use and the grain yield of the corn crop. Likewise, it is possible to diagnose N deficiency through an aerial image taken from a drone.
2. Material and methods
2.1 Characteristics of the experiment
The experiment was installed after a winter fallow, together with the corn sowing on October 7, 2018, in the farm La Horqueta, located at kilometer 64.5 of Route No. 1 (34°33'8.51"S; 56°42'32.22"W), Uruguay. It covered a total area of 1440 m2. The corn was sown with a seeder for direct sowing at steady flow with 100,000 seeds ha-1 to achieve a target population of 95,000 pl ha-1. The intermediate cycle cultivar DK72-10VT3P (73 days to flowering)(12) was sown.
The soil corresponds to a Hapludert (USDA Classification, 2006), which represents a Ruptic Eutric Vertisols, according to Uruguay's Soil Classification(13), of the Libertad soils unit of the soils chart, scale 1:1 million; representative of the Coneat 10.8b soil group. Characterized by being black or very dark brown, silty clay loam texture, high fertility, and moderately well-drained.
2.2 Experimental design
A complete randomized blocks design (CRBD) with four replicates was used for the experiment, assigning a fertilization treatment to each plot. The blocks were arranged in the direction away from the center of the pivot, between the fourth and fifth tower, one after the other, far from the final section of the equipment where rainfall is greater and could generate runoff. The plot size was 72 m2, 6 m wide and 12 m long, with the plant rows 0.7 m apart.
A total of five fertilization treatments with N were evaluated, being the amount, type of source, frequency and application method (diluted or solid) the experimental variables. The base fertilization at sowing, applied to the entire surface (including T0), was of 160 kg ha-1 of fertilizer N7-P40-K0 + 5 sulfur (S). For treatments F1, F2 and F3, Fertec® (U+TSA) was used, composed of urea and ammonium thiosulfate, N: 28, S: 5.2; density 1.4; liquid fertilizer commonly used in fertigation. For the C0 treatment, sulfur urea was used; granular N + S (40-0-0 + 6 S), commonly used fertilizer to apply as a cover, with S contribution in its formulation.
The treatments were the following:
T0: without additional nitrogen fertilization to the basal at sowing.
C0: cover fertilization of 150 kg N ha-1 split in three leaves (V3) and seven leaves (V7), with 30 and 70% of the dose, respectively.
F1: liquid fertilization in water, of 150 kg N ha-1 split in three leaves (V3) and seven leaves (V7), with 30 and 70% of the dose, respectively.
F2: liquid fertilization in water, of 150 kg N ha-1 split weekly with increasing doses from V3 until the beginning of the reproductive stage (R1). Distributed as follows: in weeks 1, 2, 3 and 4 (5%); in weeks 7 and 8 (10%), and in weeks 9, 10, 11 and 12 (15%), from V3 to R1, respectively.
F3: liquid fertilization in water, of 225 kg N ha-1 split weekly with increasing doses from V3 to R1, same as F2.
To simulate fertigation conditions, the dosage of the fertilizer in F1, F2 and F3 was done with a liquid fertilizer diluted in water until completing a total volume (fertilizer + water) of 6 L, applied with a spray backpack, before an irrigation event. Pivot irrigations, after the application of the fertilizer, allowed distributing the respective doses in the root depths, avoiding gaseous losses and percolation because the maximum sheets applied were 15 mm, simulating the fertigation conditions.
In all the treatments, electrical conductivity (EC) and pH were measured to optimize the mineral nutrition of the crop, considering that the optimal EC is between 2.5 and 3.5 mS cm-1 and the pH between 5.5 and 6.5(14). Conductivity was measured with an Orion 105 meter and pH with an Adwa model AD 1020 meter.
To define the fertilization with 150 kg N ha-1, corresponding to the treatments C0, F1, and F2, the N requirement of the crop was considered for a yield of 15 tons in 290 kg ha-1 of N(15) and the contribution by mineralization (based on the soil analysis before the application of the treatments), which was estimated at 140 kg ha-1 of N. To decide the splitting of N, weekly and incremental applications of the doses were made in treatments F2 and F3 according to Rhoads and others(16).
2.3 Irrigation management
Irrigation
management presented high frequency in periods with the absence of rain.
Irrigation was carried out every time that the water deficit in the soil was 4
mm in the initial stage of the crop cycle (from sowing until the crop covered
10% of the soil) and 15 mm in the stages of rapid development and mid-season
(from the end of the initial phase until the senescence of the basal leaves of
the crop began), according to the following conditional equation:
where Di:
Accumulated deficit on day i; Di-1: Accumulated
deficit on day i-1; ETci: crop evapotranspiration on
day i; Ppi: precipitation
on day i; Ri: irrigation. The precipitation and
irrigation entered into the equation correspond to the total amount of both
parameters, however, the formula adds a condition that prevents the water
content in the soil from rising above field capacity (FC) in the root area. For
this reason, both precipitation and irrigation are retained in the root area
until FC or zero accumulated deficit, the surplus is assumed to be lost by
percolation. The ETc was calculated as ETo x Kc, where the ETo is the
daily evapotranspiration of the reference crop calculated by the
Penman-Monteith method and the Kc corresponds to the daily value of the crop
coefficient calculated from the values in the FAO-56-table(17).
The Kc value in the initial phase was determined with the graphic method from
the average value of ETo and the frequency of soil
moistening in this phase(17).
The daily records of the agroclimatic station "Las Brujas" of the
National Agricultural Research Institute, located 35 km from the experiment
(34°40'15.76"S; 56°20'28.67"W), were used for the ETo
values. To characterize the evaluation year regarding the atmospheric demand (ETo) and precipitation, the historical series 1981-2019 of
the same station was analyzed.
2.4 Determinations
Soil moisture was monitored with an FDR probe (Frequency Domine Reflectometry, Delta-T Devices™, USA) weekly from the sowing of the crop to harvest. An access tube was placed in each treatment, in the two central blocks. The probe was calibrated for depths from 0 to 20, 20 to 40 and 40 to 60 cm, with the gravimetric method of measuring water in soil according to Marano and others(18).
Before choosing the center pivot irrigation equipment to carry out the experiment, the pivot uniformity coefficient (UC) was measured using the Heerman and Hein(19) methodology described in Tarjuelo(20).
In stage V3 of crop development, before the application of the treatments, 20 soil samples were taken per block at depths of 0 to 20 cm and 20 to 40 cm. All samples were dried at 40°C and ground to determine: texture by the Bouyoucos method(21); organic matter (OM) by oxidation with K2Cr2O7 in H2SO4-(22); pH in water by potentiometry; nitrates (NO3-) by colorimetry(23); available P by the Bray 1 method(24); and exchangeable bases (K, Ca, Mg and Na) by extraction with ammonium acetate 1N(25). After harvest, samples were taken at a depth of 0 to 20 cm and 20 to 40 cm per plot to determine NO3-.
The implantation percentage was determined in the emergence of the crop according to the total number of seeds sown. The production of aboveground biomass was determined in the plant at the development stages V3, V6, R1 and physiological maturity (R6) in one linear meter in each of the plots. Grains were separated from the rest of the plant to determine the total absorption of N at R6. The concentration of N was determined by the method of Kjeldahl(26). Plant height was measured weekly and the phenological stage was recorded according to Ritchie and Hanway(27) in one linear meter in each of the plots. Population, grain production, and grain moisture were also determined at harvest, using a portable hydrometer, weight of a thousand grains, spikes.m-2, spikes.plant-1 and number of grains.spike-1. The sampling unit to determine the yield components was 6 linear meters in each plot, two linear meters in three different locations of the 5 central rows.
The amount of N lacking to reach the level of sufficiency suggested by Lemaire and Gastal(28) [2] and [3], and a N Sufficiency Index (NSI) were estimated for each treatment in the phenological stages V6 and R1 [4]. The concentration and absorbed amount of N in each treatment were analyzed with the same model [2]
Where Optimal % is the optimal nitrogen concentration (%) for the amount of aboveground biomass developed by the crop. The lacking kg of N is the amount of N that the crop lacked to reach the optimum level.
The indicators related to N proposed by Iqbal and others(29) and taken into account in this study are the Nitrogen Use Efficiency (NUE) [5] and the Agronomic Efficiency of N (AEN) [6].
After the end of the test, the values of Kc per treatment and per phase were calculated again, as well as the duration of each stage of the crop cycle(30). According to FAO-56(17), four stages or phases in the crop cycle were distinguished: initial, development, mid-season and final phase.
Two initial Kc values were used, one before irrigation, Kc1 corresponding to the table value of FAO(17) and another after irrigation started, Kc2, corresponding to the initial Kc graph value for the moistening frequency of the soil of FAO-56(17). The development, mid-season and end-of-season crop coefficients were named as Kc3, Kc4 and Kc5, respectively.
The soil moisture values measured at root depth with the FDR probe and the values estimated by the theoretical balance were used. The values were adjusted by minimizing the sum of squares of the error between both values. With this methodology, the ET of each treatment was also corrected, the effectiveness of each irrigation (net irrigation) and the effective rainfall were determined, and the water use indicators proposed by Caviglia and others(31) and described by Trenbath, were obtained.(32):
Water Productivity (WP) [7], Capture Efficiency (WCE) [8], and Water Use Efficiency (WUE) [9].
The LSD-Fisher
test with Bonferroni correction for p-value was used for the comparison of
means of the variables: total dry matter production, grain yield, grain yield
components, water use efficiency (WUE) and water productivity (WP) in each
stage of crop development(33).
The treatment and block effects were considered for this comparison and it was
assumed that the treatments would have independent variances [10]. An effect
was considered significant when the p-value was lower than 0.05 and as a trend
when p was between 0.05 and 0.10.
Where Y represents the response variable and "treatment" corresponds to the different fertilization treatments.
When the corn reached the R1 stage of development, an aerial photo was taken with a drone from 45 meters high with a 20-megapixel camera, DJI model Phantom 4 Pro V2.0 Professional 4K Drone. The color of each plot was measured, on the red (R), green (G), and blue (B) scales, with the AP FillInkCoverage Meter® software. With the values obtained, a color index was estimated [11] (InCol). The correlation between color and InCol values was analyzed with: % N; biomass; NSI; and grain yield (kg ha-1).
Where
InCol is the color index, G and R are the average
reflectance intensity values of the crop canopy of each plot, expressed on a
scale from 0 to 255.
3. Results
3.1 Analysis of soil and concentrated solution for
fertilization
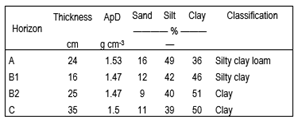
According
to the results of the measurements of the soil textural analysis (Table 1), the
corresponding classification made from Altamirano and others(13)
is reaffirmed.
Table 1
Soil textural analysis and apparent
density by horizon
At the time of sowing, the results of P Bray 1 analysis were 29 mg kg-1 in the first 20 cm of soil, and 7 mg kg-1 in the 20 to 40 cm section. At sowing, the NO3- values were 4 and 3 mg kg-1 for the 0 to 20 and 20 to 40 cm sections, respectively. These values increased at harvest, more than double in the 0 to 20 cm stratum (12 mg kg-1) compared to 20 to 40 cm (5 mg kg-1).
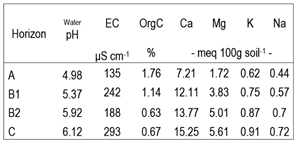
Table 2 shows the chemical analysis of the soil by horizon before the sowing.
Table 2
Chemical analysis of the soil before
sowing
Table
3 shows the results of the EC and pH analyses of the concentrated solutions
used in irrigation.
Table 3
EC and pH analysis of each
concentrated solution used. EC in mS cm-1
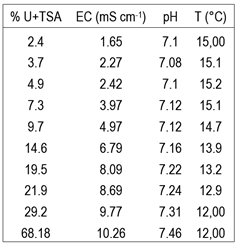 * U+TSA: Fertec ®.
3.2
Water situation
The accumulated rainfall record between October and February for the year of the experiment was 621 mm and only 28% of the years of the analyzed series (1981-2019)(34) exceeded this value. Regarding the accumulated rainfall of December and January, the year was the rainiest of the analyzed series, with a record of 569 mm. The year presented a low atmospheric demand in terms of ETo; the accumulated value between October and February was 608 mm and only 5.1% of the years recorded lower values.
The uniformity coefficient of the pivot equipment measured at the beginning of irrigation was 90%.
Based on the Kc 4 values and the different durations of this phase, fertilization with N caused a lengthening of period 4 (Table 4).
Table 4
Adjusted Kc
values and their duration in days for each treatment
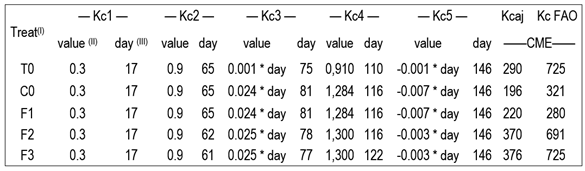 (I)T0: without additional nitrogen
fertilization to the basal sowing fertilization; C0: cover fertilization with
150 kg N ha-1 split into three (V3) and seven (V7) leaves at
development stage; F1: same as “C0” but with fertilizer diluted in water; F2:
150 kg N ha-1 as fertilizer diluted in water, split weekly from V3
to reproductive stage (R1); F3: same as “F2” but with 225 kg N ha-1.
(II)Kc value with curve slope coefficient. (III)Days from
October 6 (10 days before sowing) until Kc value is maintained.
(I)T0: without additional nitrogen
fertilization to the basal sowing fertilization; C0: cover fertilization with
150 kg N ha-1 split into three (V3) and seven (V7) leaves at
development stage; F1: same as “C0” but with fertilizer diluted in water; F2:
150 kg N ha-1 as fertilizer diluted in water, split weekly from V3
to reproductive stage (R1); F3: same as “F2” but with 225 kg N ha-1.
(II)Kc value with curve slope coefficient. (III)Days from
October 6 (10 days before sowing) until Kc value is maintained.
Figures 1 and 2 show the water balances and the FDR probe
readings in the first 40 cm of depth of the most contrasting treatments of the
experiment in terms of water demand, which are F3, with the highest demand, and
T0 with the lowest
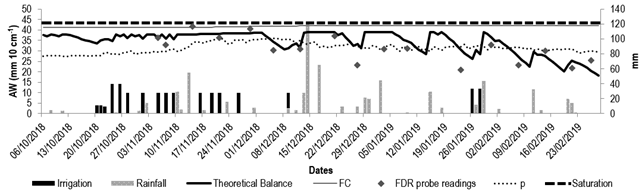 Figure 1
F3 treatment water balance and FDR
probe readings
Figure 1
F3 treatment water balance and FDR
probe readings
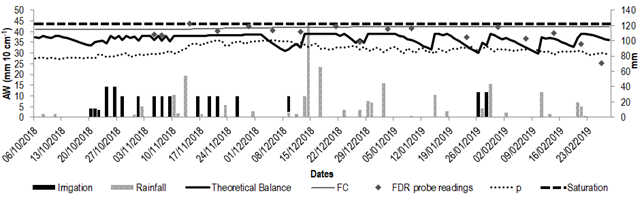 Figure 2
T0 treatment water balance and FDR
probe readings
Figure 2
T0 treatment water balance and FDR
probe readings
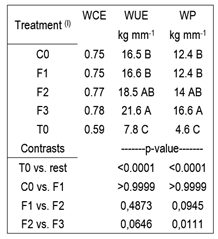
Table 5 shows the water indicators, WCE, WUE and WP. The
treatments fertilized after sowing exceeded T0 in terms of the WCE. On the
other hand, weekly split fertilization could have increased the WP, whereas
there was no effect of the different sources of N on WUE and WP.
3.3 Biomass production
Biomass production was determined in four phenological stages of the crop V3, V6, R1 and R6. The aboveground biomass production at stage V3 did not present differences between treatments, therefore the experiment began in a similar biomass condition to the beginning of the corresponding treatments (Figure 3).
The production of the fertilized treatments began to differ from the control when reaching the R1 stage and the difference increased until reaching the R6 stage. In this stage, treatment T0 had lower biomass than the rest (14078 kg ha-1 of the control treatment vs. 25527 kg ha-1 average of the rest of the treatments).
Table 5
Water capture efficiency (WCE), water
use efficiency (WUE) and water productivity (WP) for each treatment; and p
value of the contrasts between treatments
 (I)T0: without additional nitrogen
fertilization to the basal sowing fertilization; C0: cover fertilization with
150 kg N ha-1 split into three (V3) and seven (V7) leaves at
development stage; F1: same as “C0” but with fertilizer diluted in water; F2:
150 kg N ha-1 as fertilizer diluted in water, split weekly from V3
to reproductive stage (R1); F3: same as “F2” but with 225 kg N ha-1.
(I)T0: without additional nitrogen
fertilization to the basal sowing fertilization; C0: cover fertilization with
150 kg N ha-1 split into three (V3) and seven (V7) leaves at
development stage; F1: same as “C0” but with fertilizer diluted in water; F2:
150 kg N ha-1 as fertilizer diluted in water, split weekly from V3
to reproductive stage (R1); F3: same as “F2” but with 225 kg N ha-1.
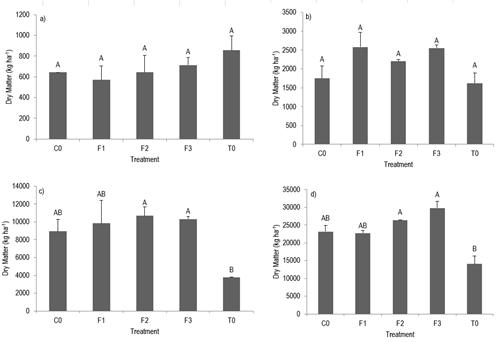 Figure 3
Biomass production in four
phenological stages of the crop
Figure 3
Biomass production in four
phenological stages of the crop
a) Development stage V3; b) V6; c) R1 and
d) R6. Different letters indicate significant differences between treatment
means (Pr>|t|) using a p-value of 0.05 and
Bonferroni correction. The lines over the bars indicate (±) the standard error.
T0: without additional nitrogen fertilization to the basal sowing
fertilization; C0: cover fertilization with 150 kg N ha-1 split into
three (V3) and seven (V7) leaves at development stage; F1: same as “C0” but
with fertilizer diluted in water; F2: 150 kg N ha-1 as fertilizer
diluted in water, split weekly from V3 to reproductive stage (R1); F3: same as
“F2” but with 225 kg N ha-1.
3.4 Grain production
The
grain production presented a higher average yield in the plots where the
fertilizer was split weekly compared to the ones split in two opportunities
(Figure 4). This trend was also observed in the accumulation of biomass in R6.
However, the high variability between plots did not allow manifesting
statistically significant differences either in grain production (p = 0.72), or
in accumulated biomass in R6 (p = 0.0887), between treatments.
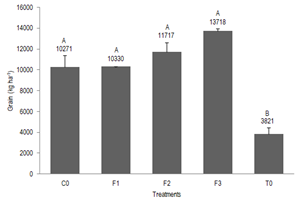 Figure 4
Grain production of the different
treatments
Figure 4
Grain production of the different
treatments
Different letters indicate significant differences between
treatment means (Pr>|t|) using a p-value of 0.05
and Bonferroni correction. The lines above the bars indicate (±) the standard
error. T0: without additional nitrogen fertilization to the basal
sowing fertilization; C0: cover fertilization with 150 kg N ha-1
split into three (V3) and seven (V7) leaves at development stage; F1: same as
“C0” but with fertilizer diluted in water; F2: 150 kg N ha-1 as
fertilizer diluted in water, split weekly from V3 to reproductive stage (R1);
F3: same as “F2” but with 225 kg N ha-1.
3.5 Nitrogen as a limiting factor
According to the grain production as a function of the percentage of N in grain and of the deficit of kg N absorbed (Figure 5), the yield increased as the N concentration increased to 1.47% N in V6 and up to 1.36% N in R1.
The grain production decreased when the N absorption deficit exceeded 24 kg ha-1 in the V6 stage, while the yield decline started with an absorption deficit of 11 kg ha- 1 in the R1 stage. In V6, treatments F2 and F3 were the only ones that achieved (in all repetitions) a deficit of N lower than 24.5 kg ha-1, given the strategy of weekly fertilization and dose increase in the case of F3.
When the maize was in V3, all the treatments presented the same state of nitrogen nutrition. In V6, the F2 and F3 treatments were the only ones that achieved (in all repetitions) a N deficit of less than 24.5 kg ha-1 (Figure 5). Stages V6, R1, or R6 presented increases in NSI and decreases in the grain yield (Figure 6). In turn, it can be seen that the NSI value of 1 was only reached in the R1 stage (Figure 6). At R1, all treatments except T0 had the same NSI value (p<0.05), however, the higher dose of F3 decreased the NSI (-0.15; p = 0.0212) compared to the treatment F2 that had a greater deficit.
The AEN was at its highest point with doses of 150 kg N ha-1, decreasing with the highest dose of 225 kg N ha-1. No significant differences were observed in this study between treatments (Table 6).
Table 6
Agronomic efficiency of nitrogen
(AEN) and nitrogen use efficiency (NUE) for each treatment; and p-value of the
contrasts between treatments
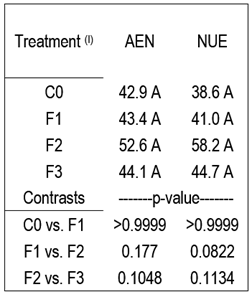 (I)C0: cover fertilization with 150 kg N
ha-1 split into three (V3) and seven (V7) leaves at development
stage; F1: same as “C0” but with fertilizer diluted in water; F2: 150 kg N ha-1
as fertilizer diluted in water, split weekly from V3 to reproductive stage
(R1); F3: same as “F2” but with 225 kg N ha-1.
(I)C0: cover fertilization with 150 kg N
ha-1 split into three (V3) and seven (V7) leaves at development
stage; F1: same as “C0” but with fertilizer diluted in water; F2: 150 kg N ha-1
as fertilizer diluted in water, split weekly from V3 to reproductive stage
(R1); F3: same as “F2” but with 225 kg N ha-1.
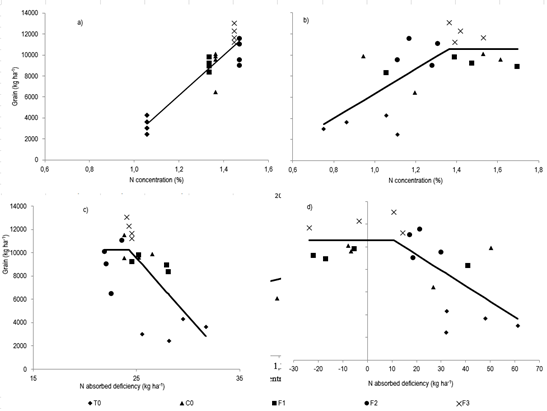 Figure 5
Grain production as a function of the
percentage of N in grain, and the deficit of N absorbed
Figure 5
Grain production as a function of the
percentage of N in grain, and the deficit of N absorbed
a) and c) in the V6 development stage; b) and d) in the R1
development stage. T0: without additional nitrogen fertilization to the basal
sowing fertilization; C0: cover fertilization with 150 kg N ha-1
split into three (V3) and seven (V7) leaves at development stage; F1: same as
“C0” but with fertilizer diluted in water; F2: 150 kg N ha-1 as
fertilizer diluted in water, split weekly from V3 to reproductive stage (R1);
F3: same as “F2” but with 225 kg N ha-1
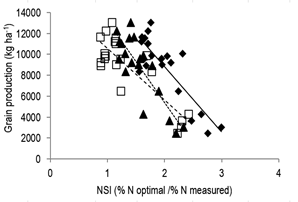 Figure 6
Relation between grain yield and the
Nitrogen Sufficiency Index (NSI)
Figure 6
Relation between grain yield and the
Nitrogen Sufficiency Index (NSI)
Relation between grain yield and the Nitrogen Sufficiency Index
(NSI) The diamonds represent data at V6 and the whole line represents the model
yield = -6254 * NSI + 21320, R2 = 0.74; the squares at R1 and the
segmented line the model yield = -4906 * NSI + 15457, R2 = 0.71; and
the triangles at physiological maturity, the dotted line the model yield =
-7816 * NSI + 21051, R2 = 0.71.
3.6 Diagnosis of the N
content in the aboveground biomass by means of the color analysis of the canopy
Canopy colors and color index (InCol) were related to biomass, N concentration in V6 stage, N sufficiency index (NSI), R1 stage and final grain production. The value of the red color (R) and the InCol behaved similarly.
Colors (R, G and B) and color index (InCol) were related to biomass, N concentration in V6 stage, N sufficiency index (NSI), R1 stage and final grain production. The value of the red color (R) and the InCol behaved similarly. However, InCol had a greater relationship with the four studied variables, which could be more useful (Table 7).
Table 7
Pearson's correlation coefficient
between the red (R), green (G) and blue (B) color values, color index in the
biomass produced, plant N concentration (% N), N sufficiency index (NSI) and
grain production
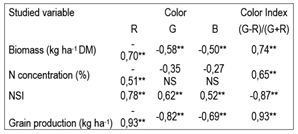 ** Significant differences (P≤0.05) between correlations; NS
indicates non-significant differences.
** Significant differences (P≤0.05) between correlations; NS
indicates non-significant differences.
4. Discussion
4.1 Analysis of soil and concentrated solution for
fertilization
The A horizon had an apparent density value of 1.53 g cm-3, high compared to its silty clay loam granulometry, which could indicate the existence of a compaction effect, which could also occur in the B and C horizons(35). Based on the chemical analysis of the soil, the pH value was low (4.98) compared to the value at which the maximum production of maize grain occurs, which is close to pH 6.0, with variations depending on the type of soil and aluminum content(36). In turn, the bases values were low, as was Corg % compared to modal soil(13). It should be noted that K did not present limiting values for the crop(37). In turn, P Bray 1 was not limiting(38), although it presented high stratification between the first 20 cm and the following 20 cm. The NO3- values at harvest would not necessarily imply a fertilization surplus given the expected annual variability in the values of N-NO3- in soil, which could have increased after the summer period.
The optimal EC value of the nutrient solution is 2.5 mS cm-1(14). According to Pizarro(39), the EC could increase up to 6.3 mS cm-1 when fertilizer is dosed in irrigation once every 7 days. It should be noted that the parameters analyzed (Table 3) are those corresponding to the concentrated solutions immediately after their application. After their application, the corresponding irrigation was carried out, so that the crop effectively received a more diluted solution, with lower EC values than those shown. The irrigation water used presented 0.374 mS cm-1, lower than the average of four surface water samples from the rural area of Canelones and Montevideo (0.601 mS cm-1)(40).
4.2 Water situation
Lafitte(41), and Rodríguez and others(42) obtained similar results to the ones from this experiment. They determined that the N applied to corn lengthen the vegetative and grain filling phases, allowing greater interception of radiation and a higher photosynthetic rate, favoring higher production of photoassimilates and, therefore, greater yields. In turn, Soto and others(43), and Ruiz(44) observed that the increase in the nitrogen fertilization dose resulted in a decrease in senescent leaves.
The treatment without additional N fertilization was the first to reach the period defined by Kc 4 and the first to begin the period of Kc decline. On the other hand, nitrogen fertilization promoted a higher biomass production and delayed the senescence of the leaves, maintaining the photosynthetic activity of the crop for a longer time (Table 4). Results coincide with that observed by Barrios and Baso(45), who studied different hybrids and their behavior regarding different doses of N, concluding that the control without N presented fewer days to flowering and maturation than the rest of the fertilized treatments for most hybrids.
The higher precocity and duration of phase 4 (Kc 4) reached when fertilizing with N must have increased the yield, the maximum value of Kc was higher when fertilizing weekly, probably due to the higher biomass production. F3 treatment maintained the maximum Kc for the longest time, possibly because it kept its green foliage for longer. According to the above, this should have been reflected in the final yield since various authors determined that the yield responds positively to the application of N by lengthening the crop cycle(46)(47)(48)(49).
Nitrogen fertilization treatments consumed more water, given a higher biomass production compared to T0. The higher consumption trend was emphasized as of mid-December, the time of greatest atmospheric demand, except from mid-November to early December when the soil was in saturation, which was reflected by the theoretical balance and confirmed by probe measurements. The highest water consumption in the treatments with nitrogen fertilization was evidenced in the greater frequency in which the available water fell below the threshold from the last week of January and through February, a period with less recorded rainfall.
N fertilization increased WUE and WP. To this effect, Pietrobón and others(50) reported that the increase in the availability of N decreased the NUE and increased the WUE. On the other hand, the weekly fertilization splitting did not increase the WP. In turn, there was no effect of the different N sources on WUE and WP. Pedrol and others(51) observed in experiments of irrigated corn that with different doses of N (120, 180 and 240 kg N ha-1) the WUE was between 15.9 and 17.9 kg mm-1. These results are similar to those obtained in treatments F1 (16.6 kg mm-1) and F2 (18.5 kg mm-1), however, the WUE in F3 (21.6 kg mm-1) was slightly higher even at the highest dose of the aforementioned experiment.
4.3 Biomass production
The lack of difference in biomass produced between the treatments with additional fertilization to the basal at sowing could be due to the high spatial variability of the experiment, which allowed an adequate supply of N, even in some plots with less fertilized treatments.
When contrasting the two different N sources (sulfur urea and U+TSA) there was no effect on any of the variables evaluated. However, Fontanetto and others(52) in research carried out in the northern pampa region of Argentina observed higher corn production when using U+TSA than when using urea, both applied on the surface at a dose of 100 kg of N ha-1, in the vegetative phase. The authors attribute this higher efficiency in the nitrogen source U+TSA to lower N losses due to volatilization compared to losses suffered by urea. In this study, the conditions of low atmospheric demand could have determined lower volatilization losses in the form of ammonia, preventing the observation of possible differences in the efficiency of the N use of the fertilizers used.
4.4 Grain production
Roque and others(53) observed that less exposure to N losses due to soil washing could produce higher yields, in a scheme of six applications with respect to two. In this regard, Esteve(54) demonstrated in various species and different irrigation systems that slitting the fertilizer in five or six applications is more efficient than two.
Increased grain production when fertilizing with N was an expected result. In this regard, Wong and others(55) observed significant differences in dry matter yield when the dose increased from 125 to 375 kg N ha-1, in a two-year evaluation experiment. Given the slow decomposition of oat stubble, together with the low levels of nitrates and organic matter in the soil before the treatments, high response to nitrogen fertilization was predicted. However, high N mineralization values were reached after sowing(56)(57)(58)(59), which could have determined that after stage V6, the N contribution from the soil in some plots was sufficient to compensate for the differences in the contribution of N from fertilization, not allowing to detect differences between treatments. This can be assumed since grain yield increased with the concentration of N in the plant and the amount of N absorbed by the crop (Figure 5). Therefore, there was an effect of N, but the treatments were not the factors that ensured the differences in its availability for the crop. However, the low yield of T0 (treatment without fertilization) compared to fertilized ones shows that the contribution of N from the soil was not enough to increase its grain production.
4.5 Nitrogen as a limiting factor
According to the model proposed by Lemaire and Gastal(28), the critical levels for the estimated production would be 1.42 and 1.40% N, in stages V6 and R1, respectively, similar to those observed in this study. F2 and F3 treatments were the only ones that achieved a N deficit lower than 24.5 kg ha-1 at stage V6, in all repetitions (Figure 5d). In this stage, F2 treatments had received 15 kg N ha-1 less than those fertilized in two moments (C0 and F1), indicating that weekly fertilization allows saving fertilizer.
It is evident that all treatments would have had N deficiency if they had not been fertilized in V6. However, the amount of N in the plant reached the optimum (NSI=1) for its level of biomass produced in R1 (Figure 6). One of the advantages of the NSI monitoring proposal between V6 and R1 together with weekly fertilization is that once the sufficiency level has been verified, it is not necessary to apply the following doses as long as this condition is maintained.
Ceriani and Inella(60) observed that irrigated environments generate the conditions for greater absorption of N compared to rainfed. In this regard, they determined that the response of corn under irrigation was up to 188 kg N ha-1 and until the development stage V10, with an NUE of 20.7 kg grain kg N-1, while the response was up to 123 kg N ha-1 and until a development stage V6, with a NUE of 10.7 kg grain kg N-1, in rainfed. The grain yield was 6132 and 10727 kg ha-1in rainfed and irrigation, respectively. As can be seen, the NUE, in addition to the AEN, were widely higher than those reported in the literature (Table 6). This situation could be explained by the greater difference between the fertilization treatments and the control, and the greater water availability during growth (827 vs. 482 mm).
Abraham and Falco(61) did not find differences between applying 180 kg N ha-1 in V6 or distributed between V6, V10, and V12, in irrigated corn in an experiment located on the west coast of Uruguay, presenting an average yield of 14394 kg ha-1 of grain, higher than rainfed. The authors observed that irrigation can generate an environment conducive to greater mineralization of soil N and greater absorption that can occur in more advanced stages, compared to rainfed corn. Through irrigation, it would be possible to provide a higher dose of fertilizer, correct N deficit in later stages, and achieve higher yields. F2 and F3 treatments, which split fertilizer doses in advanced stages of corn, would have presented less mineralization, absorption of N and, therefore, a lower yield, without irrigation. However, while rainfed N deficiencies may be lower, the yield potential may as well. In Uruguay, Ceriani and Inella(60) found that corn presented a higher grain yield per kg of N added in irrigation than in rainfed. Moreover, the AEN was at its highest with doses of 150 kg N ha-1, decreasing with higher doses of approximately 200 kg N ha-1. No significant differences were observed in this study between treatments.
4.6 Diagnosis
of the N content in the aboveground biomass by canopy color analysis
In the individual color analysis, green (G) and red (R) had the highest correlations with NSI. In this regard, Blackmer and others(62) in Nebraska (USA) found that the best detection of N deficiency was obtained around 550 (G) and 710 (R) nm, while analyzing images according to different reflectance waves to diagnose the nutritional status of corn. In turn, they expressed that the use of relations such as InCol can have the advantage of compensating for defects in fluctuating light conditions. In this regard, the highest absolute value of the Incol correlation can be seen with respect to the individual colors (Table 7). Farrell and others(63) observed that an index similar to Incol used in flowering presented the best discriminations between corns with different fertilizations compared to four evaluated plant indices. However, the indicator did not correlate with biomass or grain production. In this regard, Maresma and others(64) found high correlation values between different indices in V12 and grain production, similar to those found in the present experiment. In turn, they proposed using different indicators for the different crop variables, to avoid the uncertainty associated with the use of a single indicator.
In this study, although the evaluated information is not enough to conclude about the presented values, it seems feasible to explore the color reading of digital aerial images to interpret the nutritional status and productive potential of corn. This is a developing technology(65) and its approach will possibly develop new ways of analyzing information, such as analysis based on neural networks(66).
5. Conclusions
As expected, due to the low values of nitrate at sowing, the crop responded to fertilization with N, regardless of the fertilizer used. The greater absorption of N in the weekly fertilization treatments allowed reaching full soil cover earlier and keeping green foliage for longer. This determined higher evapotranspiration during the crop cycle and higher water productivity values in these treatments.
The weekly splitting of N fertilization, together with the monitoring of the N status in the plant, between the development stages of V6 to R1, allow adjusting the fertilization dose during the growing season of the crop without affecting the yield.
For the monitoring of the N status of the crop, the color analysis of crop images is a potential tool, given its high correlation with variables that would allow correcting the fertilization of the crop.
References
1. Morceli P. El mercado mundial del maíz. In: El mercado del maíz en los países del CAS. Montevideo: CAS; 2014. p. 9-16.
2. Ministerio de Ganadería, Agricultura y Pesca, DIEA (UY). Anuario estadístico agropecuario [Internet]. Montevideo: MGAP; 2017 [cited 2021 Jul 26]. 214p. Available from: https://bit.ly/3k5Y6ve.
3. Giménez L. ¿Cuánto estamos perdiendo por no regar cultivos en Uruguay? In: Riego en cultivos y pasturas. Montevideo: INIA; 2012. p. 35-41.
4. Ministerio de Ganadería, Agricultura y Pesca, DIEA (UY). Encuesta agrícola: invierno 2016. Montevideo: MGAP; 2016 [cited 2021 Jul 26]. 19p. (Serie Encuestas; 337). Available from: https://bit.ly/3i2rEvB.
5. Sawchik J, Ceretta S. Consumo de agua por sojas de distintos grupos de madurez en diferentes ambientes de producción (CALMER-AUSID-INIA). In: Jornada técnica de cultivos de verano. Montevideo: INIA; 2005. p. 41-5. (Serie de Actividades de Difusión; 417).
6. Giménez L, García Petillo M. Evapotranspiración de cultivos de verano para dos regiones climáticamente contrastantes de Uruguay. Agrociencia Uruguay. 2011;15(2):100-8.
7. Castaño JP, Gimenez A, Ceroni M, Forest J, Aunchayna R. Caracterización agroclimática del Uruguay 1980–2009. Montevideo: INIA; 2011. 40p. (Serie Técnica; 193).
8. Ministerio de Ganadería, Agricultura y Pesca, DGRN (UY). Instructivo para la importacion de equipos de riego con fines agropecuarios [Internet]. Montevideo: MGAP; 2016 [cited 2021 Jul 26]. 1p. Available from: https://bit.ly/3y5tr8E.
9. Ciampitti I, García F. Balance y eficiencia de uso de los nutrientes en sistemas agrícolas. Rev horiz. 2008;4(18):22-8.
10. Cadahía LC. Fertirrigación: cultivos hortícolas, frutales y ornamentales. Madrid: Mundi-Prensa Libros; 2005. 681p.
11. Lamm FR, Schlegel AJ. Nitrogen fertilization for corn production when using lepa center pivot sprinklers. In: National Irrigation Symposium: proceedings of the 4th decennial symposium, November 14-16 2000, Phoenix, Arizona. St. Joseph: American Society of Agricultural Engineers; 2000. p. 14-6.
12. Guía técnica Dekalb 2013. [place unknown]: Dekalab; 2013. 43p.
13. Altamirano A, Da Silva H, Durán A, Echeverría A, Panario D, Puentes R. Carta de reconocimiento de suelos del Uruguay: clasificación de suelos. Montevideo: MAP; 1976. 96p.
14. Urrestarazu M. Tratado de cultivo sin suelo. 3rd ed. Madrid: Mundi-Prensa; 2004. 914p.
15. IPNI. Cálculo de Requerimientos Nutricionales - Versión 2016: cultivos de cereales, oleaginosas, leguminosas, industriales, forrajeras y hortalizas [Internet]. Buenos Aires: IPNI; 2016 [cited 2021 Jul 26]. Available from: https://bit.ly/3hCptwf.
16. Rhoads FM, Mansell RS, Hammond LS. Influence of Water and Fertilizer Management on Yield and Water-input Efficiency of Corn. Agron J. 1978;70(2):305-8.
17. Allen RG, Pereira LS, Raes D, Smith M. Crop evapotranspiration: guidelines for computing crop water requirements. Rome: FAO; 1998. 300p. (Irrigation and Drainage; 56).
18. Marano RP, Ledesma F, Camussi G, Carnevale I. Uso de sondas FDR para balance de agua en suelo: calibración y aplicación. In: Actas XIX Congreso Latinoamericano y XXIII Congreso Argentino de la Ciencia del Suelo. Mar del Plata (AR): MNEMOSYNE; 2012. 10p.
19. Heermann DF, Hein PR. Performance characteristics of self-propped center pivot sprinkler irrigation system. Trans ASAE. 1968;11(1):11-5.
20. Tarjuelo JM. El riego por aspersión y su tecnología. 3rd ed. Madrid: Mundi-Prensa; 2005. 569p.
21. Bouyoucos GJ. Hydrometer method improved for making particle size analysis of soil. Agron J. 1962;54:464-5.
22. Walkley A, Black TA. An examination of the Degtjareff method for determining soil organic matter, and a proposed modification of the chromic acid titration method. Soil Sci. 1934;37:29-38.
23. Mulvaney RL. Nitrogen-inorganic forms. In: Sparks DL, Page AL, Helmke PA, Loeppert RH, Soltanpour PN, Tabatabai MA, Johnston CT, Sumner ME, editors. Methods of soil analysis: Part 3. Chemical methods. Madison (WI): American Society of Agronomy; 1996. p. 1123-84.
24. Bray RH, Kurtz LT. Determination of total, organic and available forms of phosphorus in soil. Soil Sci. 1945;59:39-45.
25. Jackson ML. Análisis químico de suelos. Barcelona: Ediciones Omega; 1964. 662p.
26. Bremmer JM, Mulvaney CS. Nitrogen total. In: Page AL, Miller RH, Keeney DR, editors. Methods of Soil Analysis: Part 2. Chemical and Microbiological Properties. Madison (WI): American Society of Agronomy; 1982. p. 595-624.
27. Ritchie W, Hanway J. How a corn plant develops. Iowa: State University of Science and Technology; 1997. 21p. (Iowa Special Reports; 48).
28. Lemaire G, Gastal F. Quantifying crop responses to nitrogen and avenues to improve nitrogen-use efficiency. In: Lemaire G, Gastal F, Durand JL, Louarn G. Crop physiology. Lusignan: Academic Press; 2015. p. 161-206. (Crop physiology).
29. Iqbal Z, Latif A, Ali S, Iqbal MM. Effect of fertigated phosphorus on P use efficiency and yield of wheat and maize. Songklanakarin J Sci Technol. 2003;25(6):697-702.
30. Allen R. Evapotranspiración del cultivo: guías para la determinación de los requerimientos de agua de los cultivos. Roma: FAO; 2006. 298p. (Riego y Drenaje; 56).
31. Caviglia O, Sadras V, Andrade F. Modelling long-term effects of cropping intensification reveals increased water and radiation productivity in the south-eastern Pampas. Field Crops Res. 2013;149:300-11.
32. Trenbath BR. Resource use by intercrops. In: Francis CA, editor. Multiple cropping systems. New York: MPC; 1986. p. 57-81.
33. Di Rienzo JA, Casanoves F, Balzarini M, Gonzalez L, Tablada M, Robledo CW. InfoStat [Internet]. Version 2016. Córdoba: Universidad Nacional de Córdoba, Facultad de Ciencias Agropecuarias; 2016 [cited 2021 July 26]. Available from: https://bit.ly/3dDvIyu.
34. INIA. Banco
de datos agroclimáticos [Internet]. Montevideo:
INIA; [date unknown] - [cited 2021 Jul 26]. Available from: https://bit.ly/2KOj2dZ.
35. USDA. Guide Soil Quality Test Kit Guide. Washington: USDA; 1999. 88p.
36. Piedrahíta O. Acidez del suelo [Internet]. 2009 [cited 2021 Jul 26]. Available from: https://bit.ly/3ryhR3A.
37. Barbazán MM, Bordoli JM, Coitiño J, del Pino A, Hoffman E, Mazzilli S. Avances en estudios de potasio en Uruguay. In: Nutrición de los cultivos para la intensificación productiva sustentable. Acassuso: IPNI; 2013. p. 151-5.
38. Perdomo C. Recomendación de Dosis de Fertilización [Internet]. [cited 2021 Jul 26]. 6p. Available from: https://bit.ly/2TCjocn.
39. Pizarro F. Riego localizado de alta frecuencia. 2nd ed. Madrid: Mundi-Prensa; 1990. 471p.
40. Teixeira de Mello F. Efecto del uso del suelo sobre la calidad del agua y las comunidades de peces en sistemas lóticos de la cuenca baja del Río Santa Lucía (Uruguay) [master’s thesis]. Montevideo (UY): Universidad de la República, Facultad de Ciencias; 2007. 58p.
41. Lafitte H. Fisiología del maíz tropical. In: Paliwal RL, Granados G, Lafitte HR, Violic AD, editors. El maíz en los trópicos: mejoramiento y producción. Roma: FAO; 2001. 8p.
42. Rodríguez LA, Sombrero S, Cedrán M. Efectos de la fertilización nitrogenada en el cultivo de maíz. Tierras de Castilla y León: Agricultura. 2014;(223):44-51.
43. Soto O, Jahn B, Arredondo S. Mejoramiento del porcentaje de proteína en maíz para ensilaje con el aumento y parcialización de la fertilización nitrogenada. Agric Téc. 2004;64(2):156-62.
44. Ruiz I. Características nutritivas de hojas verdes y secas de maíz destinado a ensilaje. Agric Téc (Chile). 1993;53:356-8.
45. Barrios M, Basso C. Efecto de la fertilización nitrogenada sobre componentes del rendimiento y calidad nutricional del grano de seis híbridos de maíz. Bioagro. 2018;30(1):39-48.
46. Tanaka A, Yamaguchi J. Producción de materia seca, componentes de rendimiento y rendimiento de grano en maíz. Chapingo: Rama de botánica; 1981. 124p.
47. Bravo A, Chan J. Relaciones agua-suelo-planta atmósfera del maíz de riego en zonas semiáridas. Terra. 1987;5(2):132-9.
48. Lemcoff J, Loomis R. Nitrogen influences on yield determination in maize 1. Crop Sci. 1986;26(5):1017-22.
49. Blumenthal J, Lyon D, Stroup W. Optimal plant population and nitrogen fertility for dryland corn in western Nebraska. Agron J. 2003;95(4):878-83.
50. Pietrobón MH, Imvinkelried O, Dellaferrera IM, Montenegro AJ. Eficiencia de uso de los recursos, productividad producción en maíz según diferentes cultivos antecesores. FAVE Secc Cienc agrar. 2016;15(1):74-84.
51. Pedrol HM, Castellarín JM, Ferraguti F, Rosso O. Respuesta a la fertilización nitrogenada y eficiencia en el uso del agua en el cultivo de maíz según nivel hídrico. Inf agron Cono Sur. 2008;(40):17-20.
52. Fontanetto H, Keller O, Giailevra D, Belotti L, Negro C. Aspectos del manejo del cultivo de maíz de segunda y de la fertilización nitrogenada en la región pampeana norte de Argentina. Información Técnica Cultivos de Verano. 2008;(112):37-45.
53. Roque C, Heredia S, Del Franco ME, Benedetto N, Mastromauro M, Boveda M. Experiencias prácticas sobre manejo de riego por pulsos con enfoque en fertirriego [Internet]. 2017 [cited 2021 Jul 26]. 44p. Available from: https://bit.ly/3kWOUgd.
54. Esteve GJ. Apuntes sobre riego localizado. Servicio de Extensión Agraria. 1986;(2):29-37.
55. Wong JAC, Sánchez DGR, Ríos JLB, Cervantes GG, Sosa ES. Rendimiento de maíz forrajero en respuesta a fertilización nitrogenada y densidad de población. Rev Fitotec Mex. 2006;29(2):97-101.
56. Alvarez R, Steinbach HS, Alvarez C, Grigera S. Recomendaciones para la fertilización nitrogenada de trigo y maíz en la pampa ondulada. Informaciones Agronómicas. 2003;18:14-9.
57. Cabrera ML. Mineralización y nitrificación: procesos claves en el ciclo del nitrógeno. Inf agron Cono Sur. 2007;34:1-9.
58. Perdomo CH, Barbazán M, Durán Monzoni JM. Nitrógeno. Montevideo: Facultad de Agronomía; 2008. 74p.
59. Murungu FS, Chiduza C, Muchaonyerwa P, Mnkeni PNS. Decomposition, nitrogen and phosphorus mineralization from winter-grown cover crop residues and suitability for a smallholder farming system in South Africa. Nutr Cycling Agroecosyst. 2011;89(1):115-23.
60. Ceriani M, Innella JA. Efecto de la fertilización nitrogenada tardía (V10-11) sobre el rendimiento de maíz en condiciones de riego y secano [grade’s thesis]. Montevideo (UY): Universidad de la República, Facultad de Agronomía; 2012. 66p.
61. Abraham I, Falco N. Efecto de la fertilización nitrogenada tardía (V10-12) sobre el rendimiento de maíz en condiciones de riego y secano [grade’s thesis]. Montevideo (UY): Universidad de la República, Facultad de Agronomía; 2016. 57p.
62. Blackmer AM, Schepers JS, Varvel GE, Walter-Shea EA. Nitrogen deficiency detection using reflected shortwave radiation from irrigated corn canopies. Agron J. 1996;88(1):1-5.
63. Farrell M, Gili A, Noellemeyer E. Spectral indices from aerial images and their relationship with properties of a corn crop. Precis Agric. 2018;19(6):1127-37.
64. Maresma Á, Ariza M, Martínez E, Lloveras J, Martínez-Casasnovas JA. Analysis of vegetation indices to determine nitrogen application and yield prediction in maize (Zea mays L.) from a standard UAV service. Remote Sens. 2016;8(12):973.
65. Feng D, Xu W, He Z, Yang M. Advances in plant nutrition diagnosis based on remote sensing and computer application. Neural Comput Appl [Internet]. 2020 [cited 2021 Jul 26];32:16833-42. Available from: https://bit.ly/3i3icYH.
66. Garcia Arnal Barbedo J. Detection of nutrition deficiencies in plants using proximal images and machine learning: a review. Comput Electron Agric [Internet]. 2019 [cited 2021 Jul 26];162:482-92. Available from: https://bit.ly/3eXaHkg.
Author notes
juanmaernst@gmail.com
Additional information
Author contribution statement: BA:
conception, experiment design, supervision, conduction, statistical processing,
interpretation of results, writing, proofreading.
BMM:
conception, experiment design, supervision, conduction, interpretation of
results, proofreading.
EJM:
conception, experiment design, supervision, conduction, laboratory analysis,
interpretation of results, literature review, writing.
LP:
conception, experiment design, supervision, conduction, interpretation of
results, proofreading.
Editor: The
following editor approved this article.
José
A. Terra (https://orcid.org/0000-0003-0713-9788)
Instituto
Nacional de Investigación Agropecuaria (INIA), Treinta y Tres, Uruguay
Alternative link
http://agrocienciauruguay.uy/ojs/index.php/agrociencia/article/view/412/1045 (pdf)


 [1]
[1] [2]
[2] [3]
[3] [4]
[4] [5]
[5] [6]
[6] [7]
[7] [8]
[8] [9]
[9]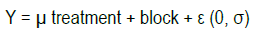 [10]
[10]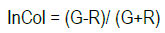 [11]
[11]

