Abstract: Faecal egg count (fec) is used in sheep to decide when to drench. It is also used in genetic evaluations, in which case fec should be recorded when the parasite burden is large enough so that variation among animals can be expressed. Another requisite is that the fraction of animals with zero fec should be below 0.1. In order to decide the appropriate moment for drenching, or fec recording in the whole group in the case of genetic evaluations, fec is monitored in a random sample of animals from the group. Two questions arise: (i) what is the appropriate sample size to determine if the average fec has reached a threshold? and (ii) what is the sample size needed to determine that the fraction of animals with a fec of zero is 0.1 or less? In this paper we calculate the number of animals to be sampled for a range of fec means and standard deviations, as well as for different fractions of animals with a zero fec. Regarding fec, we found that sample size was greater than the recommended 10 to 20 animals. With respect to fraction of animals with a fec of zero, sample size was even greater than for fec. Given the insufficient sample size currently used, we recommend a revision of the topic and a statistically based reformulation of sampling guidelines.
Keywords: faecal worm egg count, parasite burden, sampling, sheep.
Resumen: El conteo de huevos por gramo (hpg) en las heces de ovinos se utiliza para decidir cuándo suministrar un antihelmíntico. También se usa en las evaluaciones genéticas, en cuyo caso el registro de hpg debe hacerse cuando exista una carga parasitaria suficiente que permita la expresión de variación entre animales. Se busca también que la fracción de animales con registro de hpg de cero sea inferior a 0,1. A efectos de determinar el momento apropiado para dosificar, o de medición de hpg en todo el grupo en caso de las evaluaciones genéticas, se hace un seguimiento midiendo hpg en una muestra tomada al azar. Surgen dos preguntas: (i) ¿cuál es el tamaño adecuado de muestra para determinar si el promedio alcanzó el umbral de hpg? y (ii) ¿cuál es el tamaño necesario de muestra para determinar que la fracción de animales con un conteo de cero es igual o inferior a 0,1? En este trabajo calculamos el número necesario de muestras para un rango de medias y desvíos estándar de hpg, y de fracción de animales con conteo de cero. Para hpg encontramos que el tamaño necesario de muestra es mayor a los 10 a 20 animales que se recomienda. Para la fracción de animales con conteo de cero hpg el tamaño de muestra requerido es aún mayor. Dado lo insuficiente del tamaño de muestra actualmente utilizado recomendamos que el tema se revise y se reformulen los lineamientos de muestreo basándose en criterios estadísticos.
Palabras clave: huevos por gramo en heces, carga parasitaria, muestreo, ovinos.
Resumo: A contagem de ovos por grama (opg) nas fezes de ovinos é usada para decidir quando fornecer um anti-helmíntico. Também é utilizada em avaliações genéticas, quando o registro do opg deve ser realizado quando houver uma carga parasitária suficiente para permitir a expressão de variação entre os animais. Outro requisito é que a fração de animais com opg zero seja inferior a 0,1. Para determinar o momento apropriado para a dosagem ou para medir o opg em todo o grupo no caso de avaliações genéticas, o opg é medido em uma amostra colhida aleatoriamente. Duas perguntas surgem: (i) qual é o tamanho de amostra apropriado para determinar se a média atingiu o limite de opg? e (ii) qual é o tamanho da amostra necessário para determinar que a fração de animais com contagem zero é igual ou menor que 0,1? Neste trabalho, calculamos o número necessário de amostras para uma quantidade de médias e desvios-padrão do opg e de fração de animais com contagem zero. Para o opg, descobrimos que o tamanho da amostra necessário é maior que os 10 a 20 animais recomendados. Para a fração de animais com contagem zero de opg, o tamanho da amostra necessário é ainda maior. Dado o tamanho insuficiente da amostra usada atualmente, recomendamos que o tópico seja revisado e que as diretrizes de amostragem sejam reformuladas com base em critérios estatísticos.
Palavras-chave: ovos por grama nas fezes, carga parasitária, amostragem, ovinos.
Animal production and pastures
Sample size needed to make decisions about measuring FEC in a contemporary group of lambs
Tamaño necesario de muestra para tomar decisiones acerca de la medición de HPG en un grupo contemporáneo de corderos
Tamanho de amostra necessário para tomar decisões sobre a medição de OPG em um grupo contemporâneo de cordeiros
Received: 20 June 2017
Accepted: 16 April 2020
Published: 09 July 2020

This work is licensed under Creative Commons Attribution 4.0 International.
Faecal egg count (fec) is used in sheep as a management tool to decide when to drench in order to reduce the parasite burden(1). It is also used in sheep genetic evaluations, where selection for low fec is the aim(2). In the latter case, fec recording should be carried out when the parasite burden is large enough to allow the expression of between animal variation. National and international protocols suggest drenching or recording the whole group when a fec range of 500 to 1000 is reached. It is also sought that the fraction of animals with a fec of zero should be less than 0.1(3)(4). In order to decide when to drench, or to record fec in the whole contemporary group in the case of genetic evaluations, a random sample of animals is monitored for fec. Two questions arise: (i) what is the necessary sample size to determine if average fec reached a value of 500 or 1000? and (ii) what is the necessary sample size to determine that the fraction of animals with fec equal to zero is less than or equal to 0.1?
Collecting faeces and recording fec is time consuming and costly. If the number of animals sampled is too large, time and money will be wasted. By contrast, if the number sampled is too small, the information gathered will be of no value, and the resources used would have been wasted. In order to determine the necessary sample size, one has to decide the accuracy with which to estimate the population parameters, based on the sample. Sample size will be the result of a balance between the desired accuracy of the estimate, and the effort and cost entailed in obtaining it.
Practical guides on internal parasite control recommend some target values. WormBoss(5), the Australian program for the control of internal parasites in sheep and goats, recommends sampling no less than 20 animals, whereas Fiel and others(6) in Argentina recommend a minimum of 10 animals, and “ideally”, 20. In Uruguay, Pereira(7) recommends a minimum of 15 animals and an average fec of at least 600 to 800. Also in Uruguay, Castells(8) recommends monitoring 15 to 20 animals, and recording the whole group when the average fec in the sample is greater than 500 and the animals with a record of zero are less than 20%.
In this paper we present a logical framework (theory and examples) to work out the sample size of monitored animals in order to decide when to drench or when to record fec in the whole contemporary group. The treatment of the subject matter follows the methodology given in statistical textbooks such as Freund(9), Ott and Longnecker(10), and Snedecor and Cochran(11).
There are two main considerations we should make when determining the necessary sample size: (i) specify the “tolerable” error, that is, the desired magnitude of the confidence interval, and (ii) establish the confidence level with which to make the estimate.
If we specify a confidence interval that is too broad, the estimate of the mean (µ) will not be very informative. Similarly, a low level of confidence will probably result in an erroneous confidence interval that might not include µ. By contrast, if we establish a narrow confidence interval and a high level of confidence, the necessary sample size may be too large and difficult to justify in terms of time and cost. That said, what constitutes an appropriate degree of certainty?
In practice, a confidence level of 95% is often chosen. This has been generally adopted in agriculture because it may be argued that it is acceptable for biological variables related to production(12). In the long term it results in a probability of 1 in 20 of not including the parameter value of the population, a situation that may generally be considered acceptable for the type of work in question. The “tolerable” error depends on the context, namely, our knowledge about the implications of variability in the character under study. For example, we could establish a tolerable error of 200 or 400 for fec, implying confidence limits of 1000 ± 100 or ± 200, respectively. In the case of fraction of animals with zero fec, the tolerable error could be 0.02 or 0.04, corresponding to confidence limits of 0.1 ± 0.01 o ± 0.02, respectively.
Call µ and ȳ the population and sample mean, respectively. If we take a sample of size n, the standard error (S) of ȳ is equal to: , where σ is the standard deviation of the character in the population, Φ = n/N (fraction sampled) and N is the population size. When n is small relative to N (say, Φ < 0.1) the fraction sampled may be ignored without fear of incurring in any important error(11). This means that the standard error of the mean in the sample is more dependent on the sample size than on the population size. We ignore Φ in the derivations that follow but we shall consider it later in relation to the correction for finite size of the sampled population.
Three factors determine the confidence interval estimated for a population mean µ from a sample: (i) the desired confidence level (zα/2 value, i.e. 1.96 for 95%), (ii) the standard deviation of the character, and (iii) the sample size. We may infer the magnitude of the standard deviation from earlier samplings or from other studies of the character in question.
Assume we wish to estimate µ with a confidence interval (tolerable error) E. The confidence limits are ȳ ± L, where ȳ is the sample estimate of µ and L = E/2. For a confidence level of 95%, our estimate of µ is: . Thus, , where σ is the standard deviation of the character and n is the sample size. Rearranging, we obtain: . Consistent with what we earlier stated, sample size does not depend on the total number of animals in the population under study. We return to this point later in the paper in relation to small populations.
We treat the fraction of animals with zero fec as having a binomial distribution. Then, , where p and q are the proportion of animals with zero and greater than zero counts, respectively. Rearranging, we obtain: . Note that p, q and L may be expressed as a proportion or as a percentage, but when performing calculations, the same unit must be used for p, q and L.
Our experimental records of fec show that the standard deviation is always of similar magnitude as the mean, and often somewhat greater (~10 to 20%). This is consistent with the mean and standard deviation values reported by Goldberg and others(13) for 8 to 12-month-old sheep. Hence, the mean and standard deviation values of fec chosen in Table 1.
Necessary number of animals to be sampled to estimate fec with different confidence intervals, for a range of population means and standard deviations
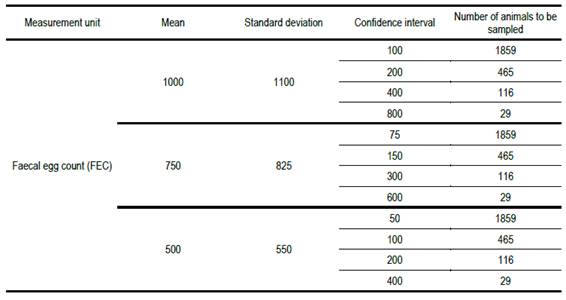
When the desired confidence interval for the estimate of mean fec is 10% of the population mean value, the required number of animals to be sampled is prohibitively high. It is only when the confidence interval is 80% of the population mean value that the necessary number of animals to be sampled is near the number sampled in practice (20). A sample of 20 animals implies a confidence interval of 96% of the population mean.
There are reports indicating that a large fraction of internal parasites in a flock may reside in a relatively small fraction of the animals(3). This may be the reason why in the implementation of internal parasite control programs there is sometimes a requirement that the fraction of animals with fec equal to zero should not exceed 0.10, recorded with a precision of 100. The fraction of animals with fec equal to zero is calculated from the same sample used to estimate mean fec.
Our experimental records show that for mean fecs of 1000, 750 and 500, the corresponding fraction of animals with a fec of zero is around 0.05, 0.10 and 0.15, respectively. The values chosen in Table 2 to calculate the necessary number of animals to be sampled are consistent with this experience.
Number of animals to be recorded for fec to estimate the fraction with zero count with different confidence intervals, for a range of population means and standard deviationsA - Calculated as (pq)0.5, where p is the fraction of animals with fec of zero
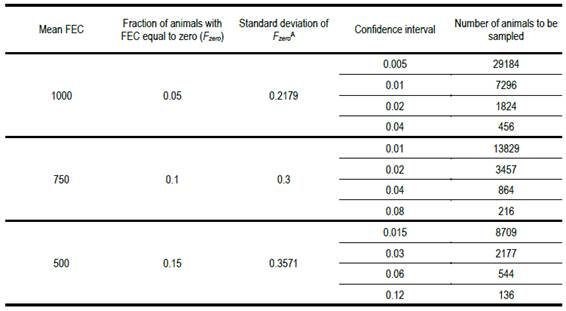
A - Calculated as (pq)0.5, where p is the fraction of animals with fec of zero
When the confidence interval with which we wish to estimate the fraction of animals with a zero fec is 10% of the population mean value, the necessary number of animals to be sampled is extraordinarily high. It is only when the confidence interval is 80% of the mean and the fraction of animals with a zero fec is 0.15, that the necessary number of animals to be sampled nears something that may be practicable. Note, however, that even in that case, the number is seven times greater than what the guidelines state. The recommended number (20 animals sampled) implies a confidence interval more than twice as large as the population mean. The recommended practice is questionable. The results in Table 2 show that it is not possible to adequately estimate the fraction of animals with a zero fec from a sample of animals smaller than 100.
In the calculations leading to the results presented in Tables 1 and 2 we ignored the correction for small populations mentioned by Snedecor and Cochran(11). These authors recommend making the correction when the fraction of sampled animals is greater than 10% of the total. In such cases the value of n should be corrected as follows: , where nc is the number of animals to be sampled corrected for finite size, and Φ is the fraction sampled. Snedecor and Cochran(11) indicate that when the sampled fraction is smaller than 10% the correction is unnecessary.
Table 1 shows that the necessary number of animals to be sampled, for a range of confidence intervals of 10 to 80% of the mean, is greater than the greatest number currently recommended of 20. The same result is obtained for different mean fecs because we assumed confidence intervals proportional to the mean. The calculations also assume that fec is normally distributed or approximately so. We know that, particularly in small populations, that assumption is unlikely to be satisfied. This would make the problem even more serious.
As an example, using round numbers, for the case in Table 1 where the necessary number of animals to be sampled is 116 animals, if the total number in the group was 232, the correction would result in nc = 116 / (1 + 0.5) = 77,3 ~ 77, smaller than 116, but still much greater than the currently recommended sample size. If the most commonly encountered situations were defined, tables could be developed as a guide for populations in which the fraction sampled was greater than 10% of the total.
Table 2 shows that the necessary number of animals to be sampled to estimate the fraction with a zero fec is very high, even if we assume a fraction 0.15 have that value. This indicates that a sample of 20 or fewer animals is far from satisfactory. Even in the most favourable case (p = 0.15 and a confidence interval of 80% of the population mean) the necessary number of animals to be sampled is almost seven times greater than 20, the maximum number currently recommended.
Jointly considered, Tables 1 and 2 show that the current guidelines regarding number of animals to be sampled for fec suggest a number much smaller than that emerging from the present statistical study. Internal parasites in sheep have been mainly controlled by treatment with anthelmintics. This strategy has not been entirely successful. Among other problems, the parasites have developed resistance to some chemical groups, making treatments less effective, or in extreme cases, totally ineffective. At best, decisions about when to drench are made on the basis of fec performed in a sample of 10 to 20 animals. This sample size is well below the recommendations emerging from our statistical study of the problem. It is difficult to avoid the conclusion that the inappropriate (much smaller than required) sample size on which decisions about when to drench are made is at least partly responsible for the failure to control internal parasites in grazing sheep. Given the insufficient sample size currently used, we recommend that guidelines should be revised and that, based on statistical criteria, they should be reformulated.
http://agrocienciauruguay.uy/ojs/index.php/agrociencia/article/view/206/303 (pdf)
Dr. Daniel Castells was the first in drawing our attention to the problem we address in this paper.
Gabriel Ciappesoni ORCID: https://orcid.org/0000-0002-0091-3956
Instituto Nacional de Investigación Agropecuaria (INIA), Montevideo, Uruguay.
Necessary number of animals to be sampled to estimate fec with different confidence intervals, for a range of population means and standard deviations
Number of animals to be recorded for fec to estimate the fraction with zero count with different confidence intervals, for a range of population means and standard deviationsA - Calculated as (pq)0.5, where p is the fraction of animals with fec of zero
A - Calculated as (pq)0.5, where p is the fraction of animals with fec of zero