1. Introduction
Potato (Solanum tuberosum) is one of the main contributing plant crops for food security in the world, due to its high yield per unit of area and time, which makes it the third most consumed crop in the world (FAOSTAT, 2012; Devaux et al., 2014). Thus, understanding how environmental factors determine growth patterns and production has been one of the most important issues on potato crop research, which aims to help improve the management of agricultural resources (Tiemens-Hulscher et al., 2014; Passos et al., 2017). Nitrogen fertilization is one of the most relevant practices in potato farming systems since nitrogen is the most important nutrient during all phenological potato stages (Van Delden, 2001; Machado & Sarmiento, 2012; Qiqige et al., 2017; Nurmanov et al., 2019).
Potato yield is strongly influenced by nitrogen fertilization (Van Delden, 2001; Qiqige et al., 2017). The N effect on tuber yield has been well demonstrated (Alva et al., 2002; Maltas et al., 2018). However, the potato growth response depends largely on the nitrogen availability in the soil, which may have a considerable effect on the partitioning of assimilates and nitrogen to the different plant organs (Silva et al., 2013; Goméz et al., 2017; Ohamed et al., 2017). This balance of the distribution of biomass and nitrogen to the different compartment may have significant effects on tuber production (Machado & Sarmiento, 2012; Silva et al., 2013). For instance, excessive use of nitrogen has been singled out as the cause of higher aboveground biomass production in detriment of tuber production (Alva et al., 2002; Silva et al., 2013). On the other hand, several studies have shown that nitrogen availability in the soil may affect the growth of belowground plant organs (Lambers & Oliveira, 2019). For example, higher nitrogen availability can induce a greater growth of aboveground biomass (i.e. shoots) to the detriment of less root growth (Forde, 2002). Nevertheless, it is necessary to continue to explore these eco-physiological processes in order to enhance the efficiency of the use of agroecological resources in potato production systems.
Consequently, the objective of this study was to evaluate the effect of nitrogen nutrition on biomass and nitrogen partitioning patterns during the potato crop development (Cultivar Granola) in Mérida, Mérida State, Venezuela. Our hypothesis for this study was that the variation in nitrogen supply induces changes in the biomass partitioning patterns among the different organs of the potato crop. Therefore, an important proportion of nitrogen will be destined to tissues that are less demanding for biosynthesis, such as roots, but in detriment of assimilatory biomass (leaf and shoots). This research may contribute to the understanding and enhancing of nitrogen use efficiency in each developmental stage.
2. Material and methods
2.1. Field study
The field trials were set up in Mérida, in the State of Mérida, Venezuela (8° 35’ 30’’ N - 71° 08’ 30’’ W, 1920 mamsl). The monthly temperatures in the area vary from 13 to 19 °C. Rainfall shows a tetra-seasonal pattern with a 2000 mm year average, and with two low rainfall periods (December to March, and June to August), and two high rainfall periods (April to June, and September to November). The soil has a sandy-loam consistency, with nitrogen availability of 0.09%, phosphorus availability of 2.2 ppm, interchangeable potassium of 1.1 meq/100 g, and a 5.8 pH. The net depth of the profile was of about 60 cm, and the horizontal surface (0 to 27 cm) showed an apparent density of 0.94 g cm-3 (Villa et al., 2017).
The cultivar evaluated was Granola, one of the most cultivated in the region due to its high yield and consequent economic importance. This cultivar has a development cycle of 3.5 to 4 months from sowing to harvest (Villa & Sarmiento, 2009). Tuber formation starts at 30 days after emergence (DAE), and tuber filling continues until maximum leaf expansion, which takes place at approximately 60 days after sowing (DAS). Crop emergence was defined as the moment when 50% of the plants had emerged after sowing.
2.3. Experimental design
Three nitrogen fertilization treatments were evaluated in this study: 0 kg of N ha-1 (no nitrogen supply), 133 kg of N ha-1 and 400 kg of N ha-1. These treatments were set up in a randomized complete block design with three replications. Each plot (27 m2) was established with a planting density of 4.44 plants per m-2. Each plot contained six rows 6 m long, with two outer rows acting as barriers (Figure 1).
In all treatments, sources of N were chicken manure (3% N) and ammonium sulfate (NH4)2SO4. In treatment of 300 kg of N ha-1 and 133.3 kg of N ha-1 were applied, 100 kg N ha-1 at planting time and 33.3 kg N ha-1 applied to hilling. The 100 kg N ha-1 of nitrogen applied during planting were distributed as 66.6 kg N ha-1 as chicken manure and 33.3 kg N ha-1 as ammonium sulfate. The application of the chicken manure was 2220 kg ha-1 (amount of organic fertilizer), which is equivalent to 5.99 kg plot; and the application of ammonium sulfate was at a dose of 158.6 kg ha-1 (amount of inorganic fertilizer). In hilling, an additional 33.3 kg N ha-1 was applied as ammonium sulfate. In the 400-N treatment, 400 kg N ha-1 were applied, 300 kg N ha-1 at planting time and 100 kg N ha-1 during hilling. The 300 kg ha-1 initially applied were distributed as 200 kg N ha-1 as chicken manure and 100 kg N ha-1 as ammonium sulfate. The application of the chicken manure was 6666.6 kg ha-1 (amount of organic fertilizer), which is equivalent to 18 kg plot; and the application of the ammonium sulfate was at a dose of 476 kg ha-1 (amount of inorganic fertilizer). During hilling, an additional 100 kg N ha-1 was applied as ammonium sulfate. Additional 100 kg ha-1 of P2O5 as phosphate rock (25% assimilable P2O5) was applied during sowing, as well as 200 kg ha-1 of K2O as potassium sulfate (17% assimilable K2O) to all experimental plots.
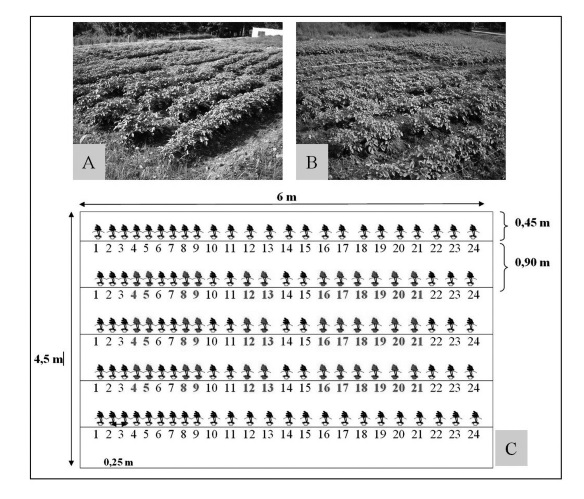 Figure 1
Plot design (A,B,C) for sample collection along the four selected phenological phases. Numbers 4-5, 8-9, 12-13 corresponded to the plants that were sampled during emergence, foliar expansion and tuber filling phases, respectively; completing 6 plants in each sample per plot. Plants 16-21 correspond to the last sampling carried out at harvest (C).
Figure 1
Plot design (A,B,C) for sample collection along the four selected phenological phases. Numbers 4-5, 8-9, 12-13 corresponded to the plants that were sampled during emergence, foliar expansion and tuber filling phases, respectively; completing 6 plants in each sample per plot. Plants 16-21 correspond to the last sampling carried out at harvest (C).
2.4. Sampling and measurements
Sampling took place during the main phenological stages of the cultivation, during emergence (13 DAE), tuberization (36 DAE), maximum leaf expansion (57 DAE), and prior to the harvest (85 DAE) (Villa & Sarmiento, 2009). Biomass and nitrogen measurements were taken for each plot and treatment. Measures were carried out in each plot by randomly selecting plant rows and omitting the two first rows on each side, as to avoid edge effects (Figure 1). Crop emergence was considered to have taken place when 50% of the plants had emerged after sowing (Machado & Sarmiento, 2012).
During the development of the crop, four samplings were made to estimate biomass and nitrogen contents within each of the aboveground and belowground organs, as a function of the number of days after emergence (DAE). Aboveground and belowground biomass was determined in each phonological stage from six plants selected in each plot. With the exception of the last sampling, eighteen plants per plot were harvested, given the significance of the crop yield from the agronomic point of view (Figure 1). Samples were dried at 70°C in an oven until they reached a constant weight. These samples were subsequently weighted and milled to further obtain composite samples per plot and sampling session.
The Kjeldahl method was used to determine the total nitrogen concentration per fertilization treatment, using 100 mg per setting. Nitrogen concentration per unit leaf area (mg N cm-2) was estimated as the quotient between nitrogen concentration per weight unit and the specific leaf area. This was implemented in each plot and fertilization treatment during the main phenological stages.
2.5. Statistical analyses
All analyses were carried out using the software R version 2.3.2.4 (R Core Team, 2018). Variation in biomass and nitrogen measures were compared between all treatments by one-way analysis of variance (ANOVA; for normally distributed data) followed by a post hoc Tukey’s test (p<0.05). The different treatments were the factors and the block design effects were key aspects taken into account. Biomass and nitrogen data within the different plant organs over the course of evaluation time were in accordance with polynomic functions, varying according to the DAS. In the case of accumulated nitrogen in total biomass and in the tubers, data were in accordance with the Gompertz equation: Y= a*exp-b*exp-c*t, where Y corresponded to biomass, t corresponded to time, and a, b, and c to the parameters obtained by adjusting the experimental data.
3. Results and Discussion
3.1 Biomass and nitrogen partitioning
Total biomass showed clear differences between treatments during the periods of maximum leaf expansion (57 DAE) and final harvest on the 85th DAE, with the sequence 400-N > 133-N > 0-N (Figure 2A). Tuber biomass in fresh and dry weight at the final harvest showed significant differences (p<0.05) between treatments (Table 1). Tuber yield also followed the sequence 400-N > 133-N > 0-N.
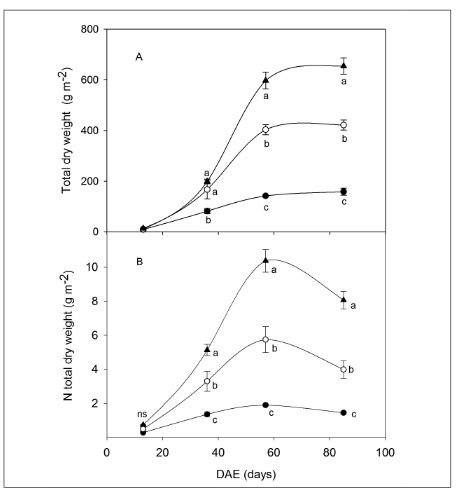 Figure 2
Pattern of total dry weight accumulation (A) and accumulated nitrogen in total dry weight (B) during days after emergence (DAE) in the different nitrogen fertilization treatments: 0-N (●) 133-N (○) and 400-N (▲). Different letters indicate significant differences between treatments per sampling period, ns (no significant differences) (p<0.05).
Figure 2
Pattern of total dry weight accumulation (A) and accumulated nitrogen in total dry weight (B) during days after emergence (DAE) in the different nitrogen fertilization treatments: 0-N (●) 133-N (○) and 400-N (▲). Different letters indicate significant differences between treatments per sampling period, ns (no significant differences) (p<0.05).
Nitrogen content in the total biomass of the crop showed significant differences between the treatments in all of the development stages, except for the ones near emergence (Figure 2B). In the three different treatments, total nitrogen content in the biomass tended to increase until the maximum leaf expansion stage (57 DAE), after which it decreased until the final harvest (Figure 2).
Table 1
Differences in tuber fresh weight (TFW), tuber dry weight (TDM), total dry weight (DW) during harvest, and accumulated nitrogen in total dry weight (NDW). The field experiment was set in Mérida, in the State of Mérida, Venezuela.

The values in parentheses correspond to the normal deviation. Different letters in the columns indicate significant differences between treatments (Tukey HSD, p<0.05).
|
Treatments
|
TFW
mg ha-1
|
TDM
mg ha-1
|
Total DM
mg ha-1
|
Total NDW
kg N ha-1
|
R2
|
|
0-N
|
7.87 (0.87) c
|
1.35 (2.72) c
|
1.59 (0.09) c
|
14.5 (0.10) c
|
0.92
|
|
133-N
|
22.01 (1.23) b
|
3.76 (3.18) b
|
4.22 (0.18) b
|
39.9 (050) b
|
0.90
|
|
400-N
|
34.44 (1.37) a
|
5.89 (4.01) a
|
6.55 (0.16) a
|
80.6 (0.5) a
|
0.94
|
This study shows that nitrogen fertilization had significant effects on total biomass and tuber production in potato production. The results are consistent with those of several other research studies reporting that biomass accumulation has been greater insofar as nitrogen supply increases (Van Delden, 2001; Machado & Sarmiento, 2012; Maltas et al., 2018; Nurmanov et al. 2019). However, the average values of total biomass obtained in this study tend to be lower, even in the high fertilization treatment (400-N). Conversely, biomass accumulation and tuber yield levels in different studies are shown to be much greater when there is a moderate application of nitrogen fertilizer (approximately 180 kg N ha-1), even when cultivars grow under fertilization conditions without nitrogen (Van Delden, 2001; Goméz et al. 2017; Malta et al. 2018). Nevertheless, the same biomass accumulation pattern is present during phenostages when nitrogen supply increases (Van Delden, 2001; Silva et al., 2013).
3.2. Biomass partitioning
The patterns of biomass assignation across the different organs showed notable differences as a response to the nitrogen fertilization treatments. Shoot biomass increased from the first stages and up until maximum leaf expansion, then decreased until the final harvest (Figure 3A). On the other hand, necromass starts to increase after emergence, along with the accumulation in the 400-N treatment setting (Figure 3A). These results presume that ecophysiological changes took place to adjust the partitioning of assimilates from aboveground biomass to high-demand sinks. In this case, Sharifi et al. (2009) examined the responses of new Russet Norkotah cultivar clones to nitrogen fertilization. They found that there were no significant differences in yield production, with nearly 38 mg ha-1 for the TX112 and SRC cultivars, and two different treatments (0 and 150 kg N ha-1); except for the cultivar SRC with a nearly 50 mg ha-1 fertilization treatment. Allegedly, this cultivar could show a greater level of plasticity when there are nitrogen supply limitations, compared to the nitrogen supply conditions used in this study.
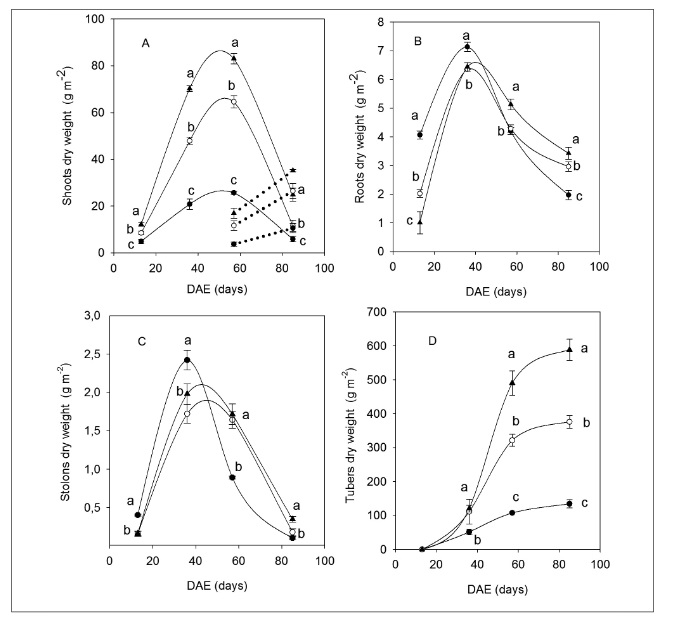 Figure 3
Dry weight accumulation patterns of different organs for the three fertilization treatments: 0-N (●), 133-N (○) and 400-N (▲) during days after emergence (DAE). The curves correspond to the adjustments with the polynomial (A,B,C) and Gompertz functions (D). The dotted lines represent necromass. Different letters indicate significant differences between treatments per sampling period (p<0.05).
Figure 3
Dry weight accumulation patterns of different organs for the three fertilization treatments: 0-N (●), 133-N (○) and 400-N (▲) during days after emergence (DAE). The curves correspond to the adjustments with the polynomial (A,B,C) and Gompertz functions (D). The dotted lines represent necromass. Different letters indicate significant differences between treatments per sampling period (p<0.05).
As for belowground biomass, the roots and stolons manifested a pattern of dissimilar distribution to that of the shoots, with a greater accumulation of root biomass in the case of the deficit treatment setting (0-N) during the first stages of crop development (Figure 3B and C). Starting from the 36th DAE, root biomass tended to diminish until the final harvest, with significant differences between treatments (p< 0.05). Tuber biomass increased through the DAE, with the same sequence 400-N > 133-N > 0-N (Figure 3C). These results are similar to those observed in previous studies (Alva et al., 2002; Machado & Sarmiento, 2012; Maltas et al., 2018). However, these results allow us to infer that ecophysiological processes may explain the few differences found in the different potato cultivars for tuber yield production when applying such contrasting fertilization treatments.
During crop development, the root/shoot and root/leaf ratios for the 0-N treatment were different compared to the 133-N and 400-N treatments. Under severe deficit conditions, a larger proportion of root biomass per unit of assimilatory biomass is produced, and this led to important differences (p<0.05) in relation to the rest of the fertilization treatments, 0-N > 133-N > 400-N (Figure 4).
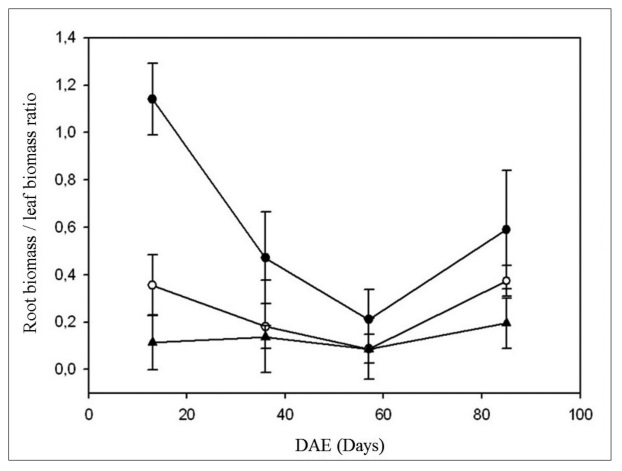 Figure 4
Effect of nitrogen fertilization treatments [0-N (●), 133-N (○) and 400-N (▲)] on the root biomass / leaf biomass ratio during days after emergence (DAE). Mean values are presented ± standard deviation.
Figure 4
Effect of nitrogen fertilization treatments [0-N (●), 133-N (○) and 400-N (▲)] on the root biomass / leaf biomass ratio during days after emergence (DAE). Mean values are presented ± standard deviation.
3.3. Nitrogen partitioning
Leaf nitrogen concentration for each of the treatments and phenological stages of the crop was higher compared to that of the other plant organs. In decreasing order, the organs with the most nitrogen concentration were the leaves, stems, roots, stolons and tubers (Figure 5). As a general pattern, nitrogen concentration within each organ tended to decrease significantly over the course of time. These results suggest that the higher levels of nitrogen concentration in the leaves, compared to the rest of the organs, could be due to the great demand for photosynthetic functions and the phenological stage, since the maintenance of vegetative growth is delayed by tuberization and filling of the tuber.
The accumulated nitrogen in aboveground biomass maintained a similar pattern for the different treatments, albeit with stark differences in phenological stages of the crop (Table 1). Within the shoots, nitrogen content started to increase from the first stages of development, reaching the maximum values around the 50th DAE. Later on, at the beginning of senescence, nitrogen content began to decrease rapidly until the final harvest (Figure 5A).
Under severe deficit conditions on the 13th DAE, more nitrogen was allocated to the roots compared to the rest of the treatments (Figure 5B). This same trend was found for the stolons, where accumulated nitrogen values for the 0-N treatment remained above the rest through the development of the crop (Figure 5C). The tubers showed contrasting nitrogen accumulation patterns on the final harvest. Additionally, it became clear that, approximately, from the 60th DAE on, there is a slight decrease in nitrogen content within this organ, for all treatment, until the final harvest (Figure 5D).
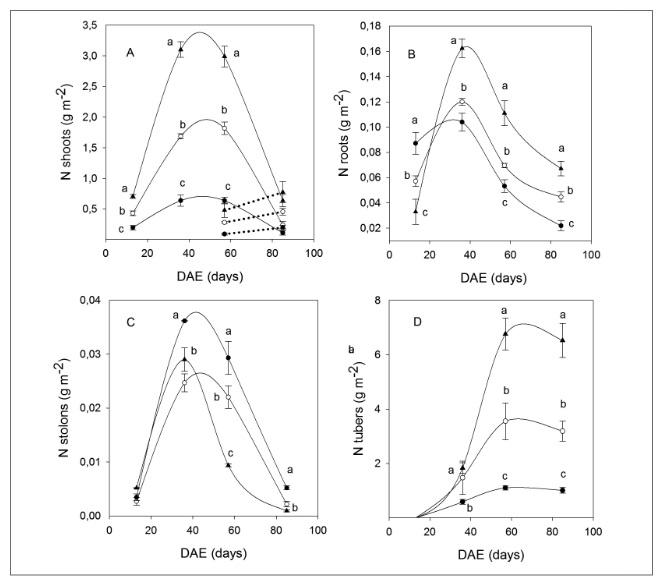 Figure 5
Patterns of accumulated nitrogen in total dry weight for shoots, A; roots, B; stolons, C; and tubers, D; during the days after emergence (DAE) for the different nitrogen fertilization treatments: 0-N (●) 133-N (○) and 400-N (▲). The curves correspond to the adjustments with the polynomial (A,B,C) and Gompertz functions (D). Different letters indicate significant differences between treatments per sampling period (p<0.05).
Figure 5
Patterns of accumulated nitrogen in total dry weight for shoots, A; roots, B; stolons, C; and tubers, D; during the days after emergence (DAE) for the different nitrogen fertilization treatments: 0-N (●) 133-N (○) and 400-N (▲). The curves correspond to the adjustments with the polynomial (A,B,C) and Gompertz functions (D). Different letters indicate significant differences between treatments per sampling period (p<0.05).
Currently, there is sufficient evidence on the effects of nitrogen nutrition on potato tuber production (Qiqige et al., 2017; Maltas et al., 2018). However, the evidence is still limited concerning biomass accumulation and partition to different plant organs under varied nitrogen fertilization doses in different potato cultivars of the tropical Andes. Thus, these studies are limited to analyzing biomass partitioning to the shoots and tubers, regardless of the partitioning to stolons and roots, and particularly less under nitrogen deficit conditions. In this study, the aim was to assess different growth parameters, such as accumulated root biomass as a possible additional indicator to enhance nitrogen use efficiency (Silva et al., 2013).
This study demonstrates that the largest deficit of nitrogen was produced by that assigned biomass to the roots, compared to aboveground biomass; mainly during the first stages, with values of 44, 19, and 8% for the treatments 0-N, 133-N, and 400-N, respectively. These results suggest that changes in the patterns of assimilate distribution constitute a plastic response of acclimation to stress under nitrogen deficit. This has been reported in several works dealing with different plant species (Forde, 2002; Lambers & Oliveira, 2019). Nevertheless, research on ecophysiological responses of potato cultivars in the tropical Andes is limited. These types of studies and results can be better used as indicators of sustainability of potato farming systems, in which the reduction and substitution of mineral fertilizers by organic fertilizers may be possible to maintain or increase yield (Tiemens-Hulscher et al., 2014, Ohamed et al., 2017).
Our results indicate that, under nitrogen deficit conditions, there is a higher root: shoot ratio with contrasting differences in relation to other fertilization treatments. This is consistent with other plant species, which show modifications in biomass partitioning throughout shoots and roots when they grow with nitrogen limitations (Forde, 2002). Meanwhile, Scheible et al. (1997) found that the high accumulation of NO3 in the shoots of tobacco plants correlates strongly with significant root growth inhibition, and with reduction in the root: shoot ratio. This explains why roots do not function independently from shoots and that both depend on conditions of carbon supply and nitrogen availability (Lambers & Oliveira, 2019). Similarly, Forde (2002) states that there are two main responses to nutrient variations in the soil, one depending on nitrogen concentration in the plant and, particularly in the shoots; and the other one as a result of a short-term fluctuation of nitrogen supply to the roots.
Throughout the development of the crop, the nitrogen concentration in each plant organ tended to show a significant reduction in each treatment condition, as a result of biomass dilution. This tendency was described by Greenwood et al. (1991) when they determined the minimum amount of nitrogen needed for the plant to attain their maximum growth rate. In previous studies, however, it was concluded that there are differences in nitrogen concentration levels among plants with C3 and C4 metabolisms. Previous studies have analyzed these processes, finding consistent differences that are not limited to the levels of nitrogen availability for the plant, but also include differences in the accumulated nitrogen content in the biomass (Gastal & Lemaire 2002; Lemaire et al., 2007).
4. Conclusions
This research demonstrates that total biomass production, as well as biomass and nitrogen partitioning to each plant organ followed the sequence: 400-N > 133-N > 0-N. However, biomass and nitrogen partitioning to roots and stolons was higher in the treatment with limited nitrogen levels. Proportional changes among aboveground and belowground biomass are adaptive responses to distinct nitrogen conditions, which, in turn, are determining factors in crop production.
References
Alva, A. K., Hodges, T., Collins, H. P., & Oydston, R. A. (2002). Dry matter and nitrogen accumulation and partitioning in two potato cultivars. Journal Plant Nutrition and Soil Science, 25(8), 1621-1630. https://doi.org/10.1081/PLN-120006047
Devaux, A., Kromann, P., & Ortiz, O. (2014). Potatoes for Sustainable Global Food Security. Potato Research, 57, 185-199. https://doi.org/10.1007/s11540-014-9265-1
FAO (2012) FAO statistical databases FAOSTAT. From http://faostat3.fao.org/
Forde, B. G. (2002). The role of long-distance signalling in plant responses to nitrate and other nutrients. Journal of Experimental Botany, 53(366), 39-43. https://doi.org/10.1093/jexbot/53.366.39
Gastal, F., & Lemaire, G. (2002). N uptake and distribution in crops: an agronomical and ecophysiological perspective. Journal of Experimental Botany, 53(370), 789-799. https://doi.org/10.1093/jexbot/53.370.789
Goméz, M. I, Magnitskiy, S., Rodriguez, L. H., & Darghan, A. E. (2017). Accumulation of N, P, and K in the tubers of potato (Solanum tuberosum L. ssp. andigena) under contrasting soils of the Andean region of Colombia. Agronomía colombiana, 35(1), 59-67. https://doi.org/10.15446/agron.colomb.v35n1.61068
Greenwood, D. J., Gastal, F., Lemaire, G., Draycott, A., Millard, P., & Neeteson, J. J. (1991). Growth rate and % N of field grown crops: theory and experiments. Annals of Botany, 67(2), 181-190. https://doi.org/10.1093/oxfordjournals.aob.a088118
Lambers, H., & Oliveira, R. (2019). Plant physiological ecology. Switzerland: Springer Nature AG.
Lemaire, G., Jeuffroy, M. H., & Gastal, F. (2007). Diagnosis tool for plant and crop N status in vegetative stage: Theory and practices for crop N management. European Journal of Agronomy, 28(4), 614–624. https://doi.org/10.1016/j.eja.2008.01.005
Machado, D., & Sarmiento, L. (2012). Respuesta del cultivo de papa a la combinación de diferentes fuentes de fertilización nitrogenada: evaluando la hipótesis de la sincronización. Bioagro, 24(2), 83-92.
Maltas, A., Dupuis, B., & Sinaj, S. (2018). Yield and Quality Response of Two Potato Cultivars to Nitrogen Fertilization. Potato Research, 61, 97–114. https://doi.org/10.1007/s11540-018-9361-8
Nurmanov, Y. T., Chernenok, V. G., & Kuzdanova, R. S. (2019). Potato in response to nitrogen nutrition regime and nitrogen fertilization. Field Crops Research, 231(1), 115–121. https://doi.org/10.1016/j.fcr.2018.11.014
Ohamed, E. M. E., Watthier, M., Zanuncio, J. C., & Santos, R. H. S. (2017). Dry matter accumulation and potato productivity with green manure. Idesia, 35(1), 79-86. http://dx.doi.org/10.4067/S0718-34292017005000016
Passos, S., Kawakami, J., Nazareno, N. R. X., Santos, K.C., & Tamanini Junior, C. (2017). Produtividade de cultivares de batata orgânica em região subtropical do Brasil. Horticultura Brasileira, 35(4), 628-633. https://doi.org/10.1590/s0102-053620170424
Qiqige, S., Jia, L., Qin, Y., Chen, Y., & Fan, M. (2017). Effects of Different Nitrogen Forms on Potato Growth and Development. Journal of Plant Nutrition, 40(11), 1651-1659. https://doi.org/10.1080/01904167.2016.1269345
R Core Team (2018). R: A language and environment for statistical computing. R Foundation for Statistical Computing. Vienna, Austria. From https://www.R-project.org/
Sharifi, M., Zebarth, B. J., Porter, A., Burton, D. L., & Grant C. A. (2009). Soil mineralizable nitrogen and soil nitrogen supply under two-year potato rotations. Plant Soil, 320, 267-279. https://doi.org/10.1007/s11104-009-9892-5
Silva, J. G., França, M. G. C., Gomide, F. T., & Magalhaes, J. R. (2013). Different Nitrogen Sources Affect Biomass Partitioning and Quality of Potato Production in a Hydroponic System. American Journal of Potato Research, 90, 179-185. https://doi.org/10.1007/s12230-012-9297-5
Scheible, W. R., Gonzalez-Fontes, A., Lauerer, M., Müller-Röbert, B., Caboche, M., & Stitt, M. (1997). Accumulation of nitrate in the shoot acts as a signal to regulate shoot-root partitioning in tobacco. The plant Journal, 11(4), 671-691. https://doi.org/10.1046/j.1365-313X.1997.11040671.x
Tiemens-Hulscher, M., Van Buere, E. T. L., & Struik, P. C. (2014). Identifying nitrogen-efficient potato cultivars for organic Farming. Euphytica, 199(1-2), 137-154. https://doi.org/10.1007/s10681-014-1143-z
Van Delden, A. (2001). Yield and growth components of potato and wheat under organic nitrogen management. Agronomy Journal, 93(6), 1370-1385. https://doi.org/10.2134/agronj2001.1370
Villa, P. M., Sarmiento, L., Rada, F. J., Machado, D., & Rodrigues, A. C. (2017). Leaf area index of potato (Solanum tuberosum L) crop under three nitrogen fertilization treatments. Agronomía Colombiana, 35(2), 171-175. http://dx.doi.org/10.15446/agron.colomb.v35n2.62110
Villa, P. M., & Sarmiento, L. (2009). Recomendación alternativa para la fertilización nitrogenada del cultivo de papa en los altos Andes venezolanos. INIA Hoy, 6, 191-199
Author notes
pedro.villa@ufv.br
Additional information
Licencia internacional: Atribución-NoComercial 2.0 Genérica (CC BY-NC 4.0)