INTRODUCTION
Water is a vital resource in industrial, agricultural, and livestock production activities. Their management is a constant environmental challenge to look for tools to efficiently water use resources (Best and León, 2013). In agriculture, water stress adversely affects the production and early plant stress detection is of vital importance in production systems to minimize productivity loss.
Direct monitoring of plant responses and processes under specific environmental conditions can help improve climate control and irrigation (Elvanidi et al., 2018).
Several methods are used to detect water stress in crops as irrigation control strategies in search of sustainable agriculture (Zhuang et al., 2017). Conventional methods, which depend on constant in situ monitoring of soil moisture, leaf state of plants and different meteorological variables (Ihuoma and Madramootoo, 2017). And non-invasive methods looking for similar accuracy levels without the direct measurement, destructive sampling and elevated cost, with plant destruction for its monitoring (Çolak and Yazar, 2017). The latter are the most suitable for crop irrigation automation, since they take into account the heterogeneity of soil and the canopy crop, allowing taking decisions on the water-soil-plant-environment system state and not under a certain characteristic.
Some conventional water status soil and plant indicators are respectively: soil moisture content and stomatal conductance. To assess the moisture soil status or water availability, there are methods based on point measurements that use instruments such as tensometers, reflectometry, neutron probes, gypsum blocks and capacitance sensors. However, for using these specific measures, there is a space between them, which makes it difficult to select a representative area, considering the heterogeneity of soil, or substrate properties, and vegetation (Sayago et al., 2017).
In the same way, the stomatal conductance is a measure directly related to the hydric state that depends on stomata opening into and therefore plant transpiration rate. Stomata favors thermal regulation by fulfilling the process of cooling the canopy when the temperature is high, or there is a strong light intensity (Sánchez-Díaz and Aguirreolea, 2001). The stomatal opening control allows plants to respond quickly to changes in the environment, preventing the excessive loss of water when the availability of it is minimal (Hernández-Cortés, 2013).
The CWSI (Crop Water Stress Index) method is among the unconventional techniques of remote sensing of hydric plants state proposed from the potential use of thermographic images for irrigation programming. The CWSI provides a quantitative measure of plant water status based on canopy temperature differential and ambient temperature as a function of atmosphere Vapor Pressure Deficit (VPD), relative air humidity, and other parameters of reference defined by the user (Idso et al, 1981; Jackson et al,1981). The CWSI quantitatively varies between 0 (no stress) to 1 (maximum stress), allowing an effective measurement for actual need of crop water, and reducing water consumption in irrigation programming, even in deficit irrigation systems (Kullberg et al., 2017).
This canopy temperature analysis method directly related to the stomatal conductance of plant, has been used in different crops such as: Zea mays L (Han et al., 2018), Solanum melongena (Çolak et al.,2015), Brassica oleracea L. var. (Erdem et al., 2010), Vitis vinifera L. (King and Shellie, 2018), Mentha spicata (Vargas-Cruz, 2015) and citrus fruits such as Citrus sinensis L. cv. (Gonzalez-Dugo et al.,2014), where several methodologies have been used to calculate CWSI depending on the available data and the crop conditions.
Klamkowski and Treder (2006) said that for strawberry (Fragaria x ananassa Duch), due to the superficial roots system, the large leaves canopy and fruits high water content fruits, crops need large amounts of water. Strawberry soil moisture deficit directly reduces stomatal conductance and plant transpiration, vegetative growth and yield, even when in mild drought stress level (Grant et al., 2010). Improving efficiency in water use means increasing quality and number of fresh berries per unit of water consumed. Several factors influence this correlation, one is the relationship between the carbon fixed in photosynthesis and water loss through transpiration. The latter can be obtained by using thermographic images to control crop water supply without affecting yield (Grant et al., 2012).
These study objectives were to evaluate the CWSI water stress detection method in “Albion” and “Monterrey” strawberry varieties, taking into account water deficit tolerance.
MATERIALS
AND METHODS
Location and environmental conditions. The research was
developed in a high tunnel covered with Agroclear®
plastic (dimensions: 40 meters long and 7 meters wide), in Marengo Agricultural
Research Center (CAM), of the Universidad Nacional de Colombia, in Mosquera municipality
(coordinates 4 ° 41'08.28 "N and 74 ° 13'06.55" W), at 2546 meters
above sea level and 14 °C of average temperature. The area is classified as Dry
Low Montane Forest (bs-MB) within the Holdridge life zones, based on area rainfall,
temperature and evapotranspiration.
Air temperature and
relative humidity were taken at the macro center tunnel in the canopy plant height. and were recorded at one-hour
intervals by Extech Instruments® dattalogers
reference RT40, during 20 weeks. In addition, wind
speed and PAR (Photosynthetically Active Radiation) were recorded at hourly
intervals during measurement period using a EM50 digital logger/analog data logger,
cup anemometer devices and QSO-S PAR Sensor from Decagon Devices.
Vapor Pressure Deficit
(VPD) was calculated with data obtained from ambient temperature (in Celsius
degrees) and relative humidity (%), replacing them in equation 1 (Montero and Anton, 2002)
VPD=(es- e) (1)
Where:
VPD = Vapor Pressure Deficit (kPa)
es=Saturated air vapor pressure (kPa) =6.108*exp((17.27*Ta)/(Ta+237.3)) and Ta = room temperature (° C).
e=Air vapor pressure (kPa)=es*HR and HR = relative humidity (%)
Plant
material, irrigation schedule, and experimental design. Beds (12) of 30 cm x 38 m were
prepared into the high tunnel. Six beds were adapted with 750 Albion variety
plants and six beds with 750 Monterey variety plants. Plants were grown in a substrates coconut fiber,
rice husk and coal slag mixture (Volume 1:1:2) in order to generate an optimum
balance that would allow plants anchoring, roots proper aeration, good drainage
and water and nutrients retention to be absorbed at the opportune moment by
plant.
A single automated line of
drip irrigation was implemented in each bed. The irrigation water was rainwater
stored in plastic tanks. Fertigation was carried out according to plants
phenological state during 20 weeks of data collection. During crop first month
of development, all plants were irrigated for six days a week with 100% of the
calculated irrigation sheet (optimum), considering the climatic conditions
presented and water crop needs. During the following months, the irrigation sheet
was changed, applying the optimum irrigation sheet to 50% of the plants of each
variety, and the remaining 50% (375 plants of each variety) the irrigation
sheet was reduced by 15%.
Crop irrigation program was based in a water-soil-plant-environment
relationship model. Considering the soil water retention capacity (water-soil
system), the water demand given by potential evapotranspiration
(environment-soil system), the crop coefficient (water-plant system) and the
crop evapotranspiration (plant-environment system). The substrate moisture
retention curve (MRC) was determined (as factor required to obtain optimal irrigation sheet) by a pressure cooker, with
6 pressure points between 0.33 bar (Permanent Wilting Point - PWP) and 15 bar
(Field Capacity - FC).
The cylinder method was used to obtain the bulk
density of the substrate mixture. Crop evapotranspiration (Equation 2) was
obtained from the greenhouse reference evapotranspiration for the Savannah of Bogotá
determined by Esmeral (2011), and crop
coefficient proposed by Allen and others (1998) and adapted in the World
Wildlife Fund study for greenhouse strawberry cultivation (WWF, 2009).
ETc = ETo ∙ Kc (2)
Where:
ETc = crop evapotranspiration (mm / day)
ETo = Referential evapotranspiration (mm / day)
Kc = Crop coefficient
The optimal irrigation sheet (Equation 3) was determined from generated
information and strawberry crop average root depth worked by Rallo & Fernández (1999) and Hancock (2000).
Sw = (FC - PWP) ∙ 100 -1 ∙ Rd ∙ Da (3)
Where:
SW = sheet of water (mm)
FC = Field Capacity (%)
PWP = Permanent Wilting Point (%)
Rd = Roots depth (mm)
Da = apparent substrate density (g m-3)
A 2x2 factorial experimental design was used, considering the strawberry varieties (Albion and Monterrey) as fixed effect factors and irrigation sheets used (100% and 85% of the calculated water requirements) as levels in each factor, with four repetitions in random blocks.
Substrate Moisture content and stomatal conductance.
Volumetric moisture content (Hs) and substrate conductance (t) were
measured with a portable soil moisture sensor (GS3 humidity sensor, Decagon
Devices® temperature, and conductance) three times a week after watering in the
morning and before watering at noon. In the same way, stomatal conductance (Gs)
was measured with a Decacon Devices leaf porometer.
In each treatment, four plants of stomatal conductance daily sampling were
referenced, at 9 a.m. and 12 noon, three times a week for four months. For validation of the method by
correlating the canopy stomatal conductance and soil moisture measured under
optimum water conditions and mild water deficit
Thermographic images and Crop Water Stress Index – CWSI. Thermal images were taken with a Flir System® Model I3 thermal imaging camera with thermal image quality of 60x60 pixels, Visual field: 12.5° x 12.5°, thermal sensitivity of 0.15 °C, precision of ± 2 °C. Plant canopy temperatures images (Tc) was made in four different plants by treatment at 1m distance. The CWSI calculation measurements were made at 9 in the morning and 12 noon.
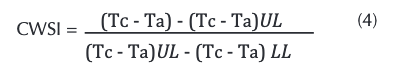
CWSI was calculated based on the empirical equation suggested by (Idso, Jackson, Pinter, & Hatfield (1981), presented in equation 4:
here:
LL = baseline without water stress (lower baseline)
UL = transpiration no upper baseline
Tc = canopy temperature (°C)
Ta = air temperature (°C)
LL was determined from the treatment’s information without water stress, using the canopy and ambient temperatures difference with respect to vapor pressure deficit, while UL was calculated according to the procedures explained by Idso et al. (1981).
Crop Yield. Weekly production data were taken each treatment according to variety and the irrigation sheet percentage, for 4 weeks during the first production peak 16 weeks after sowing.
Statistical analysis. Two-way ANOVA was used to determine differences between treatments and interaction between factors, with irrigation treatments and varieties as orthogonal factors. Significant effects were found in the variance and homogeneity with a confidence level of α = 0.05. Pearson correlation analysis was used to test the relationship between crop water status control methods used. The statistical analyzes were performed using the Statistix 8 software (Analytical Software, USA).
RESULTS AND DISCUSSION
Environmental conditions. According to Ferrucho-González
and Ruíz-González (2013) the high tunnels are optimal infrastructures
for “Albion” and “Monterrey” variety cultivation under Bogotá savannah
conditions, favoring the plants growth, development and yield, compared to open
field climatic conditions. This is consistent with the temperature and relative
humidity conditions presented within the high tunnel during critical periods of
development: flowering and fruiting (Figure 1).
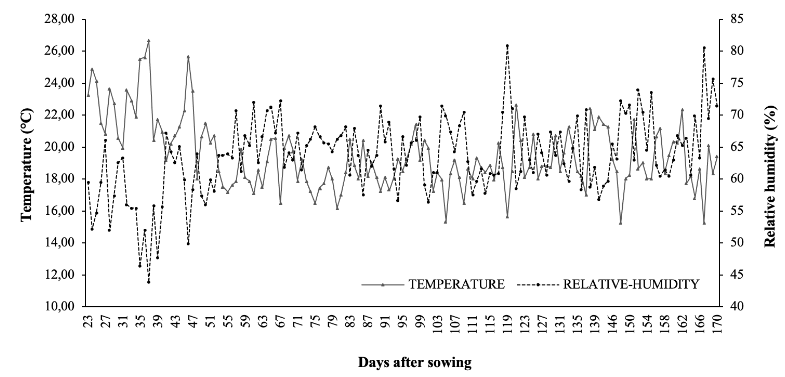 Figure 1.
Average temperature and relative humidity inside the greenhouse
Figure 1.
Average temperature and relative humidity inside the greenhouse
The tunnel temperatures presented during five months
of the study, were adequate to normal productive organs development,
considering that strawberry vegetative growth stops when the temperature is
below 7 °C. with the optimal conditions of 20 °C a 25 °C during the day, for
vegetative growth, and from 10 °C to 15 °C at night, for flowering (FAO, 2002; Verdial et al., 2009) (Table 1).
Table 1.Values obtained for the environmental variables in the study
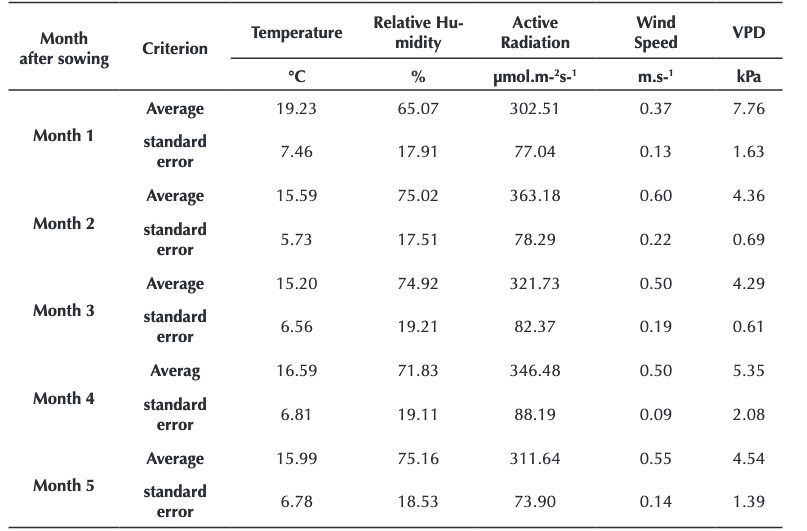 (When: Active
Radiation= photosynthetically
active radiation (PAR) and VPD= Vapor Pressure Deficit)
(When: Active
Radiation= photosynthetically
active radiation (PAR) and VPD= Vapor Pressure Deficit)
Similarly, relative humidity data are presented in
table 1. According to (FAO, 2002),
the strawberry cultivation relative humidity optimum range between 60% and 70%,
for this case, there are humidity higher percentages. This generates greater
possibilities of presenting diseases, which they must be monitored. Still. the
high relative humidity is beneficial for the plant, considering that dry
weather interferes with strawberry correct development (Morgan, 2006)
In general, the average daily air temperature,
relative humidity, photosynthetically active radiation (PAR), wind speed, and
vapor pressure deficit considerably fluctuated during the test, as presented in
Table 1. These environmental conditions can be considered favorable, because strawberry
is a thermo periodic and photoperiodic plant where high temperatures and long
days cause excessive vegetative growth and low temperatures and short days
induce flowering (Barquero et al., 2007).
Vapor Pressure Deficit (VPD) calculated during the evaluated period is shown in Table 1. In this work, the VPD highest records were presented in the first month after sowing. Reason why it was important to maintain the optimal irrigation sheet, since higher VPD inside the tunnel, greater evaporation of the water occurs, decreasing the air humidity with respect to leaf surface, which can generate structure damages in the plant, thus affecting photosynthesis and crop yield (Hoffman, 1979; Allen et al., 1998)
Peñuelas et al. (1992) described importance of environmental variable analysis, such as air temperature and VPD, for monitoring canopy temperature during mild and very slight water deficit treatments. According to these authors, leaf temperature, air temperature and derived indexes, such as CWSI, are useful for strawberries evaluation of mild and very mild water pressures in under protected conditions. The analysis showed that very mild water stress conditions were generated by air vapor pressure deficit on leaf water potential variation.
Substrate moisture content and stomatal conductance. Substrate content moisture patterns at 9:00 AM and 12:00 M (Table 2) show s that substrate moisture difference was evident since the first month despite applying the same irrigation regime. Data show that difference was more evident in the early hours whe re photosynthesis is more active in both varieties due to the increase in the irradiance, temperature and stomatal conductance.
The average values of soil moisture content are shown in Table 2. In this shows the substrate moisture behavior record, which presents a similar trend between T1 and T3 treatments, belonging to Albion variety, maintaining the humidity at upper range at end of cycle that humidity presented by T2 and T4 treatments, of the Monterrey variety, in which the water percentage decreased at the end of the evaluated period. Statistical analysis of variance revealed no significant differences between the treatments in the morning hours, so the decrease made in them irrigation sheet did not affect the availability of substrate water in either of two varieties. At midday the substrate humidity for the treatments had a similar behavior to the presented in the morning, maintaining the substrate moisture content above 70%.
Table 2: Soil moisture content
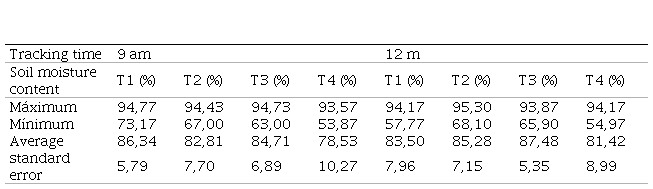 (When: T1= Variety Albion and Percentage of the optimal irrigation sheet 85%, T2= Variety Monterrey and Percentage of the optimal irrigation sheet 85%. T3= Variety Albion and Percentage of the optimal irrigation sheet 100%. T4= Variety Monterrey and Percentage of the optimal irrigation sheet 100 %.)
|
Tracking time
|
9
am
|
12
m
|
|
Soil moisture content
|
T1 (%)
|
T2 (%)
|
T3 (%)
|
T4 (%)
|
T1 (%)
|
T2 (%)
|
T3 (%)
|
T4 (%)
|
|
Máximum
|
94.77
|
94.43
|
94.73
|
93.57
|
94.17
|
95.30
|
93.87
|
94.17
|
|
Mínimum
|
73.17
|
67.00
|
63.00
|
53.87
|
57.77
|
68.10
|
65.90
|
54.97
|
|
Average
|
86.34
|
82.81
|
84.71
|
78.53
|
83.50
|
85.28
|
87.48
|
81.42
|
|
standard error
|
5.79
|
7.70
|
6.89
|
10.27
|
7.96
|
7.15
|
5.35
|
8.99
|
Statistical analysis showed no significant differences between treatments, and water deficit did not cause crop damage. Water stress due to water loss is one of the main causes of plant death and occurs when transpiration exceeds the root water absorption rate. One of the main mechanisms of plant resistance at physiological level is partial or total stomatal closure, which can generate effects on growth such as decreased leaf expansion and increased root growth (Shao et al., 2008).
A similar performance was observed in the stomatal conductance among treatments in the Table 3. The conductance increases days after the transplant, which agrees with the decrease of substrate moisture percentage.
Table 3. Stomatal conductance for the proposed treatments
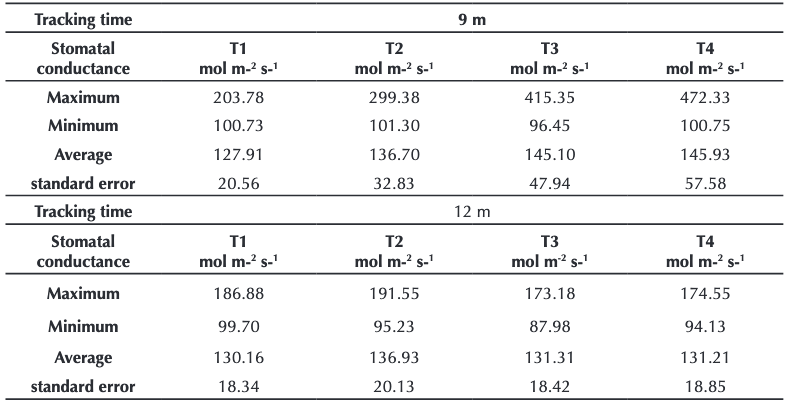 (When: T1= Variety Albion and Percentage of the optimal
irrigation sheet 85%, T2= Variety Monterrey and Percentage
of the optimal irrigation sheet 85%. T3=
Variety Albion and Percentage of the optimal irrigation sheet 100%. T4= Variety Monterrey and Percentage of the optimal
irrigation sheet 100 %.)
(When: T1= Variety Albion and Percentage of the optimal
irrigation sheet 85%, T2= Variety Monterrey and Percentage
of the optimal irrigation sheet 85%. T3=
Variety Albion and Percentage of the optimal irrigation sheet 100%. T4= Variety Monterrey and Percentage of the optimal
irrigation sheet 100 %.)
The analysis of variance found no significant differences among treatments based on performed on stomatal conductance, sought to remain stable among 100 mol m-2 s-1 y 150 mol m-2 s-1, which agrees with results obtained for substrate moisture for both varieties and irrigation sheets. The soil moisture percentage was adequate to allow plants normal stomatal opening performance in the transpiration process (Taiz and Zeiger, 2006), regulating the gas exchange necessary for photosynthesis.
For varieties and irrigation sheet there was no stomatal closure due to high temperatures or increase of the vapor pressure deficit. Since adequate management of the crop was carried out, avoiding a water potential decrease that inhibits photosynthesis by sugar accumulation (Sánchez-Díaz and Aguirreolea, 2001) or that favors the excessive water loss and plant death (Buchanam, Gruissem and Jones, 2000).
Crop water stress index – CWSI. Figure
2A shows the crop water stress index behavior (9 AM), showing variations of 0.2
and 0.7. All evaluated plants had peaks without stress (CWSI = 0) and maximum
stress (CWSI = 1). These values agree with those presented by Sezen et al. (2014) in drip irrigation treatments, who
found CWSI values varied between 0.15 and 0.82 in 2010 between 0.16 and 0.83
inn 2011. Growing season Average threshold of the CWSI values was 0.26 in the
complete irrigation drip treatment.
CSWI analysis of variance, like the moisture content of the substrate and the stomatal conductance, showed no differences between the irrigation sheets or varieties evaluated. The three methods determined that plants were not physiologically affected at any time of development. This agree with Grantand others (2012), who found that leaf arrangement of strawberry cultivars lead to a variation in the efficiency of water use.
In the Pearson correlation analysis performed between the calculated CWSI, soil moisture, and stomatal conductance, it was found that there is a high positive correlation between them.
CWSI is associated with
the other factors, thus validating the use of thermographic images for the calculation
of the CWSI and monitoring of strawberry plant water status at optimum
irrigation and mild water stress (Peñuelas et al.,1992) under protected environment conditions and
with two type of fertigation, when the soil matrix potential reached -0.07 MPa
and -0.01 MPa, respectively.
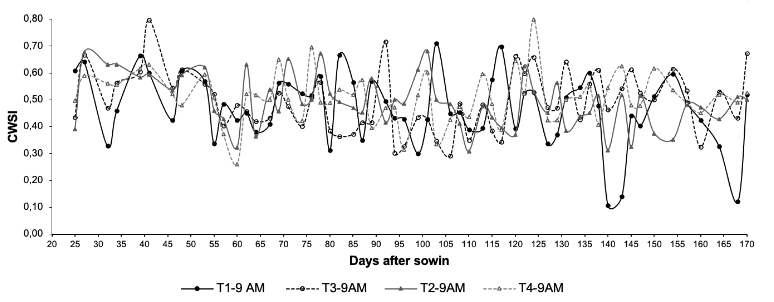 Figure 2A. Crop water stress index – CWSI at 9 AM
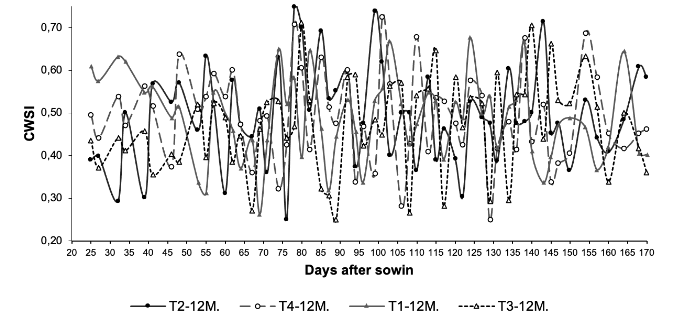 Figura 2B. Crop water stress index – CWSI
at 12M
Figura 2B. Crop water stress index – CWSI
at 12M
Crop
Yield. In the production yield, Figure 3 shows that
treatments: T2 and T4 on to Monterrey plants showed higher production values.
The statistical analysis showed no differences in the irrigation sheet
variation for Albion and Monterrey varieties, which means the production
between varieties is not altered by 15% irrigation sheet reduction. These
results contrast with Sezen et al. (2014), who
obtained differences when varying the irrigation sheet, concluding that water
stress significantly reduced the yield of first quality red pepper.
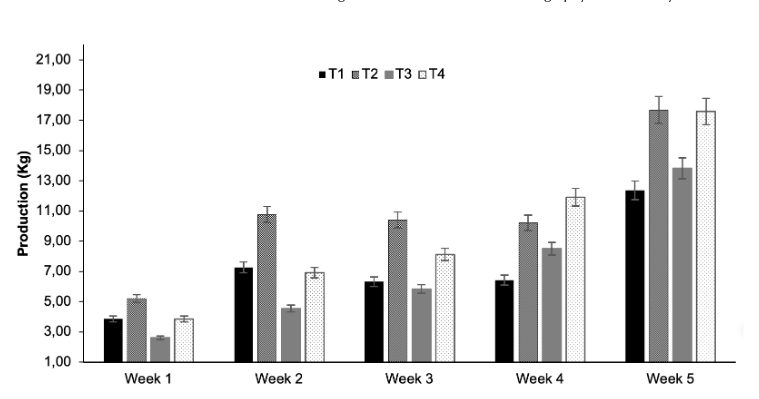 Figure 3. Evaluated
treatments production yield
Figure 3. Evaluated
treatments production yield
CONCLUSIONS
-
Climatic conditions or Environmental variables monitoring into the high tunnel allowed to identify the crop water needs within the first month of sowing, allowing to maintain the irrigation sheet calculated during the first month, and perform a pulse prior to the peak of stress by temperature at noon to avoid leaf damage and allowing normal plant development.
CWSI calculation from thermographic images use is valid as other conventional methods to early detection of water stress in strawberry plants.
At the Savannah of Bogotá, under covered crop systems, mild water stress does not affect Albion and Monterrey strawberry plants varieties yield. as long as a water-soil-plant-environment adequate control system is maintained allowing to reduce water consumption by 15%.
REFERENCES
Allen, R., Pereira, L., Raes, D., and Smith, M. 1998. Crop evapotranspiration. Guidelines for computing crop water requirements. FAO Irrigation and Drain, paper 56.
Barquero, J., Meneses, R., Barrantes, L., Ugalde, P., Villalobos, N., and Serrano, D. 2007. Agrocadena de Fresa. Ministerio de agricultura y ganadería. Grecia, Alajuela. p 1-37 pags.
Best, S. and León, L. 2013. Monitoreo de variables hídricas mediante termografía infrarroja. Viticultura de Precisión, Terroir Digital. Boletín Digital INIA Nº 269, 139p. Progap-INIA, Instituto de Investigaciones Agropecuarias, Chillán, Chile. p. 24-50.
Buchanam, B., Gruissem, W., and Jones, R. 2000. Biochemistry and Molecular Biology of Plants. Marylan, USA: ASPP. Rockville.
Çolak, Y. B., and Yazar, A. 2017. Evaluation of crop water stress index on Royal table grape variety under partial root drying and conventional deficit irrigation regimes in the Mediterranean Region. Scientia Horticulturae (224), p.384-394. 10.1016/j.scienta.2017.06.032.
Çolak, Y. B., Yazar, A., Çolak, İ., Akça, H., and Duraktekin, G. 2015. Evaluation of Crop Water Stress Index (CWSI) for Eggplant under Varying Irrigation Regimes Using Surface and Subsurface Drip Systems. Agriculture and Agricultural Science Procedia (4), p.372-382. 10.1016/j.aaspro.2015.03.042.
Elvanidi, A., Katsoulas, N., Ferentinos, K., Bartzanas, T., and Kittas, C. 2018. Hyperspectral machine vision as a tool for water stress severity assessment in soilless tomato crop. Biosystems Engineering (165), p.25-35. 10.1016/j.biosystemseng.2017.11.002.
Erdem, Y., Arin, L., Erdem, T., Polat, S., Deveci, M., Okursoy, H., and Gültaş, H. 2010. Crop water stress index for assessing irrigation scheduling of drip irrigated broccoli (Brassica oleracea L. var. italica). Agricultural Water Management (98), p.148-156. 10.1016/j.agwat.2010.08.013.
Esmeral, Y. R. 2011. Análisis de la evapotranspiración real en el cultivo de la Rosa. Trabajo de grado presentado para optar al título de Magister en Ingeniería Agrícola, Universidad Nacional de Colombia., Bogotá-Colombia.
FAO, O. D. 2002. El Cultivo Protegido en Clima Mediterráneo. (D. d. Vegetal, Ed.) Roma: FAO, Dirección de Producción y Protección Vegetal 90.
Ferrucho González, A. M., & Ruíz González, D. 2013. Evaluación y comparación del comportamiento agronómico de dos cultivares de fresa (Albión y Monterrey) sembrados a libre exposición y bajo macro túneles en la Sabana de Bogotá (Colombia). Trabajo de grado presentado para optar al título de Biólogo, Universidad Militar Nueva Granada, Facultad de ciencias Básicas y aplicadas, Cajicá, Cundinamarca.
Gonzalez-Dugo, V., Zarco-Tejada, P., & Fereres, E. 2014. Applicability and limitations of using the crop water stress index as an indicator of water deficits in citrus orchards. Agricultural and Forest Meteorology, p.94-104. 10.1016/j.agrformet.2014.08.003.
Grant, O. M., Davies, M. J., James, C. M., Johnson, A. W., Leinonen, I., & Simpson, D. W. 2012. Thermal imaging and carbon isotope composition indicate variation amongst strawberry (Fragaria×ananassa) cultivars in stomatal conductance and water use efficiency. Environmental and Experimental Botany, 76, p.7-15. 10.1016/j.envexpbot.2011.09.013.
Grant, O. M., Johnson, A. W., Davies, M. J., James, C. M., & Simpson, D. W. 2010. Physiological and morphological diversity of cultivated strawberry (Fragaria×ananassa) in response to water deficit. Environmental and Experimental Botany, 68, p.264-272. 10.1016/j.envexpbot.2010.01.008
Han, M., Zhang, H., DeJonge, K. C., Comas, L. H., & Gleason, S. 2018. Comparison of three crop water stress index models with sap flow measurements in maize. Agricultural Water Management, 203, p.366-375. 10.1016/j.agwat.2018.02.030.
Hancock, J. F. 1999. Strawberries. Crop Production Science in Horticulture Series. CABI Publishing, Wallingford, p.90- 109.
Hernández Cortés, J. A. (2013). Regulación Del Cierre Estomático: Una Función Representada por Varios Actores.: Grupo de Biotecnología de Frutales, CEBAS. Consejo superior de investigaciones científicas. Campus Universitario de Espinardo. Espinardo. Murcia. España
Hoffman, G. 1979. Controlled Environment Guidelines for Plant Research. (A. Press, Ed.) Humidity, p.141-172.
Idso, S., Jackson, R., Pinter, P., & Hatfield, J. 1981. Normalizing the stress – degree – day parameter for environmental variability. Agric. Meteorol., p.45-55.
Ihuoma, S. O., & Madramootoo, C. A. 2017. Recent advances in crop water stress detectio. Computers and Electronics in Agriculture, 141, p.267-275. 10.1016/j.compag.2017.07.026.
Jackson, R., Idso, S., Reginato, R., & Pinter, P. 1981. Canopy temperature as a crop water stress indicator. Water Resour., p.1133-1138.
King, B., & Shellie, K. (2018). Wine grape cultivar influence on the performance of models that predict the lower threshold canopy temperature of a water stress index. Computers and Electronics in Agricultural, 145, p.122-129. 10.1016/j.compag.2017.12.025.
Klamkowski, K., & Treder, W. (2006). Morphological and physiological responses of strawberry plants to water stress. Agriculturae Conspectus Scientificus, 71, p.159-165.
Kullberg, E. G., DeJonge, K. C., & Chávez, J. L. (2017). Evaluation of thermal remote sensing indices to estimate crop evapotranspiration coefficients. Agricultural Water Management (179), p.64-73. 10.1016/j.agwat.2016.07.007.
Montero, J., & Anton, A. 2002. Comparative Perfomance of a High- and Low-Pressure Fog Systems Driven by Vapor Pressure Deficit Control. Acta Horticulturae (Submited), 79.
Morgan, L. (2006). Hydroponic strawberry production. A technical guide to hydroponic production of strawberries. Tokomaru, NZ.: Suntec (NZ) Ltd .
Peñuelas, J., Savé, R., Marfà, O., & Serrano, L. 1992. Remotely measured canopy temperature of greenhouse strawberries as indicator of water status and yield under mild and very mild water stress conditions. Agricultural and Forest Meteorology, 58, p.63-77.
Rallo., L., & Fernández., R. 1999. Diccionario de ciencias hortícolas (pág. 202). Sociedad española de ciencias hortícolas. Ediciones Mundi-prensa. Madrid. España.
Sánchez-Díaz, M., & Aguirreolea, J. 2001. Movimientos estomáticos y transpiración. En J. Azcón, & M. Talón, Fundamentos de Fisiología Vegetal Capítulo 3. p. 31-43. Universidad de Navarra. Navarra. España
Sayago, S., Ovando, G., & Bocco, M. 2017. Landsat images and crop model for evaluating water stress of rainfed soybean. Remote Sensing of Environment, 198, p.30-39. 10.1016/j.rse.2017.05.008.
Sezen, S. M., Yazar, A., Daşgan, Y., Yucel, S., Akyıldız, A., Tekin, S., & Akhoundnejad, Y. 2014. Evaluation of crop water stress index (CWSI) for red pepper with drip and furrow irrigation under varying irrigation regimes. Agricultural Water Management, 143, p.59-70. 10.1016/j.agwat.2014.06.008.
Shao, H., Chu, Jaleel, C., & Zhao., C. 2008. Water-deficit stress-induced anatomical changes in higher plants. C.R. Biol. 331, p. 215-225. 10.1016/j.crvi.2008.01.002
Taiz, L. and Zeiger, E. (2006). Plant physiology. 4th Edition, Sinauer Associates, Inc., Sunderland.
Vargas-Cruz, J. 2015. Implementación de imágenes termográficas para la detección de estrés hídrico en hierbabuena (Mentha spicata) bajo invernadero en la Sabana de Bogotá. Trabajo de grado presentado para optar al título de Magister en Ingeniería Agrícola Universidad Nacional de Colombia. Bogotá, Colombia.
Verdial, M., Neto, J., Minami, K., Filho, J., Christoffoleti, P., Scarpare, F., & Kluge, R. 2009. Fisiologia de mudas de morangueiro produzidas em sistema convencional e em vasos suspensos. Revista Brasileira de Fruticultura,31(2), p.524-531.
WWF. 2009. Manual de buenas prácticas de riego. Propuestas de WWF para un uso eficiente del agua en la agricultura. Viñedo, Olivar, Cítricos y Fresa. Madrid. España.
Zhuang, S., Wang, P., Jiang, B., Li, M., & Gong, Z. 2017. Early detection of water stress in maize based on digital images. Computers and Electronics in Agriculture, 140, p.461-468.