

Influence of meteorological variables on the transmission of COVID-19 in Guayas and Pichincha
Influencia de variables meteorológicas en la transmisión de COVID-19 en Guayas y Pichincha
Ecuadorian Science Journal, vol. 6, núm. 2, p. 16, 2022
GDEON
Artículo de Investigación
Recepción: 25 Junio 2022
Aprobación: 02 Septiembre 2022

Cómo citar:: Del Cioppo Morstadt, J., & Aguirre-Munizaga, M. (2022). Influence of meteorological variables on the transmission of COVID-19 in Guayas and Pichincha. Ecuadorian Science Journal, 6(2), 17-25. https://doi.org/10.46480/esj.6.2.185
Abstract: At the beginning of April 2020, Ecuador suffered a sudden attack from the virus SARS-CoV-2, becoming the focus of the disease in the country and reaching one of the highest mortality rates in South America. Regarding the COVID-19 condition, daily data from official national sources consolidated the total number of probable and confirmed deaths. They confirmed cases of COVID-19, data collected from March 26, 2020, to July 7, 2021. The data shows the main parameters; the number of people infected with COVID-19, total deaths, temperature, relative humidity, and cloudiness. Once these parameters were obtained, they allowed the understanding of how environmental characteristics can affect or influence the spread of the virus and mortality, specifically in Guayas and Pichincha caused by COVID-19.
Keywords: COVID-19 disease, Guayas, meteorological variables, Pichincha, predictions.
Resumen: Ecuador, a principios de abril de 2020, sufrió el ataque repentino del virus SARS-CoV-2, convirtiéndose en el foco de la enfermedad en el país y alcanzando una de las tasas de mortalidad más altas de Sudamérica. En cuanto a la enfermedad COVID-19, se consolidaron datos diarios de fuentes oficiales nacionales sobre el total de defunciones, defunciones probables y confirmadas, así como casos confirmados de COVID-19, datos recabados en el período del 26 de marzo de 2020 al 7 de julio de 2021.Aquí mostramos que los principales parámetros son el número de personas contagiadas con COVID-19, muertes totales, temperatura, humedad relativa y nubosidad, una vez analizados estos parámetros se permitió entender cómo pueden afectar o influir en la propagación del virus. y mortalidad en Guayas y Pichincha por COVID-19.
Palabras clave: COVID-19 enfermedad, Guayas, variables meteorológicas, Pichincha, predicciones.
Introduction
On December 31, 2019, China informed the World Health Organization WHO of cases of pneumonia with unknown aetiology (unknown cause) detected in the city of Wuhan, Hubei province of China. From December 31, 2019, to January 3, 2020, 44 pneumonia patients with unknown aetiology were reported to WHO by China's national authorities (World Health Organization, 2020). During this reported period, there was no causative agent identified.
On January 11 and 12, 2020, the WHO received more detailed information from the Chinese National Health Commission that the outbreak was associated with exposure in a seafood market in Wuhan. Chinese authorities identified a new type of coronavirus isolated on January 7, 2020. On January 12, 2020, China shared the new coronavirus's genetic sequence for countries that could use this information in developing specific diagnostic kits.
On January 13, 2020, the first case outside China was reported in Thailand. Then, on January 28 and 31, the first case appeared in Germany and Spain, respectively, countries in which the seasonal pattern is repetitive low to medium temperatures, relative humidity mean is between 65% to 80%. Low UV indices range from 2 to 7, which are favourable conditions for the infection of COVID-19. Thenceforth, SARS-CoV-2 has been dispersed throughout all regions worldwide due to the continuous travelling conditions of the population.
On February 29, the first case of COVID - 19 was announced in Ecuador. It was a 70-year-old woman infected by this virus in Spain and did not present any symptoms at the time of entry to Guayaquil (February 14). That week, the first epidemiological siege was carried out on 80 people who did not develop any present symptoms (Guan et al., 2020). However, there still was a high circulation of international arrivals until March 16, 2020 (when the entry to the country was closed for commercial flights); through Guayaquil's Airport, approximately 227 596 passengers arrived, including a large percentage of returning people from countries where there were already outbreaks of SARS-CoV-2. This caused a severe virus outbreak in March and April that left hospitals saturated and authorities struggling to collect the bodies of alleged victims of COVID-19 (BBC News Services, 2020). According to clinical studies for the cases of the deceased people in Guayas, the mean age was 54.5 years, 77.1% were over 50 years old compared to 53.73% of the survivors, 62.5% were men(Bravo-Acosta, Vélez-Solorzano, & Martínez- Méndez, 2020).
As the number of confirmed cases of the new coronavirus (COVID-19) continues to rise worldwide, governments, businesses, and healthcare providers are implementing several measures to control the virus outbreak. The relationship of certain meteorological variables with the number of infections and the mortality rate dramatically contributes to analysing the disease's behaviour concerning the environment (Sobral, Duarte, da Penha Sobral, Marinho, & de Souza Melo, 2020).
Currently, the most widely accepted hypotheses that explain influenza's seasonality, such as Environmental Humidity (E.H.), focus only on temperate regions. Less attention has been paid to the seasonality of influenza in the tropics, probably due to the lack of information about historical seasonal patterns. In this context, this research has taken variables such as maximum temperatures, relative humidity, and U.V. cloudiness to study the impact of these variables on the infections of SARS-CoV-2; validate. Drier air paves the way for airborne viruses' incidence in the impact of the SARS-CoV-2. Warm, dry air also reduces the ability of the cilia, the cells that line our airways to remove virus particles and prevent them from reaching the lungs. Furthermore, the research referenced in Biryukov et al (2020) indicates that the immune system's ability to respond to pathogens is decreased in drier environments.
Methods and Materials
Study area and population
The location of Ecuador, on the equatorial line, produces little seasonality throughout the year. There are only two defined seasons: rainy or humid and dry or less rainy. The length of the seasons varies regionally. In the coastal region, the rainy season begins in December and lasts until May; the dry season occurs between June and November.
Ecuador's climate is highly influenced by topography. Its altitudinal range (0 to 6300 m) generates a wide temperature gradient, from approximately 0 to 26 degrees Celsius annual average temperature. However, the Amazon has higher temperatures than expected due to its elevation, while the opposite happens on the Coast's dry side.
The geographical location of Ecuador causes the length of the days to be similar throughout the year, with 12 hours of light each day. The amount of solar radiation received in the country is also constant, which reduces the average annual temperature variation in the area, with a maximum variation of 3ºC between months, mainly in the arid areas of the country's southwest. Opposite to what happens with the daily fluctuation of temperature, where low areas of the Coast and East can register changes of 10ºC and middle to high areas of the Andes Mountains changes of up to 20ºC for one day.
Several governmental and non-governmental institutions in Ecuador have meteorological stations in different parts of the country. These teams are dedicated to monitoring environmental parameters to obtain information in real-time for meteorological surveillance and early warning monitoring systems. For this purpose, information has been taken from the Agrarian University of Ecuador to compile daily information about the meteorological variables that affect this study (Universidad Agraria del Ecuador, 2019). Available dataset as values averaged daily of global cloudiness as measured from space by NASA's Terra and Aqua satellites using the Moderate Resolution Imaging Spectroradiometer (Omer, Iftime, & Burcea, 2021).
Concerning the number of cases and mortality in Guayas and Pichincha, data has been provided by the Ministry of Public Health of Ecuador (Ministry of Public Health, 2021).
To make this research possible, the use of capable tools and technologies to extract and collect information about COVID-19 data and climate variations in specific locations was important. Python programming language was beneficial in addition to the data modelling tools such as the Pandas, NumPy, Scikit-learn, and Seaborn libraries.
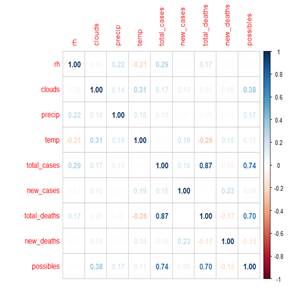
Correlation between weather variables
To generate this correlation, a scientific analysis is required that answers the question of whether, in the months of higher rainfall, higher relative humidity and lower temperature, there is an increase in cases and deaths related to the disease (Sobral et al., 2020).
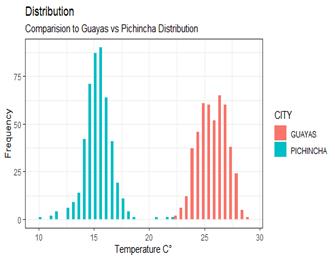
Using a data science approach, the researchers first tested the behaviour of the variables in a dataset of 936 records, where the relevance of the temperature is compared for both provinces.
Figure 1 shows that in Guayas, temperatures are between 22 and 30 degrees Celsius, unlike Pichincha, which has temperatures below 20 degrees Celsius. Pichincha has a higher frequency of temperatures between 15 and 16 degrees Celsius.
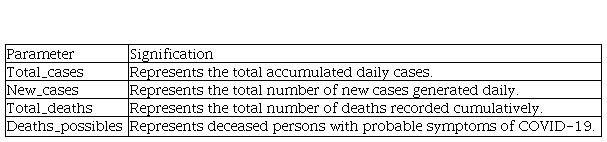
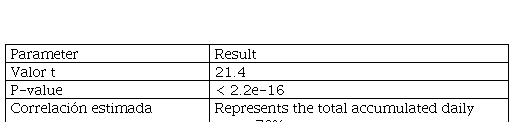
For this study, various types of research have been used, having in the first instance the documentary research through which it has been possible to describe and explain the knowledge previously established in the reliable sources of information for the consolidation of the project. The research design is observational and longitudinal based on the variables described in Table 1.
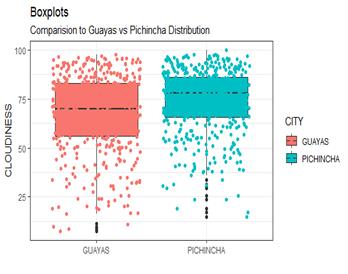
In addition, Table 2 shows the results of the descriptive statistics of cloudiness in both provinces.
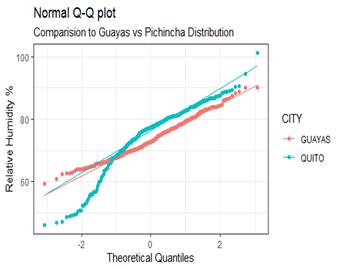
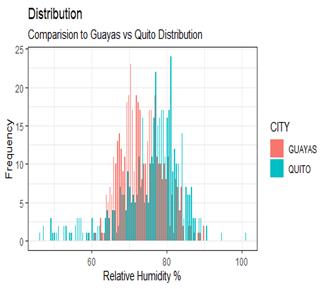
In contrast to temperature, Figure 6 and Figure 7 show that the relative humidity ranges remain between 65% and 85%, with the province of Guayas standing out in this case with lower humidity frequencies than Pichincha.
With the experiments proposed and the data obtained to date, it is concluded that COVID-19 does not show seasonality. The hypothesis of a significant relationship between the increase in cases and deaths related to meteorological data is discarded; however, with the information gathered, it is possible to review the influenza seasons in Guayas and Pichincha in the future.
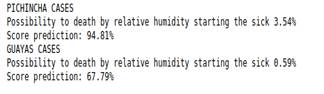
In figure 8, the deaths were chosen for 14 days since the disease was diagnosed. For example: if the death were on 09/16/2020, we would evaluate the conditions on 09/02/2020, the temperature, and the number of people infected that day. In Guayaquil, the score coincided with a value of 0.59%. At the same time, in Pichincha, the incidence is 3.54%, which is why we conclude that Pichincha, apart from chronic diseases and age, has a higher incidence on the part of humidity.
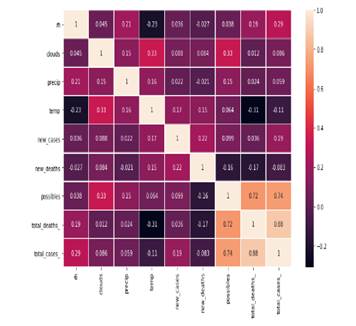
It used powerful tools to model data, applying the deaths and the weather factors such as relative humidity, number of clouds on that day, temperature, and total deaths. It allows us to notice the correlation in the result, but remember that this experiment uses the total cases as a prediction feature(Prata, Rodrigues, & Bermejo, 2020).
Results and Discussion
This analysis has several significant limitations. Data collected include case reports counted according to the day when symptoms appeared, with associated uncertainty in the intervals of exposure and onset of symptoms. We have used conservative limits of possible exposure and appearance of symptoms for the case of deaths since exact times are not known.
Therefore, from this result, we can conclude that maximum temperature and minimum humidity are essential to predict the tendency to increase deaths in the City of Guayas. In addition, it is indicated that the lower the minimum humidity value, the lower the number of deaths above the average, discarding employing the relevance attributes evaluator method Greedy Stepwise (forwards), which influences the increase in cases.
Our findings do not support the hypothesis that higher temperatures will reduce the transmission of COVID-19. In this case, the research shows that the combination of high temperatures and a decrease in the minimum temperature affects the decrease in deaths. This strengthens the findings of previous research (Prussin et al., 2018), such as the one carried out in Jakarta-Indonesia, where the weather was shown to be an essential factor in determining COVID-19 rate incidence in Jakarta (Tosepu et al., 2020). Still, despite hot weather, people are cautioned not to lose vigilance and to continue to practice safety measures such as hand washing, social distancing, and wearing face masks.
The ability to accurately forecast the probability of expansion of a pandemic is a highly significant but difficult task (Fong et al., 2020). It is emphasized that to date, there is limited knowledge of the new disease SARS-COVID19, which is an essential aspect of the country's socioeconomic factors. In the city of Guayaquil 16.2% of the population maintains their economic income with the informal trade, or also called "underemployment". According to the National Institute of Statistics, the high uncertainty involved with the inability to obtain subsistence goods influenced the spread of the new virus, so any forecast is anything but reliable.
Another factor is the insufficient amount of data available. Data samples are often sparse when a pandemic has just started. With only a few samples available, finding a model that offers best-effort forecasts is a massive challenge in machine learning (Callahan & Shah, 2017).
The different analytical techniques that generated the highest correlation values often form the basis of the spatial models, so that in the future with a greater amount of information generated, a model that helps to assess the trend of cases according to the stratified sectors in the Municipality of Guayaquil could be evaluated for the control of the disease. This study coincides with the research "The Modest Impact of Weather and Air Pollution on COVID-19 Transmission" (Z. Xu, Chen, Mu, Dai, & Ma, 2022), which uses a statistical method and comprehensive data on the global spread of the COVID-19 pandemic until the end of April 2020. These researchers construct and validate their proposed method to estimate the number of infected cases in various places. They have suggested that the result of their study may be an input to controlling the spread of the virus by considering various characteristics such as delay in detection, population density, and time-varying responses. It also uses some weather variable to predict the spread of the virus and then provide global projections throughout the year (Emanuel et al., 2020).
Conclusions
This research proposes comparing the behaviour of several meteorological variables in Guayas and Pichincha for the execution of a supervised learning algorithm to generate a prediction of positive COVID-19 cases. The proposed model is tested with data from positive cases monitored in Ecuador, and the model obtained an efficiency percentage of 95% for the case of Pichincha and 68% for the case of Guayas.To validate the present research, we utilize the daily data sets. The experimental results show that the climatic variables are more relevant in predicting the number of total deaths when we test the model with variables cloudiness.
With the experiments proposed and the data obtained to date, it is concluded that COVID-19 does not show seasonality, so the hypothesis of a significant relationship between the increase in cases and deaths related to meteorological data is discarded; however, with the information gathered, it is possible to review the influenza seasons in Guayas and Pichincha in the future (R. Xu et al., 2020).
It has been detected that many countries globally need more information about the behaviour of the disease and the contagions of SARS-CoV-2. According to the World Meteorological Organization, the disease initially manifested itself in the northern hemisphere in early to mid-winter, in places with temperate climates, and spread east and west in an initially narrow climatic band. This could reflect climate sensitivity, but it could also plausibly reflect business and human movement patterns.
References
Biryukov, J., Boydston, J. A., Dunning, R. A., Yeager, J. J., Wood, S., Reese, A. L., … Altamura, L. A. (2020). Increasing Temperature and Relative Humidity Accelerates Inactivation of SARS-CoV-2 on Surfaces. MSphere, 5(4). https://doi.org/10.1128/mSphere.00441-20
Bravo-Acosta, M., Vélez-Solorzano, P., & Martínez- Méndez, D. (2020). Clinical characteristics of Covid-19 cases in Guayaquil, Ecuador. Journal of Human Virology & Retrovirology, 8(2). https://doi.org/10.15406/jhvrv.2020.08.00221
Callahan, A., & Shah, N. H. (2017). Machine Learning in Healthcare. In Key Advances in Clinical Informatics (pp. 279–291). Elsevier. https://doi.org/10.1016/B978-0-12-809523-2.00019-4
Del Rio, C., & Camacho-Ortiz, A. (2020). Will environmental changes in temperature affect the course of COVID-19? Brazilian Journal of Infectious Diseases, 24(3), 261–263. https://doi.org/10.1016/j.bjid.2020.04.007
Emanuel, E. J., Persad, G., Upshur, R., Thome, B., Parker, M., Glickman, A., … Phillips, J. P. (2020). Fair Allocation of Scarce Medical Resources in the Time of Covid-19. New England Journal of Medicine, 382(21), 2049–2055. https://doi.org/10.1056/NEJMsb2005114
Guan, W., Ni, Z., Hu, Y., Liang, W., Ou, C., He, J., … Zhong, N. (2020). Clinical Characteristics of Coronavirus Disease 2019 in China. New England Journal of Medicine, 382(18), 1708–1720. https://doi.org/10.1056/NEJMoa2002032
Mecenas, P., Bastos, R., Vallinoto, A., & Normando, D. (2020). Effects of temperature and humidity on the spread of COVID-19: A systematic review. MedRxiv. https://doi.org/10.1101/2020.04.14.20064923
Ministry of Public Health. (2021). Update on coronavirus cases in Ecuador. Retrieved August 24, 2021, from https://www.salud.gob.ec/actualizacion-de-casos-de-coronavirus-en-ecuador/
Omer, S., Iftime, A., & Burcea, V. (2021). COVID-19 mortality: positive correlation with cloudiness and sunlight but no correlation with latitude in Europe. MedRxiv, 2021.01.27.21250658. https://doi.org/10.1101/2021.01.27.21250658
Prata, D. N., Rodrigues, W., & Bermejo, P. H. (2020). Temperature significantly changes COVID-19 transmission in (sub)tropical cities of Brazil. Science of the Total Environment. https://doi.org/10.1016/j.scitotenv.2020.138862
Prussin, A. J., Schwake, D. O., Lin, K., Gallagher, D. L., Buttling, L., & Marr, L. C. (2018). Survival of the enveloped virus Phi6 in droplets as a function of relative humidity, absolute humidity, and temperature. Applied and Environmental Microbiology, 84(12), 1–10. https://doi.org/10.1128/AEM.00551-18
Sobral, M. F. F., Duarte, G. B., da Penha Sobral, A. I. G., Marinho, M. L. M., & de Souza Melo, A. (2020). Association between climate variables and global transmission oF SARS-CoV-2. Science of The Total Environment, 729, 138997. https://doi.org/10.1016/j.scitotenv.2020.138997
Tosepu, R., Gunawan, J., Effendy, D. S., Ahmad, L. O. A. I., Lestari, H., Bahar, H., & Asfian, P. (2020). Correlation between weather and Covid-19 pandemic in Jakarta, Indonesia. Science of The Total Environment, 725, 138436. https://doi.org/10.1016/j.scitotenv.2020.138436
Universidad Agraria del Ecuador. (2019). Platform for monitoring atmospheric data in real time of the network of weather stations of the “Universidad Agraria Del Ecuador”, Guayaquil and Milagro. Retrieved November 5, 2020, from http://meteorologiauae.uagraria.edu.ec/contacto.html
World Health Organization. (2020). WHO | Novel Coronavirus – China. WHO. Retrieved from http://www.who.int/csr/don/12-january-2020-novel-coronavirus-china/en/
Xu, R., Rahmandad, H., Gupta, M., DiGennaro, C., Ghaffarzadegan, N., Amini, H., & Jalali, M. (2020). Weather Conditions and COVID-19 Transmission: Estimates and Projections. SSRN Electronic Journal. https://doi.org/10.2139/ssrn.3593879
Xu, Z., Chen, J., Mu, M., Dai, G., & Ma, Y. (2022). A Nonlinear Representation of Model Uncertainty in a Convective-Scale Ensemble Prediction System. Advances in Atmospheric Sciences, 39(9), 1432–1450. https://doi.org/10.1007/s00376-022-1341-x
Información adicional
Cómo citar:: Del Cioppo Morstadt, J., & Aguirre-Munizaga, M. (2022). Influence of
meteorological variables on the transmission of COVID-19 in Guayas and
Pichincha. Ecuadorian Science Journal, 6(2), 17-25. https://doi.org/10.46480/esj.6.2.185


