

When Light Meets Sound: Signal Analysis of Black Holes
Latin-American Journal of Computing
Escuela Politécnica Nacional, Ecuador
ISSN: 1390-9266
ISSN-e: 1390-9134
Periodicity: Semestral
vol. 12, no. 2, 2025
Received: 25 March 2025
Accepted: 07 May 2025
Abstract:
— When light meets sound, a new dimension of analysis unfolds. This work explores black hole observations through the lens of signal theory and acoustic wave mechanics, revealing a resonant bridge between electromagnetic and mechanical waves. Using Event Horizon Telescope EHT data, black hole imagery is treated as a three-dimensional digital signal, where the analytic Hilbert envelope and normalized Discrete Fourier Transform DFT expose hidden structures. The gravitational shadow is interpreted not as silence, but as a measurable energy dip—an imprint of absorption rather than absence. Euler’s identity is employed to map signal phase and symmetry into polar and complex domains, providing an intuitive mathematical pathway toward the event horizon. By applying foundational acoustic concepts such as resonance, interference, and entropy, the field surrounding the black hole is reinterpreted as a complex communication signal. This interdisciplinary framework unifies digital signal processing, electromagnetic theory, and acoustics into a novel methodology for astronomical analysis. Notably, when a full noise assessment is conducted, EHT images exhibit a significant enhancement in resolution and information transmission.
Keywords: black hole imaging, digital signal processing, Hilbert analytic envelope, frequency-domain analysis.
Resumen:
— Cuando la luz se encuentra con el sonido, emerge una nueva dimensión de análisis. Este trabajo examina las observaciones de agujeros negros a través de la teoría de señales y la mecánica de ondas acústicas. Utilizando datos del Telescopio del Horizonte de Sucesos EHT, las imágenes de agujeros negros se tratan como señales digitales tridimensionales, donde la envolvente analítica de Hilbert y la Transformada Discreta de Fourier (DFT, sigla en inglés) normalizada revelan estructuras y simetrías ocultas. La sombra gravitacional se interpreta no como silencio, sino como una caída medible de energía—una huella de absorción en lugar de una simple ausencia. La identidad de Euler se emplea para mapear la fase y la simetría de la señal en planos polares y complejos, ofreciendo un camino matemático intuitivo hacia el horizonte de eventos. Al aplicar conceptos acústicos fundamentales como la resonancia, la interferencia y la entropía, el campo que rodea al agujero negro se convierte en una señal comunicativa. Este enfoque interdisciplinario unifica el procesamiento digital de señales, la teoría electromagnética y la acústica en una metodología innovadora para el análisis astronómico. Cabe destacar que, al realizar una evaluación completa del ruido, se logra una mejora significativa en la resolución y transmisión de información de las imágenes publicadas por el EHT.
Palabras clave: imágenes de agujeros negros, procesamiento digital de señales, envolvente de Hilbert, análisis acústico, análisis en frecuencia.
I. Introduction
Information transfer is a universal principle bridging quantum mechanics and classical communication, where all signals carry energy, meaning, and noise encapsulated in discrete packages such as numbers, letters, bits or waveforms.
Sonic language emerges when wave patterns become mutually intelligible between two or more individuals, enabling them to convey meaning. Written language, in turn, is a system of abstract symbols that represent the sound of the waveform; in this sense, a text functions like a musical score.
For example, vowels represent the shape the mouth must take to produce a given tone, while consonants define the articulation and structural rhythm of pronunciation. Although the combination of these symbols is remarkably expressive, different languages that share the same basic alphabet often act as acoustic privacy filters, where unfamiliar waveforms or combinations may be heard but not understood or readable.
Architectural acoustics addresses how signals travel from emitter to receiver, aiming to reduce distortion and preserve intelligibility particularly in the articulation of consonants, which are most susceptible to masking. In this analogy, amplitude corresponds to font size or pixel intensity, noise to typographic clutter or distortion, and reflections to the overlapping of tints and shadows that blur the visual message.
Epistemology refers to the study of knowledge itself: how we know what we know, what counts as valid information, and what frameworks we use to extract meaning from observation, therefore visual images from black holes can be studied like waves composed of discrete points or pixels.
In this study, images from EHT and PRIMO will serve as reference benchmarks to test the hypothesis that, by approaching the problem as an acoustic engineering task with the application of digital signal processing, it is possible to improve information transfer from black holes observations.
II. Digital domain waves
In sound engineering, natural signals such as speech or the sound produced by a musical instrument are identified as unique, non-repeatable events that exist only once in life. Information transfer between source and receiver occurs within fractional time intervals, relative to a synchronization function. If a message is not understood, the receiver may request repetition from the emitter.
In other cases, such as in noisy classrooms or Moiré-style animations, the brain demonstrates the ability to reconstruct incomplete signals. This occurs because familiar waveforms are stored within a perceptual database, allowing the cognitive system to interpolate missing information and preserve semantic meaning.
Digital audio, image and video work with this cognitive behavior, where a continuous data frame of discrete voltage values creates the illusion of sound or motion perception, known as sampling frequency or frames per second fs.
To encode an analog waveform with minimal information loss, the Nyquist–Shannon sampling theorem must be satisfied, the sampling frequency fs must be at least twice the highest frequency component present in the signal to ensure accurate reconstruction [1]. In architectural practice, this concept finds a parallel: defining a distance or magnitude requires at least two reference points, from L0 to Lx. Once these boundaries are established, the midpoint can be calculated as the arithmetic mean.
To increase resolution, the interval between limits can be subdivided by increasing the fs, however, this is constrained by both the capabilities of the measurement tools and the limits of human perception. For instance, a one-meter length can be divided into 1.000 millimeters, approaching the practical threshold of visual or mechanical resolution, for greater precision, microscopy techniques become necessary.
Moreover, the meter itself is an abstract standard of length defined independently of individual perception. This is precisely why standardization is essential in commercial transactions, where relying solely on human perception could lead to misinterpretation or dispute.
A. Bit Depth
he ability to reconstruct incomplete signals. This occurs because familiar waveforms are stored within a perceptual database, allowing the cognitive system to interpolate missing information and preserve semantic meaning.
Digital audio, image and video work with this cognitive behavior, where a continuous data frame of discrete voltage values creates the illusion of sound or motion perception, known as sampling frequency or frames per second fs.
To encode an analog waveform with minimal information loss, the Nyquist–Shannon sampling theorem must be satisfied, the sampling frequency fs must be at least twice the highest frequency component present in the signal to ensure accurate reconstruction [1]. In architectural practice, this concept finds a parallel: defining a distance or magnitude requires at least two reference points, from L0 to Lx. Once these boundaries are established, the midpoint can be calculated as the arithmetic mean.
To increase resolution, the interval between limits can be subdivided by increasing the fs, however, this is constrained by both the capabilities of the measurement tools and the limits of human perception. For instance, a one-meter length can be divided into 1.000 millimeters, approaching the practical threshold of visual or mechanical resolution, for greater precision, microscopy techniques become necessary.
Moreover, the meter itself is an abstract standard of length defined independently of individual perception. This is precisely why standardization is essential in commercial transactions, where relying solely on human perception could lead to misinterpretation or dispute.
A. Bit Depth
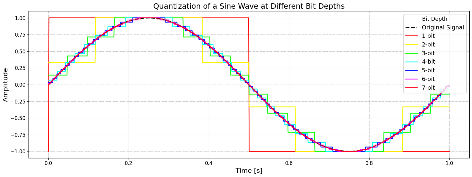
In binary encoding, the number of bits determines the possible amplitude levels that a digital signal can adopt (1). This relationship follows natural binary reproduction growth.
 (1)
(1)For an 8-bit signal, this results in 256 levels ranging from N0 to Nn-1 , and a 32-bit audio signal has over 4 billion possible discrete states, providing extremely fine resolution as represented in Fig. 1.
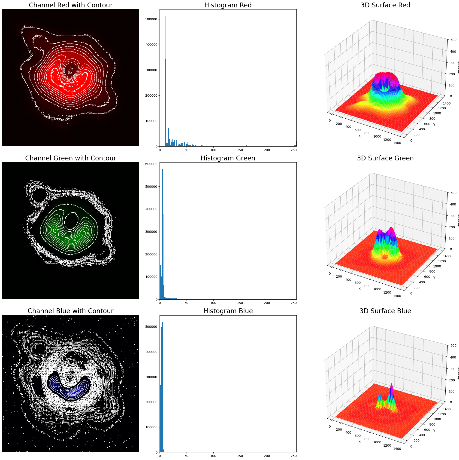
In Python, tools from matplotlib library such as histogram, contour maps, 3D surface plots and colormaps are useful to analyze the distribution of amplitude across the pixel intensities in each image channel.
Fig. 2 presents the channel analysis for the M87 EHT image. On screen pixel intensity often results in perceptual masking of lower levels. To enhance the visual interpretation of channel information, an HSV colormap has been applied on the 3D surface plot.
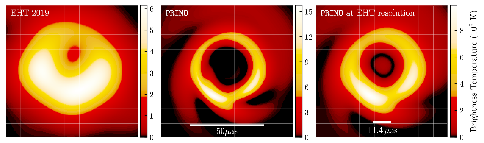
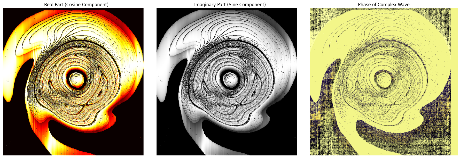
By applying a simple level adjustment in Photoshop to the M87 images presented in the work of Lia Medeiros et al. which used the PRIMO algorithm on the original 2019 EHT data [2], sharp transitions in brightness become immediately visible in Fig. 3. These features are not apparent in the original images due to perceptual masking, much like how background noise blurs speech intelligibility in architectural spaces.
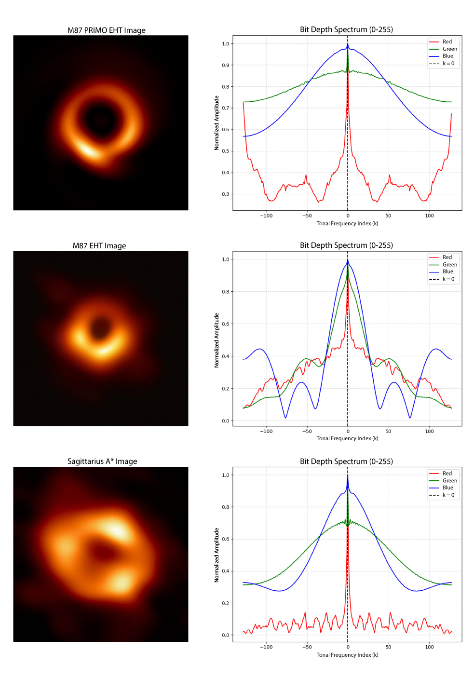
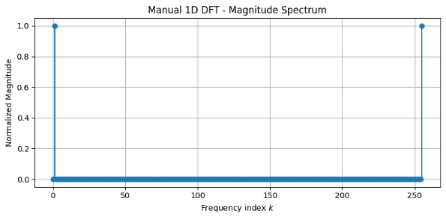
In image analysis, the histogram allows study the distribution of pixel intensity values across discrete levels. Applying the Discrete Fourier Transform (DFT) to the histogram allows the pixel intensity distribution to be treated as a finite signal, enabling the analysis of tonal structure in terms of frequency components [3].
The histogram DFT is defined as (2):
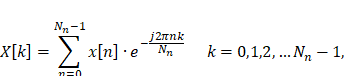 (2)
(2)Where x[n] is the histogram value at intensity level n, Nn is the number of bins, k is the frequency index, and X[k] are the DFT coefficients representing the frequency content of the histogram.
Fig. 4 shows a comparison between different black holes available images including M87 and Sagittarius A*. A consistent spectral pattern can be observed: the red channel exhibits a higher concentration of high-frequency components, while the green and blue channels are dominated by lower-frequency content, that tends to resemble a modal shape present in room acoustics response.
B. Entropy
To relate how bit depth links amplitude to discrete values through quantization, it is worth taking a quick detour into quantum mechanics. In his foundational paper [4], Max Planck introduced a statistical interpretation of entropy in systems of electromagnetic resonators, he stated that “Entropy implies disorder, and this disorder, according to the theory of electromagnetic radiation, arises in monochromatic oscillations of a resonator”.
In an RGB image, each channel can be thought of as an independent monochromatic resonator as considered before.
Planck mentions that entropy S of such a system is related to the Boltzmann constant kb and the number of microstates Nn (3):
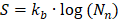 (3)
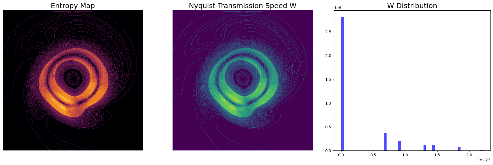
(3)Harry Nyquist, on the other hand [5], considered that the maximum speed W of transmission is related to the number of current values m, where in a circuit a line speed (4) is:
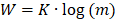 (4)
(4)Where K is a constant and m represents the number of characters, in this case the number of available levels, the higher the number of signal elements, the higher the amount of intelligence. Nyquist explains that if n is the number of signal elements per character, the total number of characters that can be constructed is mn, given binary code has two characters 2n levels can be generated, reinforcing the connection between entropy, information capacity, and bit depth.
Claude Shannon, in his foundational work A Mathematical Theory of Communication , formalized this link by defining entropy H as a measure of uncertainty in the information source. The Shannon entropy (5) is given by:
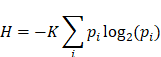 (5)
(5)Where pi is the probability of observing state i, and K is a constant depending on the system that may be taken as the Boltzmann constant, as Planck suggested. The probability pi is a function of the available states (6):
 (6)
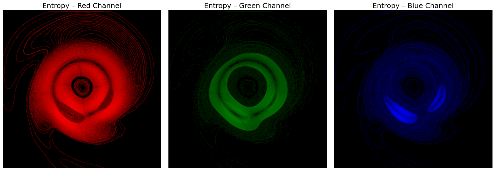
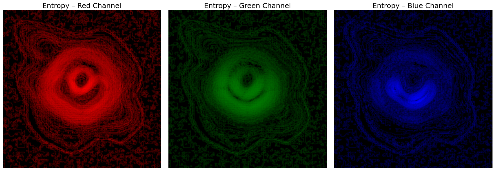
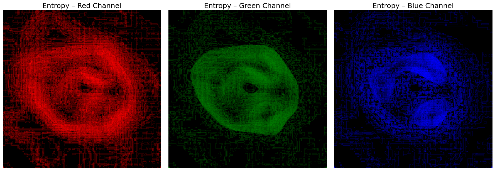
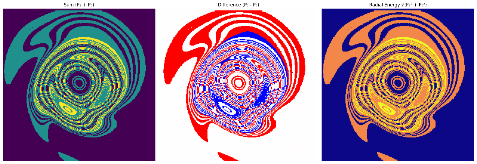
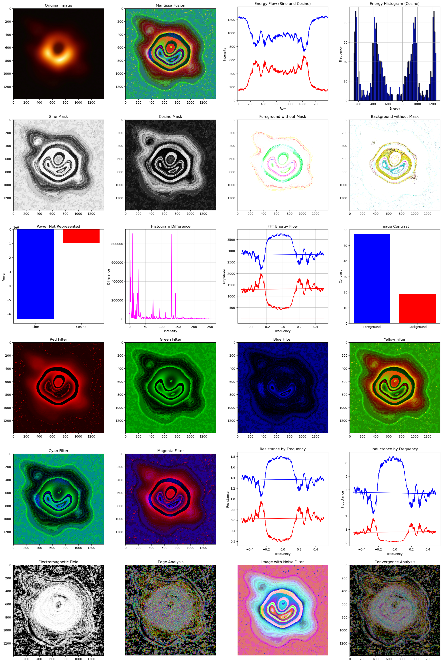
(6)In Fig. 5, using the entropy filter from scikit-image, with a 5-pixel moving window is used to extract hidden informational patterns, then a denoised gaussian filter was applied to achieve a more stable image from grayscale data.
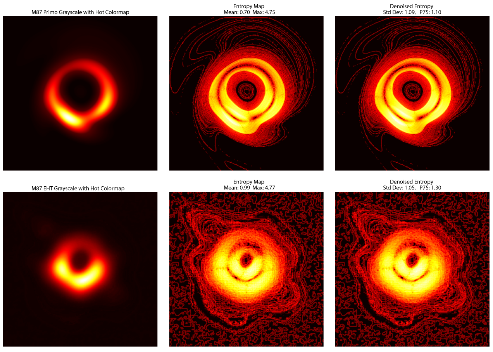
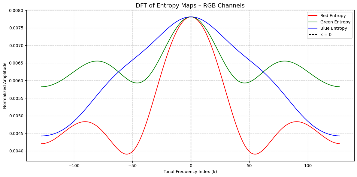
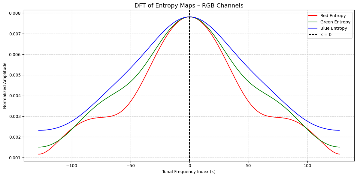
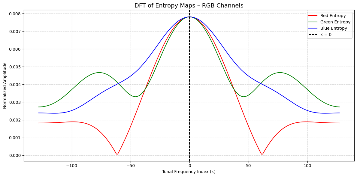
Fig. 6 shows entropy profiles for each monochromatic channel considered independently as well as for DFT. In the green and blue channels, informational content that was previously hidden in the lower tonal levels of these systems is now perceptual. In contrast, the red channel exhibits a DFT response that strongly resembles a sinc function, a behavior well-known in the electroacoustic of multiple speaker arrays.
This pattern implies the presence of coherent constructive interference and well-defined transitions between ordered and disordered zones within the red entropy field.
If each state is equally probable in a uniform quantization system (7), and the number of possible states at level 2n:
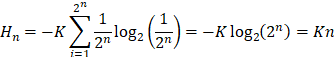 (7)
(7)Increasing bit depth increases quantization states, raising entropy and information resolution. However, this depends on the sample rate, while post-production quantization or posterizing is possible, lost information can't be restored unless artificial data is added adding uncertainty.
Interestingly, this growth in informational potential can be likened to Hooke’s law (8), where the restoring force in a spring is proportional to its displacement:
 (8)
(8)In this analogy, K represents the stiffness of the system or its informational elasticity, and Δx corresponds to the amplitude of motion, which can relate to Nyquist speed information or intelligence transmission.
John William Strutt also known as Lord Rayleigh, in The Theory of Sound [6] explains that stiffness constants K governs the propagation speed of wavefront in stretched string and can be derived from Hooke`s Law, where K as in entropy depends on the material properties as the Young’s modulus E and the cross-sectional area A.
In elastic theory, the tension T (9) stored in a string of natural length L when stretched to a length L′ is given by:
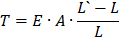 (9)
(9)The wavefront speed c (10) is related to the tension and the linear mass density μ, or as in special relativity theory to the energy e and the mass of the particle m:
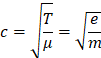 (10)
(10)As in quantum mechanics, standing waves in strings respond to discrete modes. Their natural frequencies (11) are harmonically related and constrained by the length of Lx, where the fundamental mode corresponds to a wavelength that is twice the length λ = 2Lx:
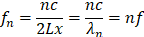 (11)
(11)The greater the stretch of a string, the greater the tension, the greater wavefront speed c, where higher elastic energy storage state leads to higher frequency oscillations. This behavior mirrors Planck’s quantum energy relationship (11):
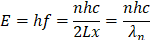 (11)
(11)Where h is the Planck`s constant, that is the linear expression of the reduce Planck’s constat , that represent the angular momentum of the electron in Bohr radius of the hydrogen atom where  (kg×m2×s-1).
The rest of the energy is stored as passive energy in a system due to its configuration. For example, tension in a stretched string allows the system to oscillate, where the potential energy is at equilibrium (12), in relativistic terms:
 (12)
(12)In a stretched string or elastic system, the static displacement x0 (13) due to pre-tension increase speed:
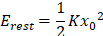 (13)
(13)Dynamic energy is the energy fluctuating around the equilibrium due to a disturbance (14), where the acoustic pressure emitted by a string instrument if proportional to the initial input force or the amplitude Δx of motion, which relates to mass times acceleration, as in Newton’s second law:
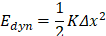 (14)
(14)Without a triggering force, the system remains at rest, but already energized, like a compressed spring or a charged field, the higher the tension the lower the amplitude of motion available thus less string is available to oscillate (15):
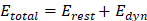 (15)
(15)This principle has analogies in electronic and acoustic systems, for instance, a camera shutter requires a baseline voltage to operate or rest energy, generating a background noise floor, especially evident at high ISO settings.
Fig. 8 completes the entropy analysis, where the histograms are flattened and smoothed using a Gaussian filter. The first and second derivatives are then calculated using NumPy.Gradient. The relative mass is defined as the normalized pixel intensity xi relative to the entropy scale 8-bit scale where m = xi/8.
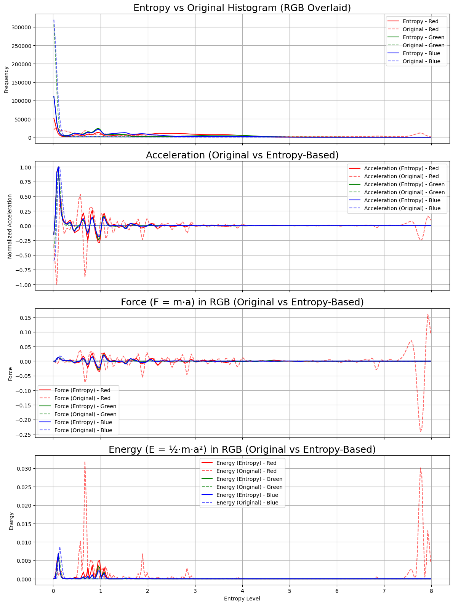
C. Histogram equalization
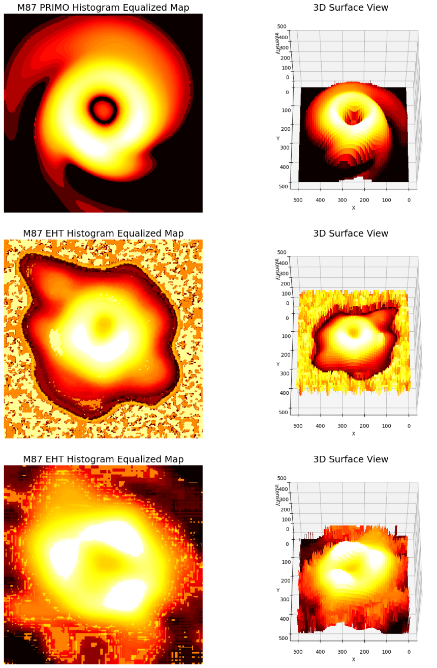
In digital image processing, histogram equalization is a contrast enhancement technique that redistributes pixel intensities to span the full dynamic range. This prevents the clustering of values within a narrow band, as seen in earlier unprocessed images.
This implementation, shown in Fig. 9, applies OpenCV’s cv2.equalizeHist function, followed by a Gaussian blur to reduce noise and improve local uniformity. The resulting intensity distribution is visualized both as a 2D heatmap and as a 3D surface using Axes 3D
For a more detailed 3D representation, in Fig. 10 Plotly was used to generate interactive surfaces with real-time control over lighting, angle, and zoom. This not only enhances visual analysis but also enables the export of the surface as a 3D printable heightmap, bridging digital signal processing and physical modeling.
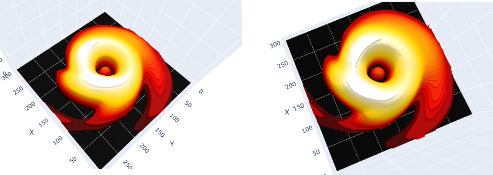
From this analysis PRIMO-enhanced image reveals a lower rest energy, evidenced by its reduced background entropy and more efficient use of dynamic range.
D. Bit planes
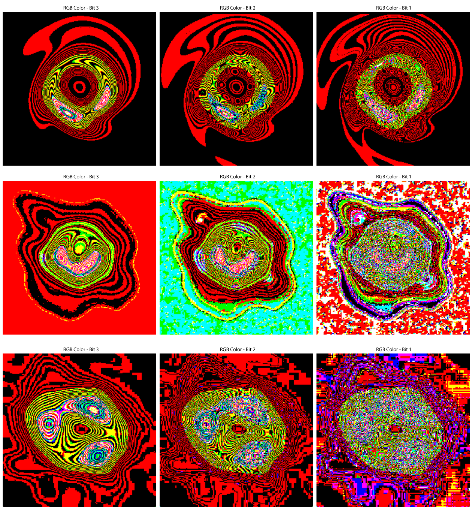
Bit plane decomposition is a technique used in digital image processing to analyze the contribution of each individual bit in the binary representation of pixel intensity values [7]. In an 8-bit RGB image, each channel contains 8 binary layers ranging from the most significant bit MSB or bit 7 to the least significant bit LSB or bit 0.
Applying this analysis to M87 PRIMO in Fig. 11, it reveals that in the green and blue channels, most of the structural information is concentrated at the LSB level.
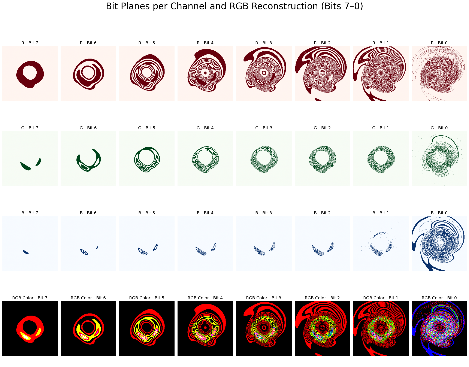
In bit 2 and bit 1, spherical or radial surfaces are notable in the area near the central body, this reveals that coherent information of low order is present in Fig. 12, while on M87 and Sag A* EHT background noise and distortion begin to be predominant in this area.
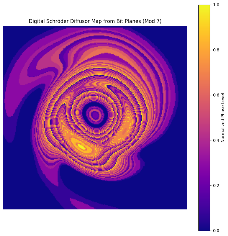
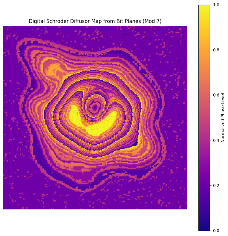
In acoustics, sound diffusers are based on the quadratic residue series discovered by Carl Friederich Gauss, which were later explored by Manfred Schroeder in his book Number Theory in Science and Communication [8]. These sequencies have been used from signals analysis to acoustic design of concert halls.
Bit-plane’s phase level is determined by the modulus of the prime number (16) of the MSB plane.
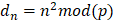 (16)
(16)By analogy, this principle can be applied to bit planes in digital images or signals, such that the bit index n∈[0,7] acts as the spatial sample, a prime modulus p defines the residue cycle, the resulting dn acts as a phase level assigned to each plane as in Fig. 13.
In binary encoding, the number of bits determines the possible frequencies or energy levels that can be represented inside the Nyquist theorem, where 1-bit or binary ground state can hold two digits like the number of electrons in Bohr radius. The Sommerfeld and Pauli exclusion model establish that an electron can occupy a specific energy level, determined by the possible combinations of the quantum numbers n, l, m, and the electron spin up and down.
The quadratic value then represents a sum of the odd numbers (17), that can start in 0 like in binary planes or in 1 like in quantum mechanics.
 (17)
(17)This can be extended to Girolamo Cardano theorem for the cubic root or the basic of complex numbers, where nonlinear combinations of bit layers reconstruct coherent energy.
 (18)
(18)
III. Interferance patterns
Digital images behave much like an audio signal, a composition of discrete values to storage a mix of oscillations, harmonics, and amplitude. The key distinction lies in the domain; these modulations are distributed across a two-dimensional spatial plane rather than time.
Considering the Nyquist-Shannon theorem, a pixel with intensity 1 can be represented at the other side of the central or neutral value 127 or fs/2. This means that when the image is inverted in phase, the new pixel values is 254 and vice versa.
This interpretation allows us to understand a digital image as a frozen waveform, where each pixel captures a discrete amplitude value. In the RGB color model, its inverse corresponds to the CYM (Cyan–Yellow–Magenta) color complement. Thus, both representations are mathematically linked, forming a dual system where color and anti-color are symmetrically encoded, or energy and dark energy.
By combining the original image with its inverted version, various interference patterns can be generated using simple mathematical operations—such as addition, subtraction, multiplication, division, mean, or root sum of squares. These operations simulate constructive or destructive interference, which can be used to enhance color contrast, suppress noise, or reveal latent geometric structures within the image.
Fig. 16 shows that for M87 PRIMO the sum of squares improves image quality notable; it tends to be the same representation of the bit plane 2 with the difference that the radial shapes are not present. This is a simpler process that can be performed in any digital image software but in python, mathematics between signals can represent physics equations.
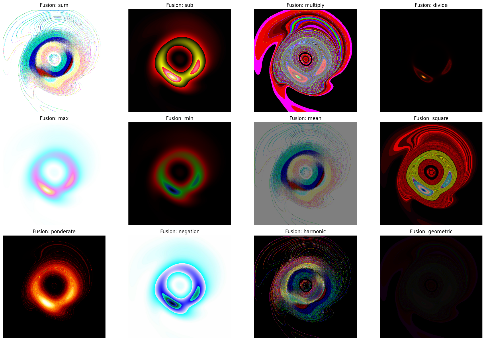
This process behaves like a quick tool allowing comparative evaluations and signal chain optimizations, that can be conceptualized like auxiliary channels or parallel image processing, side-chain compression or frequency-space filtering.
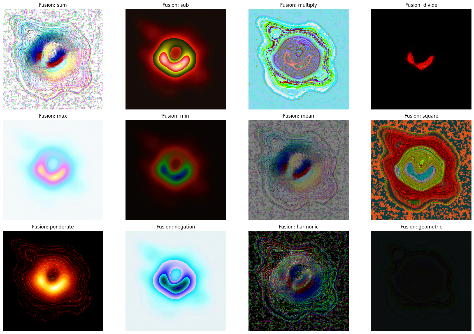
Each image behaves like a reverberant space, analogous to an acoustic room, where every geometry responds uniquely. Therefore, image fusion becomes site-specific engineering, requiring tailored mathematical approaches for each context.
For example, Fig. 18 shows the mantissa fusion method for M87 EHT, this allows the increase of detail, where around the accretion disk radial bodies are present.
IV. Complex Signal Analysis
Every signal carries more than just what is visible or audible, it encodes phase, rotation, frequency content, and damping. In the case of naturally damped waves, these properties define how energy propagates and fades. All systems inherently possess a natural reverberation time, dictated by their boundary conditions, constructive interference from wave superposition and energy dissipation.
Emerging from Cardano's solutions to cubic equations, later formalized by Gauss and explored by Euler, complex numbers have become indispensable in signal analysis, they allow to model phase, represent signal rotation in the complex plane, and analyze spectral components with far greater precision.
For any real-value wave, the Hilbert function form SciPy provides a powerful tool for constructing its complex analytic signal. This transformation enables the creation of a Hilbert analytic envelope (19), which reveals the instantaneous amplitude and phase of the original waveform.
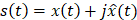 (19)
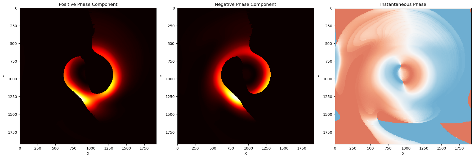
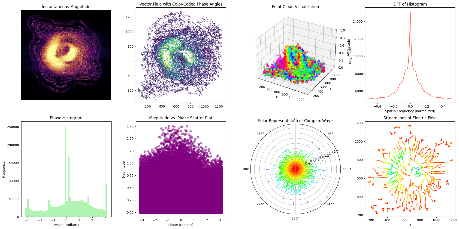
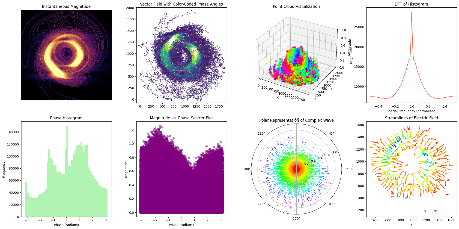
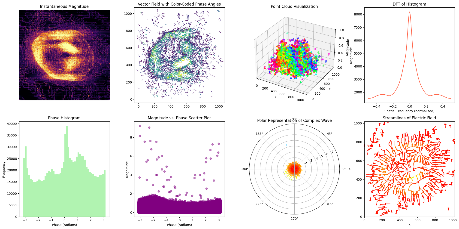
(19)Fig. 19 shows the basic script to get the complex signal that can be decomposed on positive and negative phases, that can be useful to study interferometric asymmetries, signal polarity, and resonance structure, which are crucial for analyzing wave behavior, modulated textures, and perceptual balance in images and acoustic fields.
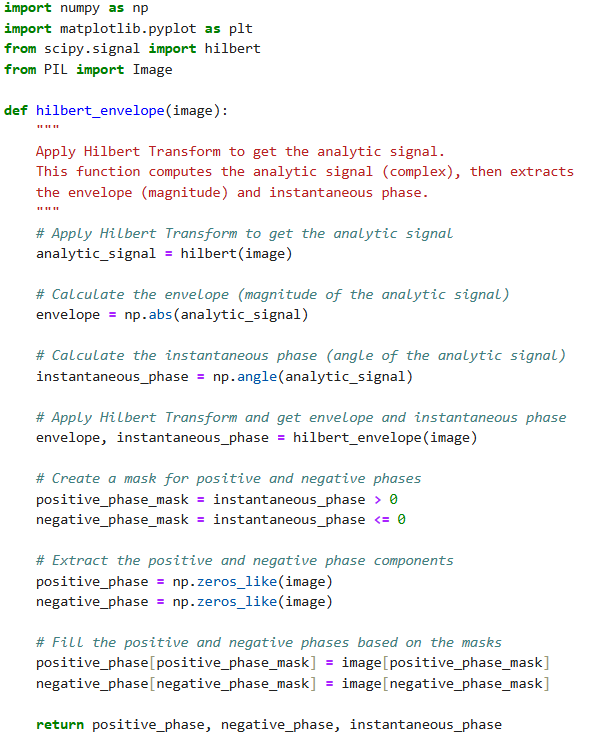
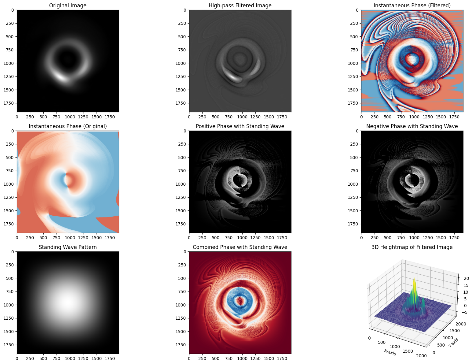
Fig. 20 shows that black hole observations carry phase information, when processed through a Hilbert-based algorithm directional interference patterns emerge.
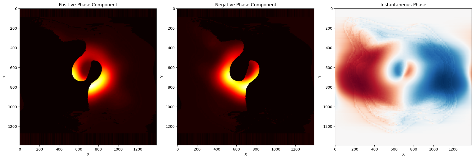
Applying a Gaussian high-pass filter before computing the Hilbert envelope to reduce bass helps enhance fine detail. This procedure, commonly used in audio processing, shows that each phase carries complete information. A standing wave pattern simulates resonance within a bounded system, like a membrane or room, as a synthetic interferogram, where positive and negative phases are spatially modulated to simulate real wave superposition. What is interesting about this procedure is that rarefaction and compression is visible on the accretion disk.
Applying cosine and sine mask to the instantaneous phase a complex angular wave can be obtained; this shows that more information is present on the background noise.
Another type of analysis derived from Hilbert space representations includes the construction of vector fields using quiver plots, 3D point cloud visualizations for modeling, phase histograms, polar representations of the complex waveform, and even streamlines of the electric field. In this case, the electric field is estimated by applying a Sobel operator to the cosine component. For this approach, sine and cosine masks were first applied to the image, and then the Hilbert analytic envelope was computed separately.
V. Conclussions
By analyzing data from the EHT and PRIMO reconstructions, digital images were treated as multidimensional signals within a finite boundary space analogous to a reverberant room.
Although the event horizon is considered the theoretical boundary beyond which light cannot escape, and the accretion ring marks this luminous frontier, this study shows that valuable structural and energetic information can still be extracted both within and around that limit. Radial features previously obscured become perceptible, which may suggest the presence of multi-orbital structures or, alternatively, highlight artifacts introduced by the image reconstruction algorithms themselves. More profound research is needed to confirm the nature of these structures to get a valid scientific affirmation.
The PRIMO algorithm yields a more stable and coherent representation of the M87 black hole with a lower background level. However, to ensure greater data fidelity and structural insight, it is recommended that the Event Horizon Telescope Collaboration apply the same analytical approach to the Sagittarius A* dataset to compare results.
All the signal and image analysis presented in this work has been conducted using Python-based open-source tools and exclusively using publicly available images released by EHT Collaboration. Due to file compression, noise artifacts, and potential preprocessing steps applied during data publication, RAW datasets could bring more valid scientific conclusions.
Acknowledgments
The author wish to thank the comments and feedback from the anonymous reviewer for giving this paper a more coherent form.
This research received no external funding and is a small part of a broader research effort carried out over the past two years. All findings result from mathematical operations rooted in signal theory and acoustics, although artificial intelligence provided coding assistance, the true spark of understanding stems from human connection. A book, in this sense, is not just a container of information, it is a short circuit between minds, bridging time, space, and lived experience.
As Marshall Long points out in Architectural Acoustics, “Houtgast, Steeneken, and Plomp reasoned that stars are the spatial equivalent of an acoustical impulse source” idea that eventually led to the Speech Transmission Index STI, derived from the Modulation Transfer Function MTF. In that same spirit, this research proposes that when light meets sound, acoustic engineering can provide a robust framework for analyzing astrophysical phenomena.
References
[1] C. E. Shannon, A Mathematical Theory of Communication, The Bell System Technical Journal, Vol. 27, pp. 379–423, 623–656, 1948.
[2] L. Medeiros, D. Psaltis, T. R. Lauer, and F. Özel, The Image of the M87 Black Hole Reconstructed with PRIMO, The Astrophysical Journal Letters, 947:L7 , 2023.
[3] J.W. Cooley, J. W. Tukey, An algorithm for the mathematic calculation of complex Fourier series, Mathematics of Computation, Vol. 19, pp. 297–301, 1965
[4] M. Planck, Über das Gesetz der Energieverteilung im Normalspectrum. Annalen der Physik, 4, pp. 553–563, 1901.
[5] H. Nyqusit, Certain Factors Affecting Telegraph Speed, The Bell System Technical Journal, vol. 3, no. 2, pp. 324-346, 1924
[6] J. W. Strutt, Lord Rayleigh, Theory of Sound, Volume 1, Macmillan and Co, London, pp. 127-128, 1877.
[7] J. W. Schwartz and R. C. Barker, Bit-Plane Encoding: A Technique for Source Encoding, in IEEE Transactions on Aerospace and Electronic Systems, vol. AES-2, no. 4, pp. 385-392, 1966
[8] M. Schoeder, Number Theory in Science and Communication, Fifth Edition, Springer-Verlag Berlin Heidelberg, pp. 219-226. 2009 ISBN: 978-3-540-85297-1

