

SIGMA: Wireless System with Geolocation for Environmental Monitoring
 Jeaneth Acero jeaneth.acero@agrocalidad.gob.ec
Danny S. Guamán danny.guaman@epn.edu.ec
Christian Reyes christian.d.r.l@gmail.com
José Estrada-Jiménez jose.estrada@epn.edu.ec
Jeaneth Acero jeaneth.acero@agrocalidad.gob.ec
Danny S. Guamán danny.guaman@epn.edu.ec
Christian Reyes christian.d.r.l@gmail.com
José Estrada-Jiménez jose.estrada@epn.edu.ec
Latin-American Journal of Computing
Escuela Politécnica Nacional, Ecuador
ISSN: 1390-9266
ISSN-e: 1390-9134
Periodicidad: Semestral
vol. 12, núm. 1, 2025
Recepción: 15 junio 2024
Aprobación: 22 septiembre 2024

Abstract: —The increase in the number of automotive parks, the emissions generated by industries, and the forest fires, among others, deteriorate the air quality of the Metropolitan District of Quito. Low-cost devices (sensors) distributed throughout the city to collect and deliver information on concentrations of gaseous pollutants in real time are essential for preserving the health of the citizens. This kind of technology can contribute to improving air quality by controlling the emissions of harmful substances into the atmosphere. This paper shows a prototype system for environmental monitoring using open hardware and software technologies. The system comprises two subsystems: a transmitter (mobile) and a receiver (fixed). The transmitter unit has been installed in a public transport vehicle (a taxi or any public transportation), which allows the acquisition of environmental parameters such as carbon monoxide, ozone, nitrogen, temperature, humidity, geographic location, time, and date. The obtained measurements are sent in real-time to a receiver subsystem, mainly consisting of a server, where the received data is processed and published in a pollution map. This data informs citizens by geographical areas, about the different levels or concentration ranges of a particular gas, and general air pollution in the city.
Keywords: Air pollution gas sensors, Pollution, Map, Wireless Monitoring.
I. Introduction
In the last ten years, the demographic and geographic growth of the city of Quito has generated a significant increase in public and private transportation, which in turn has led to a rise in emissions of air pollutants generated by vehicle combustion. This effect has deteriorated and is deteriorating the quality of life of the city's inhabitants.
Environmental monitoring systems related to air pollution are vital to preserving the ecosystem because they allow a better perception of the polluting emissions sent to the atmosphere and the air quality available at different points in the city. Currently, the city of Quito has an Environmental and Atmospheric Monitoring Network (REMMAQ), which is made up of static monitoring stations in charge of obtaining, processing, and presenting information on different environmental pollutants; however, the number of stations is minuscule compared to the size of the city (9 main stations) [1].
Accordingly, this work implements a wireless prototype for monitoring air pollutant gases, developed under free hardware and software platforms. The developed system allows real-time information on CO, O3, and NO2 gas concentrations in the environment. In addition, the collected data is processed and presented through a geographical map of pollution using a web interface.
The main advantage of the prototype is its mobile feature, which allows pollution information to be obtained anywhere, only through an Internet connection through the 3G cellular network. The prototype enables information to be received at locations far from static monitoring stations, providing additional data to the current network and providing inhabitants with easily interpreted information.
II. Related Work
Research related to the acquisition of pollutant gases in the environment uses different technologies in the dev
Research related to the acquisition of pollutant gases in the environment uses different technologies in the development and implementation of the prototype. In [2], the MAQUMON system uses sensors for the acquisition of pollution information; the information is sent via Bluetooth technology to a transmitter node (Gateway) installed in a moving vehicle. When the transmitter node finds an available WiFi network, it transmits all the acquired information to a remote server to present the results in a web interface later. Its operation is based on data acquisition and accumulation (storage), using geolocation marks to reference the samples so that it does not send information in real-time.
On the other hand, in [3], a system based on a wireless sensor network (WSN) that acquires CO pollution data through the MiCS-552 sensor and the Octopus II platform is developed. The data collected by the WSN is transmitted to a central node (Gateway), which sends them to the remote database via text message (SMS) through the GSM cellular network. Access to the information is done through an Internet connection, although, the system does not have a user-friendly web interface that allows the interpretation of the information in a visual and didactic way.
According to the literature review, most researchers use technologies for the local transmission of information [4]. However, none focuses on transmitting data in real-time to a remote server through the cellular network via an Internet connection. Previous works also lack web interfaces for the presentation and straightforward interpretation of the information.
In the current research work, real-time monitoring of the pollution levels of CO, O3, and NO2 gases in Quito is carried out. The information is transmitted to a remote server through the cellular telephone network and 3G technology for Internet connection. The acquired data are presented through a user-friendly web interface, under the considerations established in the Quito Air Quality Index (IQCA) [1], in a geographic map of pollution and pollution vs. time graphs.
III. Prototype System Architecture
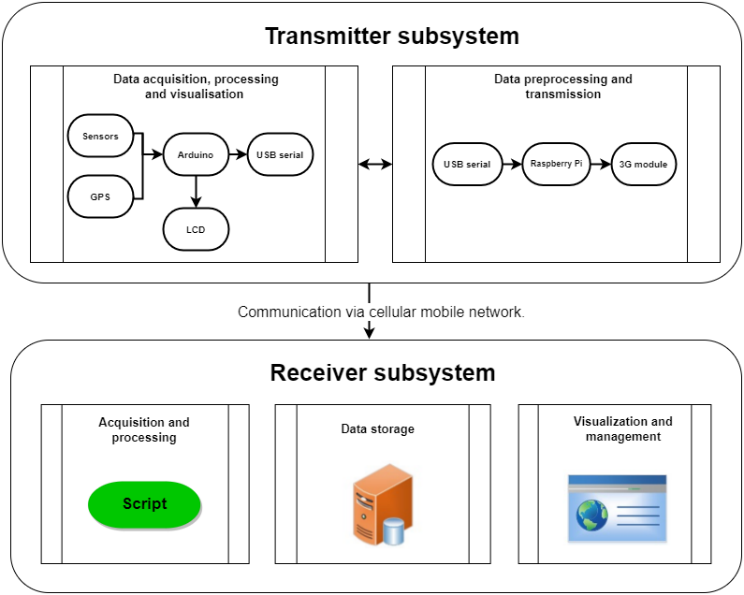
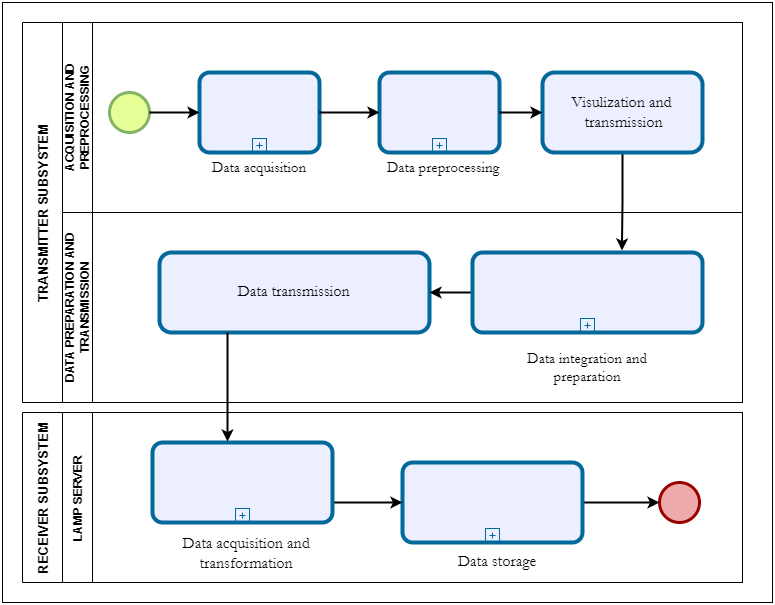
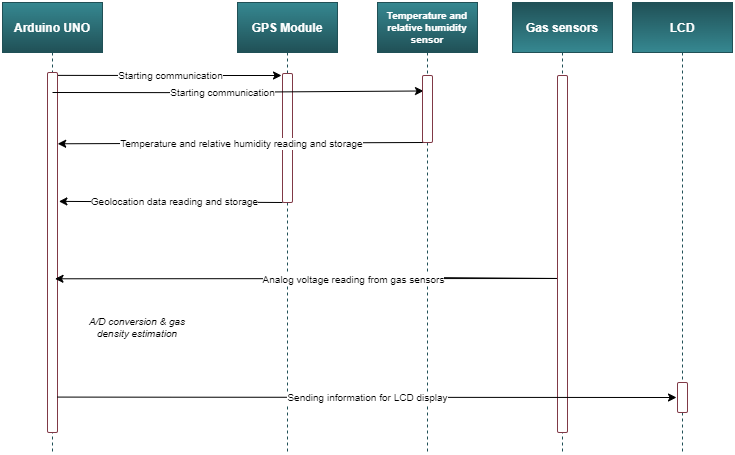
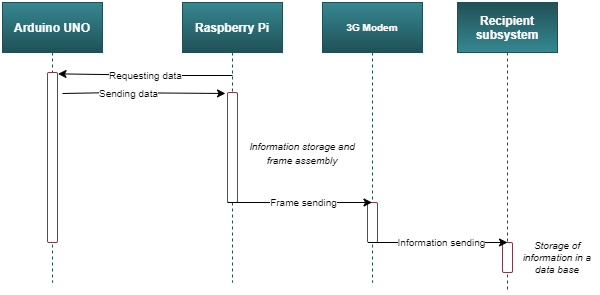
The prototype system consists of a transmitter and a receiver subsystem, which interact with each other, monitoring and displaying the levels of CO, O3, and NO2 pollution in the air. The general scheme of the prototype and the sequence of information processing between the subsystems are presented in Fig. 1 and Fig. 2, respectively. The information processing in the transmitting subsystem is shown in Fig. 3. In contrast, the sequence of sending data to the receiving subsystem is presented in Fig. 4. The different hardware and software components that compose the prototype are shown in Table I.
A. Transmitting subsystem
The transmitter subsystem is responsible for performing the following functions:
| Hardware | |
| Raspberry Pi 2 | CPU: quad-core Cortex A7 at 900 MHz. GPU: video core IV, dual core. RAM: 1GB DDR2 Ports: 4 x USB 2.0, 1X 40 GPIO pin, 1 x HDMI 1.4, 1 x Ethernet, 1 x Combo audio/mic. |
| Arduino UNO | Microcontroller: ATmega328P Digital I/O Pins: 14 (6 outputs PWM) Analog input pins: 6 |
| CO Sensor | Model: MQ-7 Technology: semiconductor Type of response: analog |
| O3 Sensor | Model: MQ-131 Technology: semiconductor Type of response: analog |
| NO2 Sensor | Model: NO2-AE Technology: electrochemical Type of response: analog |
| Temperature Sensor and Humidity | Model: DHT-22 Type of response: digital Detection range: -40 a 125 Accuracy: 0,2 |
| GPS Module | Model: Adafruit Ultimate GPS Tracking sensitivity: -165 dBm Acquisition sensitivity: speed: 0,1 m/s |
| Modem cellular | Model: Huawei E173s-6 Type: USB stick Communication technologies: 3G |
| Display LCD | Model: LCD JHD162A Type: 16x2 |
| Software | |
| O.S. Rasp.Pi | Raspbian Jessie release 8.0 |
| Server | CentOS, Apache, MySQL, PHP |
Acquire gas concentration levels of CO, O3 and NO2, temperature and relative humidity.
Acquire data on the GPS connection status, latitude, longitude, time, and date of the air sample.
Process the acquired data, conditioning it for LCD preview and transmission to the receiver.
Present the information through an LCD
Structure the data set and send the information to the receiver.
Initially, the subsystem receives all analog signals from the CO, O3, and NO2 gas sensors and digital signals sent by the temperature and relative humidity sensor and the GPS module. The Arduino UNO Single Board Microcontroller receives all this information through its input ports. The Arduino UNO board processes the received data to send it in a suitable format to the receiving subsystem and displays it on an LCD. Before sending information to the receiver, a set of data (Data) is formed by the Single Board Microcomputer Raspberry Pi, which is made up of the following fields:
Devide Id: Identifier of the transmitter subsystem.
Latitude: The transmitter's latitude (geographical location) at the moment of the air sample acquisition, expressed in decimal format.
Longitude: The transmitter's longitude (geographic location) at the time of air sample acquisition, expressed in decimal format.
Time (Hour): Time at which the air sample was acquired, expressed in the format hh:mm:ss.
Date: The date the air sample was acquired, expressed in the format year-month-day.
CO: Concentration of CO in the air sample, expressed in mg/m3.
O3: Concentration of O3 in the air sample, expressed in mg/m3.
NO2: Concentration of NO2 in the air sample, expressed in mg/m3.
Temperature: Ambient temperature at the time of acquisition of the air sample, expressed in degrees Celsius.
Relative humidity: Relative humidity at the time of air sample acquisition, expressed in percent.
The structured data sends the information to the receiving subsystem via the 3G interface connected to the Internet.
B. Calibration of Gas Sensors
To obtain the gas contamination data for CO, O3, and NO2, a multipoint calibration was performed, which consists of subjecting the sensor to different concentration levels of a specific gas (e.g., CO for the MQ-7 sensor) to obtain a straight line voltage response as a function of the gas concentration percentage. The multipoint calibration of these sensors was performed in [5], whose calibration equations are shown below:
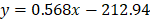 ( 1 )
( 1 )
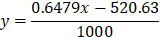 ( 2 )
( 2 )
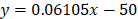 ( 3 )
( 3 )Where Eq. 1, Eq. 2, and Eq. 3 correspond to the MQ-7, MQ-131, and NO2-AE sensors, respectively.
The variable corresponds to the gas concentration in ppm, and the variable x corresponds to the response voltage provided by the sensor, which is represented in bits. The voltage results from the A/D conversion to 12 bits of the analog voltage provided by the sensor, so its values are between 0 and 4095 bits [5].
The concentrations of CO, O3, and NO2 gases acquired in the environment through the sensors are expressed in ppm, so Eq. 4 is applied to convert from ppm to mg/m3 and then to ug/m3, considering the atmospheric pressure of the place and the temperature at which the sample is obtained [6].
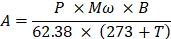 ( 4 )
( 4 )Where:
A is the gas concentration in mg/m3.
P is the atmospheric pressure in mmHg.
M is the molecular weight of the gas.
B is the concentration of the gas in ppm.
62,38 is the universal ideal gas constant.
T is the temperature in 
C. Sampling Path
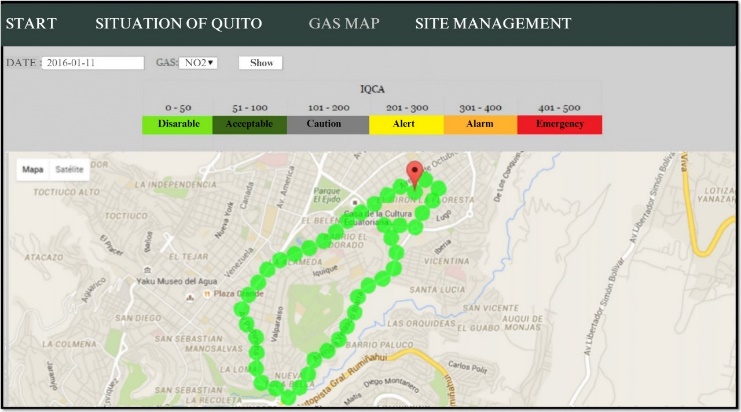
A sampling area has been established for better visualization of the contamination data. It consists of a transfer route for the prototype, allowing evidence and limiting a geographical area in Quito. Additionally, contamination circles have been generated, which present graphically (different colors) the contamination values sent by the transmitter subsystem (for example, see Fig. 6).
D. Receiving subsystem
The receiving subsystem performs the following functions:
Receive and process the information sent by the transmitter.
Store the processed data
Display pollution levels on a geographical map.
Present the pollution levels in a numerical report.
Display pollution levels in a time graph.
Manage specific database tables.
Receive and process the information sent by the transmitter.
Store the processed data.
Display pollution levels on a geographical map.
Present the pollution levels in a numerical report.
Display pollution levels in a time graph.
Manage specific database tables.
The server that hosts the receiving subsystem consists of a virtual machine installed in the server of the Informatics Laboratory of the Faculty of Electrical and Electronic Engineering of the Escuela Politécnica Nacional. The implementation of the receiving subsystem is based on LAMP software (Linux, Apache, MySQL, and PHP). The main task of the receiving subsystem is to receive and collect all the data sent by the transmitting subsystem. Additionally, it determines the belonging of an air sample to a specific area (pollution circle) within the established sampling route.
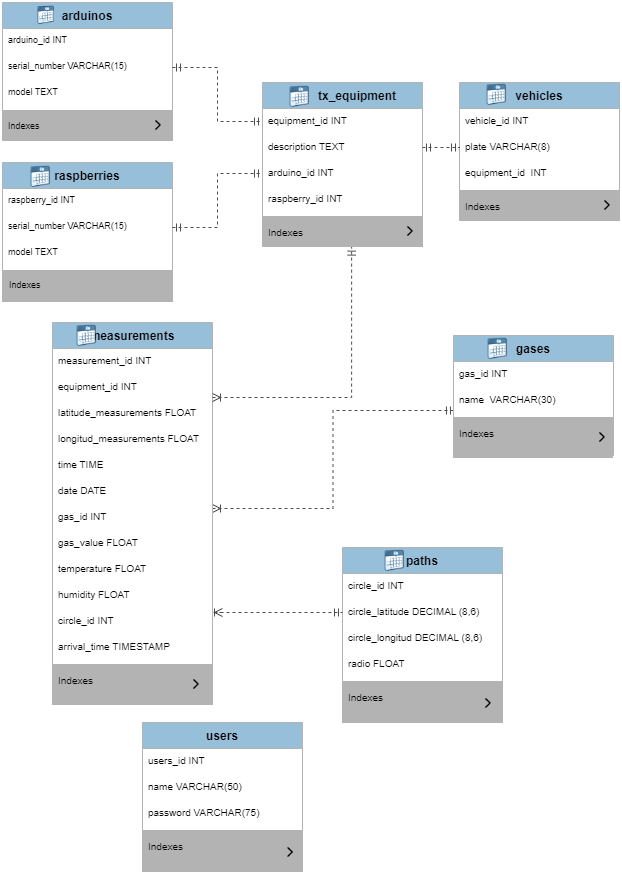
The processing of the set of information is programmed in a script, which performs all the activities mentioned above through software processing. After receiving and processing the information, it is stored in an orderly manner in a database, allowing access to it and guaranteeing its availability and integrity. The database used is of the relational type, formed by different tables depending on the type of information to be stored. The designed database is shown in Fig. 5
Finally, all the acquired information is presented to the user through a web application connected to the Internet, the web interface, and the means of interaction between the user and the receiving subsystem.
The elements contained in the web application are:
Home (home web interface): Presents a brief introduction to the project
Situation of Quito: Provides information on national and local regulations regarding air pollution.
Gas map: Presents a geographic map of air pollution.
Site administration: Allows access to the administration of specific database tables, gas concentration reports, and pollution vs. time graphs.
IV. Test and Results
A. Outdoor Scenario
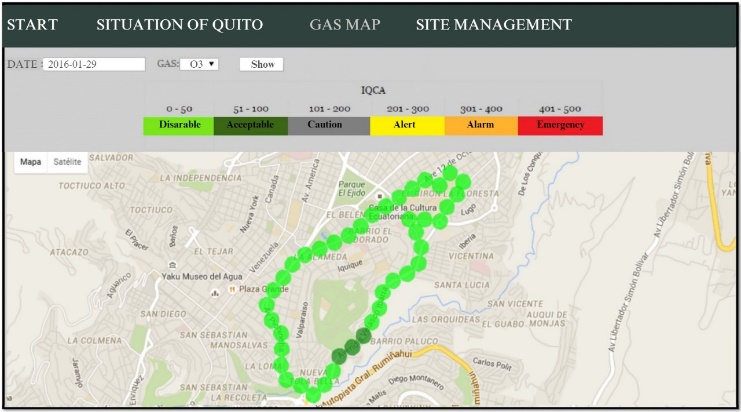
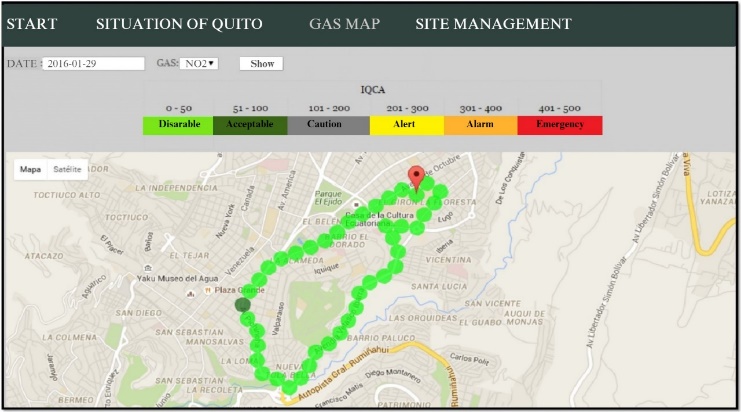
Monitoring tests of CO, O3, and NO2 gases in outdoor environments. The results obtained from monitoring CO, O3, and NO2 gases using the MQ-7, MQ-131, and NO2-AE sensors are presented in Fig. 6, Fig. 7, and Fig. 8, respectively.
The results show that the SIGMA prototype presents greater concentrations of contamination in the environment by CO, O3, and NO2 gases within the monitoring route in the desirable range of the IQCA. Additionally, the acquired data was easier to interprete due to the implemented web interface.
B. Indoor Scenario
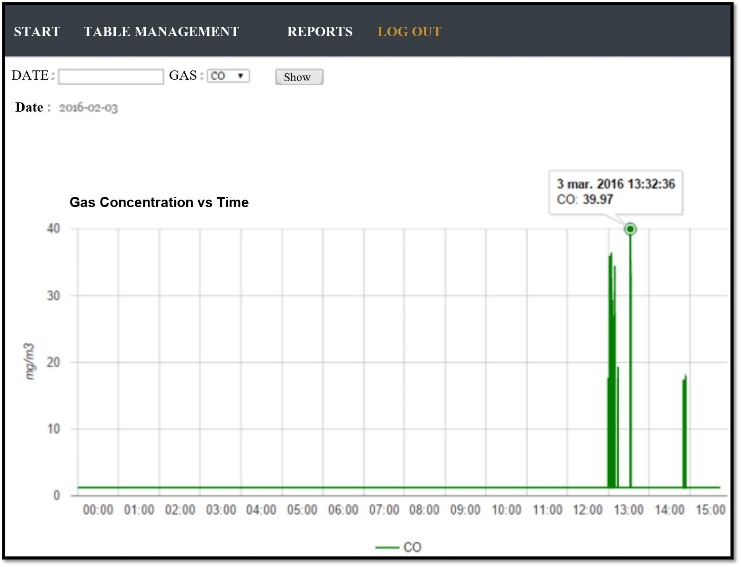
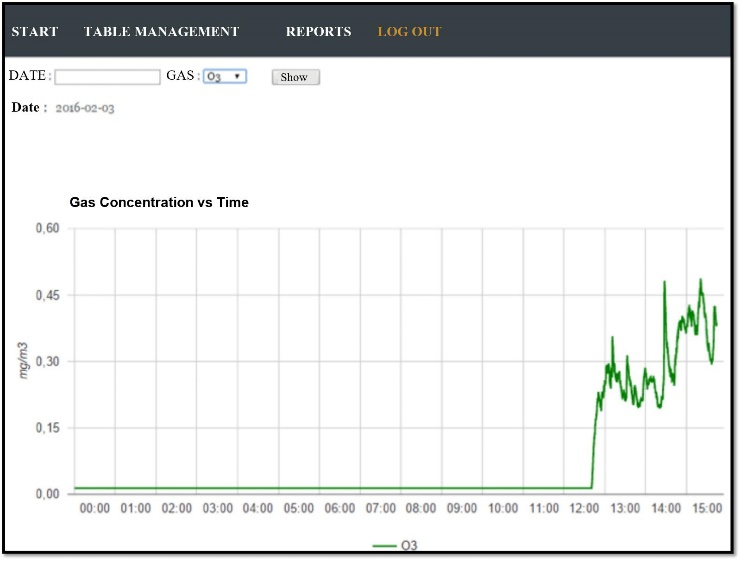
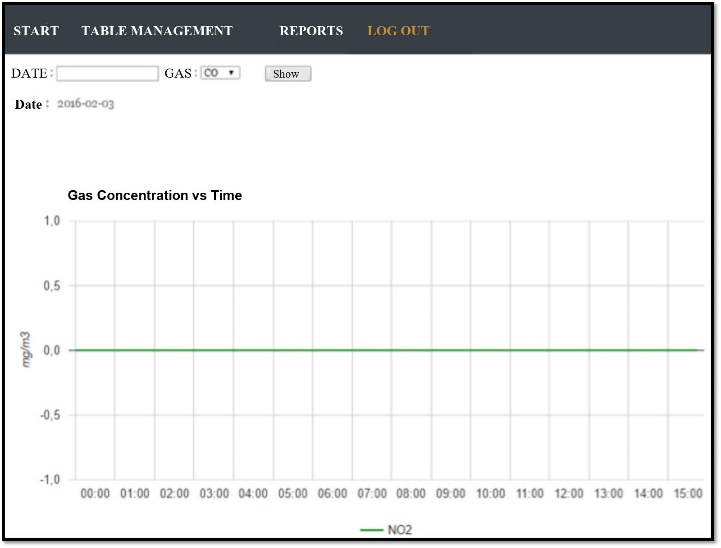
The monitoring tests of CO, O3, and NO2 gases in indoor environments were carried out in the kitchen area of the cafeteria of the Escuela Politécnica Nacional. This area was selected because it is a work environment where continuous combustion processes occur during the day (use of LPG for cooking food). The results obtained from monitoring CO, O3, and NO2 gases using the MQ-7, MQ-131, and NO2-AE sensors in indoor environments are presented in Fig. 9, Fig. 10, and Fig. 11, respectively.
Analyzing the results, the SIGMA prototype found gas concentrations of CO and O3 within the desirable level of IQCA. The graphical interface shows that the variations in the established area were sporadic, presenting peaks of contamination within a short period. Readers can access [6] for a detailed view of the implementation of the whole system and the specification of subsystems.
V. Conclusiones
This article focuses on developing a low-cost prototype that is easy to implement with devices based on free and scalable hardware and software. However, it has also taken a step towards the Internet of Things in Smart Cities as it is a real-time data acquisition system with an interactive map that allows users to visualize updated information in a didactic way through color indicators according to the established in the IQCA.
The prototype system allows wireless monitoring of air pollutant gases (CO, O3, and NO2), thus contributing real-time information on the areas with the highest air pollution index. The web interface and the pollution circles established on the map allow for a more straightforward interpretation of the pollution data acquired within the sampling route. The design of the database is scalable and provides the possibility of obtaining information from several transmitters simultaneously, as well as future data. In addition, the contamination vs. time graph provides information on the variations of gas concentrations in indoor environments, allowing a better perception of the changes in short periods.
According to the tests performed, the transmitter subsystem is suitable for monitoring CO, O3, and NO2 gases in outdoor and indoor environments with reduced temperature variations and contamination levels above the minimum detection range of the sensors used.
Future work is intended to use electrochemical sensors to acquire samples of pollutant gases, thus improving the accuracy of the data. Also, using 4G-LTE technology for its higher speed decreases the sampling time. A network of wireless sensors installed in several vehicles throughout the Metropolitan District of Quito could be implemented, allowing the monitoring of environmental parameters so that with the analysis of these, the regulatory entity can make decisions that contribute to achieving sustainable development in terms of improving the quality of the environment for citizens.
References
[1] Secretaría de Ambiente Quito, Documento Índice Quiteño de Calidad del Aire, [En línea]. Disponible en: http://www.quitoambiente.gob.ec/ ambiente/images/Secretaria_Ambiente/red_monitoreo/informacion/iqca. pdf. [Último acceso: Febrero 2016].
[2] Secretaría de Ambiente Quito, Red de Monitoreo Atmosférico, 2016. [En línea]. Disponible en: http://www.quitoambiente.gob.ec/ambiente/index.php/politicas-y-planeacion-ambiental/red-de-monitoreo. [Último acceso: Febrero 2016].
[3] P. Volgyesi, A. Nádas, X. Koutsoukos y A. Lédeczi, Air Quality Monitoring with SensorMap, International Conference on Information Processing in Sensor Networks, 2008.
[4] J.-H. Liu, Y.-F. Chen, T.-S. Lin y D.-W. Lai, Developed Urban Air Quality Monitoring System, Fifth International Conference on Sensing Technology, 2011.
[5] J. Suntaxi, Diseño y construcción de un prototipo portátil de monitoreo ambiental, mediante un sistema autónomo de adquisición de datos portátil con comunicación USB hacia un PC, Quito, 2015.
[6] J. Acero y C. Reyes, Sistema prototipo para el monitoreo inalámbrico de gases contaminantes del aire desarrollado bajo plataformas de hardware
[7] Arduino, ≪Arduino,≫ 2015. [En línea]. Disponible: https://www.arduino.cc/en/pmwiki.php?n=Main/ArduinoBoardUno.
[8] RaspberryPi Foundation, ≪RaspberryPi,≫ 2015. [En línea]. Disponible: https://www.raspberrypi.org/. [Ultimo acceso: 17 Agosto 2015].
[9] Adafruit Industries GPS, ≪Adafruit, ≫ 17 Enero 2015. [En línea]. Disponible: https://learn.adafruit.com/adafruit-ultimate-gps. [Último acceso: 17 Enero 2015].
[10] HANWEI ELECTRONICS CO. LTD, ≪Parallax Inc,≫ 12 Septiembre 2015. [En línea]. Disponible: https://www.parallax.com/sites/default/files/downloads/605-00007-MQ-7-Datasheet.pdf. [Último acceso: 12 Septiembre 2015].
[11] Henan Hanwei Electronics Co., Ltd., ≪http://www.cooking-hacks.com,≫ 10 diciembre 2015. [En línea]. Disponible:
[12] Alphasense, ≪http://www.alphasense.com/,≫ 10 diciembre 2015. [En línea]. Disponible: http://www.alphasense.com/WEB1213/wpcontent/uploads/2013/07/NO2AE.pdf. [Último acceso: 12 febrero 2016].
[13] Aosong Electronics Co.,Ltd, ≪www.sparkfun.com,≫ 12 diciembre 2015. [En línea]. Disponible: https://www.sparkfun.com/datasheets/Sensors/Temperature/DHT22.pdf. [Ultimo acceso: 15 febrero 2016].

