

A study on the impact of data balance on rainfall prediction through artificial neural networks using surface microwave radiometers
Latin-American Journal of Computing
Escuela Politécnica Nacional, Ecuador
ISSN: 1390-9266
ISSN-e: 1390-9134
Periodicity: Semestral
vol. 11, no. 2, 2024
Received: 14 February 2024
Accepted: 19 April 2024

Abstract: —The National Institute for Space Research (INPE) has been a partner in significant projects that conduct atmospheric investigations impacting various sectors, such as the Amazon Tall Tower Observatory (ATTO) project. Since 2009, the project has conducted studies on the interactions between climate and the Amazon forest. ATTO has played an essential role in providing large volumes of data obtained by meteorological sensors, contributing to a deeper understanding of the atmospheric dynamics of the region. In a landscape where Artificial Intelligence-based rainfall forecast models gain prominence, this study explores the imbalance of data from the ATTO Campina field experiment and its influence on short-term rainfall forecasts using Artificial Neural Networks (ANNs). Metrics such as MAE, RMSE, and POD, as well as FAR indices, were applied in the assessment and revealed the connection between data balance and forecast results. More balanced data or data with greater weights for different rainfall ranges yield better results. The study emphasizes the importance of reliable data for training rain forecast models, aiming to improve the dexterity of these models. This approach is fundamental to increase the reliability of these models in real environments.
Keywords: Rainfall prediction, Data balancing, Machine learning, Amazon, ATTO Campina.
I. Introduction
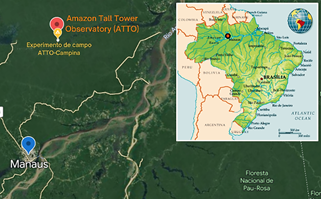
The Amazon region is home to the world's largest tropical forest and it has an equatorial and tropical climate. It is a complex and unique environment for cloud and precipitation research [1], and one of the few continental areas where primitive atmospheric conditions can still be observed [2]. The Amazon Tall Tower Observatory (ATTO) project, located approximately 150 km north of Manaus and in partnership with INPE, is an international collaboration that has focused on the interactions between climate and the Amazon rainforest since 2009. At the site, measurements of various micrometeorological and atmospheric chemical variables are conducted, covering elements such as temperature, wind, precipitation, water and energy fluxes, turbulence, soil temperature, heat fluxes, radiation, and visibility [3]. This project substantially contributes to the understanding of atmospheric processes and their global impact [2].
These advances in data collection are particularly relevant in the context of developments in Artificial Intelligence (AI) driving prediction models, including those based on Machine Learning (ML) and atmospheric data. However, measures are needed to enhance the reliability and accuracy of research results benefiting from this data. The application of AI techniques in predictions has been widely explored, as evidenced by research such as [4], [5], [6]. In 1990, during the 16th Conference on Local Severe Storms, [4] presented a study on the use of AI in storm prediction. This study stimulated the development of new research in the field, especially with the use of Artificial Neural Networks (ANNs). ANNs are systems inspired by the brain´s ability to perform calculations in parallel and distributed, enabling the accomplishment of complex tasks such as pattern recognition [7]. [8] highlighted ANNs as promising for predicting rainfall, emphasizing the need for reliable data for the effectiveness of these models.
In the literature, there are several studies that have also taken a similar approach to estimate surface rainfall. For example, [9] developed a "nowcasting" technique to analyze intense convective activities in the southeast of India, using microwave radiometers. The term "nowcasting" refers to very short-term weather forecasts, which can range from minutes to six hours. Furthermore, [10] integrated data from meteorological sensors, such as temperature, humidity, water vapor, and droplet size, into rainfall prediction models using Machine Learning (ML), representing AI approaches for weather event forecasting. In contrast, [11] developed a short-term rainfall prediction model using radiometric measurements, atmospheric parameters, and water content. However, its application in other regions is limited due to uncertainties in input data and observed results.
In this study, a simple Multilayer Perceptron (MLP) type Neural Network was configured and trained to predict short-term rainfall - one hour ahead ( t+1), where t represents the current moment before the event is observed on the surface 1 hour later. The model was fed with data from four meteorological instruments (rain gauge, two disdrometers and radiometer) dataset.
It is important to emphasize that the focus of this study is not on evaluating the model but on the impact that data imbalance can have on its proficiency. Metrics such as Mean Absolute Error (MAE), Root Mean Squared Error (RMSE), and additional parameters like Probability of Detection (POD) and False Alarm Rate (FAR) were used for evaluation, highlighting the relationship between observations and predictions.
II. Materials And Proposed Methodology
he research was conducted in five stages: data acquisition and preprocessing, exploratory data analysis (EDA) and variable selection, training of the neural network model, evaluation and testing, and analysis of results. Data were collected by four meteorological sensors: a Joss-Waldvogel impact disdrometer (RD-80), a PARticle SIze and VELocity laser disdrometer (PARSIVEL2), an automatic weighing-bucket rain gauge, and a ground-based microwave radiometer (MWR) model MP3000A.
These sensors are installed at the ATTO-Campina field experiment (2°10'53.7"S/59°01'18.7" W), located approximately 4 km northwest of the ATTO research site (2°08'38"S/58°59'59"W), as illustrated in Fig. 1. More detailed information about ATTO can be find at [2].
The RD-80, based on the principle established by [12], measures the size distribution of raindrops through the force applied on a transducer. According to [13], this equipment provides estimates of the Drop Size Distribution (DSD) considering relationships between size, velocity, and shape of the drops, which is essential for calculating the rainfall rate and parameters related to precipitation microphysics.
In turn, the PARSIVEL is widely used in precipitation studies due to its ability to provide detailed and accurate information on drop sizes and velocities. This instrument measures the drops by interrupting the beam of a horizontally projected laser by the disdrometer [14]. Additionally, rain gauges are essential instruments for measuring the amount of precipitation in a given location, with their records often employed in the calibration and verification of remote rain sensors and weather radars [15], [16], [17].
According to [18], the MWR is an instrument used to measure radiance in the microwave spectrum and thereby estimate some atmospheric parameters such as temperature, humidity, and water vapor. It consists of two radiofrequency subsystems that use brightness temperature observations in channels between 51 and 59 GHz (V band) and between 22 and 30 GHz (K band) to estimate atmospheric vertical profiles of temperature and water, as well as integrated vapor and liquid water contents in the atmosphere up to 10 km vertically.
In the context of this study, near-surface precipitation data originate from the rain gauge and the two disdrometers, while observations of brightness temperature in different channels of the microwave spectrum are from an MWR. It is worth noting that, in this investigation, atmospheric parameters derived from the K band of the MWR were used.
The data were accessed and acquired through a public FTP server provided by the University of São Paulo (USP). After data acquisition, the data underwent a preprocessing and integration process, resulting in a single dataset. The application of the integration technique was crucial since the data were of meteorological nature and collected by different instruments. Given the nature of the time series, it was necessary to ensure the alignment of these data, thus facilitating the necessary analyses.
Next, an Exploratory Data Analysis (EDA) was conducted to investigate and select the best variables to be taken as input in the neural network training process, based on correlation analysis. A correlation matrix was constructed during the EDA, revealing relevant correlations between MWR data attributes and information about the occurrence of rainfall observed by other instruments. In other words, several MWR attributes were well correlated with the target variable, in this case, rainfall events.
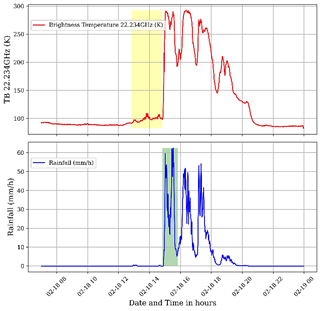
To validate these observations, a case study was conducted with data collected on February 18, 2022. During this study, a significant response of brightness temperature at the 22.234 GHz channel, recorded by the MWR, was observed in relation to water accumulation in the clouds prior to rainfall.
Fig. 2 graphically depicts these data, with the red line representing the time series of brightness temperature (TB) in (K) at the 22.234 GHz channel of the MWR, while the blue line represents the precipitation rate (mm/h) recorded by precipitation sensors. Following these observations, as mentioned earlier, in the exploratory data analysis (EDA) phase, the data were integrated for better handling.
After integrating the data, as illustrated in Fig. 3, a direct analysis of the relationship between changes in brightness temperature and rainfall occurrence becomes evident. Notably, in the highlighted yellow region of the graph, there is a notable increase in temperature (red line) hours before rainfall events (blue line), which recorded a local precipitation rate exceeding 50 millimeters per hour (mm/h). Similar phenomena were also observed on other investigated rainy days. Additionally, other attributes measured by the MWR showed significant correlations with rainfall occurrence; however, only those mentioned earlier were used as input data for model training.
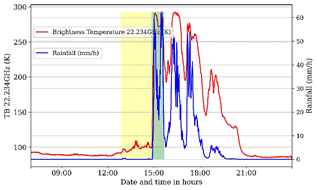
As highlighted by [19], the use of radiometric brightness temperature as an observed parameter is an additional advantage since rainfall initiation is directly related to the presence of saturated water vapor and liquid water in the atmosphere, which is reflected in the increase in brightness temperature at frequencies 23 and 30 GHz [20].
Therefore, harnessing the MWR's ability to measure radiance in the microwave spectrum, particularly through brightness temperature observations in the K band, proved to be fundamental for conducting the investigations.
III. Investigated Scenarios
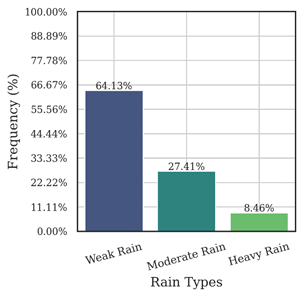
The investigations addressed the imbalance in the samples, emphasizing that the presence of this imbalance in the data can lead to biased estimates for certain types of rainfall. For example, there may be a tendency to favor weaker precipitation events over heavier rainfall, especially considering that heavy precipitation events are less frequent. Fig. 4 displays the unbalanced distribution of rainfall data in the data used, illustrating the disparity in the frequency of different rainfall intensities.
This imbalance in the data can arise from various sources, including differences in the geographical distribution of weather events, seasonal variations in the frequency of different types of rainfall, and even limitations in data collection methods. Therefore, understanding and properly addressing this imbalance is essential to ensure accurate analyses and meaningful insights into weather patterns and rainfall events. In this context, the model was trained, evaluated, and tested in three different scenarios, as detailed below:
A. All occurrences of rain
Dataset containing all instances of observed systems with rainfall rates equal to or greater than 0.1 mm/h (minimum disdrometer rainfall detection) during the observed period. This approach allowed evaluating the model ability to make predictions in a range of scenarios with different rainfall intensities.
B. Imbalance by rainfall intensity
Dataset of defined rainfall rates, ranging from 0.1 to 50 mm/h, distributed as 64.13% for weak rain, 27.41% for moderate rain, and 8.46% for heavy rain. This test allowed us to assess the direct impact of data imbalance on the model predictions, with known data imbalances.
C. Application of adjustments to the weights of less representative samples
The same data from Scenario B were used; however, weights were applied to each sample point in the model training process. Higher weights were applied to less representative samples, following an approach similar to the technique proposed by [21]. This weight adjustment aimed to mitigate the impact of imbalance and investigate how considering rainfall intensity during training influences predictions.
The intensity scale of precipitation is provided in Table I for reference.
| Weak rain | ≥ 0.1 and < 2.5 |
| Moderate rain | ≥ 2.5 and < 10 |
| Heavy rain | ≥ 10 and < 20 |
| Rainstorm | ≥ 20 |
Regarding the neural network used in this study, the approach adopted was similar to that proposed by [22], with adjustments tailored to the context of this investigation. Next, we will briefly describe the architecture defined for the model and the process of assigning weights to the samples.
To calculate the sample weights, an interval-based approach was employed. Initially, all weights were initialized as equal for all samples. Then, three distinct intervals in the target sample values were identified: the majority, the intermediate, and the minority. These intervals were defined based on the values (Table I) of the training data. We assigned differentiated weights to each interval based on a specific calculation function, aiming to enhance the model's performance, especially concerning minority samples.
The structure of the MLP neural network was defined in terms of its layers and corresponding activations. The network consisted of an input layer with a number of neurons equal to the number of input attributes. Two hidden layers are utilized, with 64 and 32 neurons, respectively, both activated by the ReLU (Rectified Linear Unit) activation function. Dropout, a regularization technique, is applied after the first and second hidden layers to prevent overfitting. Finally, an output layer with a single neuron and linear activation is employed to generate predictions.
The analysis of comparisons between actual samples and predictions for 1 hour ahead represents a crucial strategy to investigate the effects of identified imbalances and the model's ability to handle short-term variations. To assess the results, the RMSE and MAE metrics were employed, where RMSE is defined as (1).
Where  represents the total number of observations,
  denotes the i-th actual observation, and
  represents the i-th prediction. The MAE metric calculates the average of the absolute differences between actual observations and predictions, providing a direct measure of the average magnitude of prediction errors, and is given in (2):

Where | | denotes the absolute value of the difference between the actual observation and the corresponding prediction.
Additionally, probabilistic parameters POD (3) and FAR (4) were also applied to examine the correspondence between observed and predicted rainfall rates.
 (3)
(3)

According to [23], these parameters classify events as hits, misses, false positives, or false negatives. These parameters depend on the relationship between hits and misses, where:
a: Number of observed events predicted by the model.
b: Events not observed but were predicted
c: Events observed but the model did not predict.
Additionally, we also have d, which represents events not predicted and that also do not occur but not used in the previous metrics. In the POD parameter, the score of the operation ranges from zero to one, where the maximum value of 1 reflects the most ideal performance, while 0 represents the opposite situation. In turn, the FAR evaluation scale starts from 0 to indicate the most favorable result possible. The combination of these two indices allowed an amplified evaluation of the predictions in each of the tests. The training process of the neural network was carried out with data from the period September 2021 to May 2023 (i.e. a total of 1.793 observations), divided in the proportion of 70% for training, 15% for validation, and 15% for testing.
V. Results And Discussions
In this study, the analysis focused on evaluating the effects of imbalanced data distribution on the prediction of rainfall rate using ANN. It is important to note that the scope of this investigation does not cover the verification of the predictive capacity of the model itself but rather explores the connection between data imbalance and its effects on model efficacy.
We acknowledge that the model has not yet achieved its optimal performance. To conduct this analysis, a series of tests was carried out using distinct datasets, and this allows the observation of how each dataset influenced the prediction outcomes. Fig. 5 presents a comparative analysis of test results in various scenarios, using new data from April 6th, 2023, covering only 12 hours when rainfall events were recorded by precipitation sensors.
These data constitute a sample that was not exposed to the model during the training process. The graph illustrates the discrepancies between the forecasts and the observed values for the specific case.
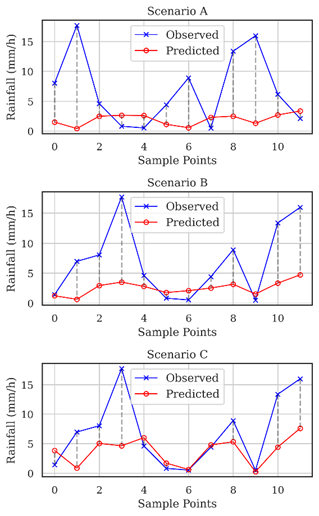
Upon objective analysis of Fig. 5, we emphasize how data imbalances impacted the predictions. This becomes evident when examining the discrepancies in Scenario C, where the differences between the forecasts (red line) and the actual values (blue line) decreased over the analyzed period after applying weights to the samples.
Each point of the red line above the blue points indicates an overestimation, while points below indicate an underestimation. When the lines coincide, it indicates a correct forecast. Notably, after applying weights to the less representative samples, a significant improvement in the predictions of Scenario C was observed, as evidenced by the closer alignment between the red and blue lines.
Additionally, for a more comprehensive assessment of predictions, we turn to scatterplots (Fig. 6), providing a visual representation that establishes the relationship between observed and predicted values. It is worth mentioning that in Fig. 4, the results presented show distinctions between the three tests performed (Scenarios A, B and C).
In the case of Scenario C, in the scatter plot where adjustments were applied to the sample weights based on the intensity of the rain during training, a notable improvement in the dispersion is evident with a notable alignment of the dashed red line with the reference line (black line dashed line) compared to Scenarios A and B.
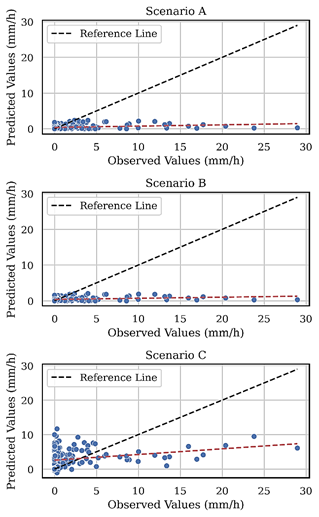
Note that the model showed a better ability to predict more intense rainfall. This suggests that the adjustments made in Scenario C had a positive impact on the forecasts, allowing for a closer alignment between observed and predicted values. We emphasize that in this visual representation of the results, the closer the red line gets to the black line, the better the predictions. Despite the differences in approaches, the results in Scenario C are similar to class balancing techniques, indicating a convergence of performance between these types of strategies. This emphasizes the relevance of including rainfall intensity and balance approaches, reinforcing the search for more accurate and reliable forecasts.
Tables II to V present the results of the metrics applied in the evaluation and the outcomes obtained with the probabilistic parameters used to examine the correspondence between observed and predicted rainfall rates in the investigated scenarios.
| A | Validation data | 2.83 | 7.78 |
| Test data | 2.88 | 7.77 | |
| B | Validation data | 1.30 | 2.59 |
| Test data | 1.31 | 2.65 | |
| C | Validation data | 1.19 | 2.51 |
| Test data | 1.27 | 2.54 |
| Evaluate the model's ability to make predictions in a range of scenarios with varying occurrences of rainfall of different intensities. | Weak rain | 0.70 | 0.30 | Good detection, moderate false alarms |
| Moderate rain | 0.65 | 0.35 | Good detection, moderate false alarms | |
| Heavy rain | 0.39 | 0.61 | Low detection and/or high false alarms | |
| All | 0.41 | 0.24 | Reasonable detection, significant false alarms |
| Evaluate the direct impact of data imbalance on the model's predictions, with the data imbalances previously known. | Weak rain | 0.87 | 0.13 | High detection, low false alarms. |
| Moderate rain | 0.69 | 0.31 | Good detection, moderate false alarms. | |
| Heavy rain | 0.19 | 0.81 | Low detection and/or high false alarms. | |
| All | 0.44 | 0.17 | Reasonable detection, low false alarms. |
| Investigate how considering rainfall intensity during training influences the model's predictions by applying higher weights to less representative samples. | Weak rain | 0.72 | 0.28 | Good detection, moderate false alarms |
| Moderate rain | 0.85 | 0.15 | High detection, low false alarms | |
| Heavy rain | 0.62 | 0.38 | Good detection, moderate false alarms | |
| All | 0.43 | 0.21 | Reasonable detection, low false alarms |
The metrics highlight the impact of data imbalance on predictions. Table 1 shows that in Scenario C, the best results were recorded in terms of MAE and RMSE, while Scenario A reveals the lowest performance. In Scenario C, with the application of weight adjustment to less representative samples, it outperforms both Scenario A and Scenario B.
Although the difference compared to Scenario B is relatively low, the results in Scenario C for validation metrics (MAE: 1.19, RMSE: 2.51) and test metrics (MAE: 1.27, RMSE: 2.4) suggest that the weight adjustment technique may be a good alternative for this type of context.
As presented, it is possible to observe important insights into the model behavior in the three scenarios studied. Scenarios A, B, and C highlight the importance of data representativeness and balance. Scenario A shows limitations in predictions for all types of rainfall but still performs better for lighter rains. Scenario B reveals high detection for both light and moderate rains, but predictions for heavy rains need improvement. In Scenario C, there is a good detection for light and moderate rains, but the detection of heavy rains remains limited, despite improvements compared to previous tests.
V. Conclusions
The prediction of weather events, such as heavy rainfall, has gained global prominence. These events are often linked to natural disasters such as floods and landslides, impacting lives and economies. Accurately forecasting rainfall and its intensity in the short term can minimize risks and damages, proving crucial in sectors such as agriculture and logistics. The results of this study underscored the importance of data balance in the construction and effectiveness of prediction models. The sensitivity of these models to data details highlights the need to consider the representativeness of the data used.
The focus was on evaluating the impact of meteorological data imbalance on rainfall prediction, with the use of data from multiple sensors and Artificial Neural Networks (ANNs). Investigations in three scenarios, related to the imbalance in training and validating the model data, highlighted the importance of data balance for accurate detection and a reduced number of false alarms. Strategies such as adjusting weights on samples proved to be alternatives to enhance rainfall predictions, especially in intense events where imbalance can compromise accuracy. Weighted sampling techniques also proved effective in dealing with imbalances, improving the model performance in the investigated scenario.
References
[1] L. Pires, K. Sušelj, L. Rossato, and J. Teixeira, “Analyses of Shallow Convection over the Amazon Coastal Region Using Satellite Images, Data Observations and Modeling,” Rev. Bras. Meteorol., vol. 33, pp. 366–379, Jun. 2018, doi: 10.1590/0102-7786332009.
[2] M. O. Andreae et al., “The Amazon Tall Tower Observatory (ATTO): overview of pilot measurements on ecosystem ecology, meteorology, trace gases, and aerosols,” Atmospheric Chem. Phys., vol. 15, no. 18, pp. 10723–10776, Sep. 2015, doi: 10.5194/acp-15-10723-2015.
[3] V. A. Costa, “A narrative review of papers developed on the Amazon Tall Tower Observatory experimental site,” Res. Soc. Dev., vol. 10, no. 14, p. e73101421749, Oct. 2021, doi: 10.33448/rsd-v10i14.21749.
[4] W. R. Moninger et al., “Summary of the First Conference on Artificial Intelligence Research in Environmental Sciences (AIRIES),” Bull. Am. Meteorol. Soc., vol. 68, no. 7, pp. 793–800, Jul. 1987.
[5] D. W. McCann, “A Neural Network Short-Term Forecast of Significant Thunderstorms,” Weather Forecast., vol. 7, no. 3, pp. 525–534, Sep. 1992, doi: 10.1175/1520-0434(1992)007<0525:ANNSTF>2.0.CO;2.
[6] A. P. Almeida, “Uso de redes neurais para previsão de descargas elétricas nuvem-solo a partir de dados de radar: Um estudo de caso na Amazônia”, Dissertation (Masters in Applied Computing), National Institute for Space Research, São José dos Campos-SP, Brazil, Sep. 2021.
[7] S. Haykin, Neural Networks: A Comprehensive Foundation (2nd Edition) Neural Networks: A Comprehensive Foundation. 1998.
[8] Z. Basha, N. Bhavana, P. Bhavya, and S. V, Rainfall Prediction using Machine Learning & Deep Learning Techniques. Aug. 2020, p. 97. doi: 10.1109/ICESC48915.2020.9155896.
[9] M. Akkisetti, M. Rajeevan, V. R. Madineni, J. Bhate, and c. v Naidu, “Nowcasting severe convective activity over southeast India using ground-based microwave radiometer observations,” J. Geophys. Res. Atmospheres, vol. 118, pp. 1–13, Jan. 2013, doi: 10.1029/2012JD018174.
[10] M. Darji, V. Dabhi, and H. Prajapati, Rainfall forecasting using neural network: A survey. Jul. 2015. doi: 10.1109/ICACEA.2015.7164782.
[11] A. Maitra and R. Chakraborty, “Rain prediction using radiometric observations at a tropical location,” in 2017 XXXIInd General Assembly and Scientific Symposium of the International Union of Radio Science (URSI GASS), Aug. 2017, pp. 1–4. doi: 10.23919/URSIGASS.2017.8105124.
[12] J. Joss and A. Waldvogel, “Ein Spektrograph fur Niedersch Pagsmessungen mit automatischer Auswertung,” Pure Appl. Geophys., vol. 68, pp. 240–246, Dec. 1967, doi: 10.1007/BF00874898.
[13] C. Caracciolo, F. Prodi, and R. Uijlenhoet, “Comparison between Pludix and impact/optical disdrometers during rainfall measurement campaigns,” Atmospheric Res., vol. 82, pp. 137–163, Nov. 2006, doi: 10.1016/j.atmosres.2005.09.007.
[14] M. Löffler-Mang and J. Joss, “An Optical Disdrometer for Measuring Size and Velocity of Hydrometeors,” J. Atmospheric Ocean. Technol. - J ATMOS OCEAN TECHNOL, vol. 17, Feb. 2000, doi: 10.1175/1520-0426(2000)017<0130:AODFMS>2.0.CO;2.
[15] E. Habib, W. Krajewski, and A. Kruger, “Sampling Errors of Tipping-Bucket Rain Gauge Measurements,” J. Hydrol. Eng., vol. 6, Apr. 2001, doi: 10.1061/(ASCE)1084-0699(2001)6:2(159).
[16] G. Upton and A. R. Rahimi, “On-line detection of errors in tipping-bucket raingauges,” J. Hydrol., vol. 278, pp. 197–212, Jul. 2003, doi: 10.1016/S0022-1694(03)00142-2.
[17] S. Ochoa-Rodriguez, L.-P. Wang, P. Willems, and C. Onof, “A Review of Radar‐Rain Gauge Data Merging Methods and Their Potential for Urban Hydrological Applications,” Water Resour. Res., vol. 55, Aug. 2019, doi: 10.1029/2018WR023332.
[18] Radiometrics Corporation, “MP3000A Profiler Operator’s Manua.” Boulder, CO, USA, 2008.
[19] K. Bhattacharyya and M. Islam, “SHORT TERM RAIN FORECASTING FROM RADIOMETRIC BRIGHTNESS TEMPERATURE DATA,” J. Mech. Contin. Math. Sci., vol. 15, Feb. 2020, doi: 10.26782/jmcms.2020.02.00007.
[20] E. R. Westwater, “The accuracy of water vapor and cloud liquid determination by dual-frequency ground-based microwave radiometry,” Radio Sci., vol. 13, no. 4, pp. 677–685, Aug. 1978, doi: 10.1029/RS013i004p00677.
[21] Y. Chen et al., “Improving the heavy rainfall forecasting using a weighted deep learning model,” Front. Environ. Sci., vol. 11, p. 1116672, Feb. 2023, doi: 10.3389/fenvs.2023.1116672.
[22] L. C. P. Velasco, R. P. Serquiña, M. S. A. Abdul Zamad, B. F. Juanico, and J. C. Lomocso, “Week-ahead Rainfall Forecasting Using Multilayer Perceptron Neural Network” Procedia Comput. Sci., vol. 161, pp. 386–397, Nov. 2019, doi: 10.1016/j.procs.2019.11.137.
[23] R. Levine, “Statistical Methods in the Atmospheric Sciences by Daniel S. Wilks,” J. Am. Stat. Assoc., vol. 95, pp. 344–345, Mar. 2000, doi: 10.2307/2669579.

