Abstract: This article analyzes the use, access, and development of the Information and Communication Technologies (ICTs) in the Ecuadorian manufacturing companies during the period 2012-2014. The theoretical aspects around ICT, its importance, limitations, and challenges are summarized. Furthermore, this manuscript proves the lineal correlation between the total production in the manufacturing sector and the ICT investment, and develops a “log-log” regression model among both variables, which proves the elasticity of the total production with respect to the ICT investment. This document gives conclusions and recommendations for future studies in order to improve the ICT investment in the Ecuadorian manufacturing firms.
Keywords: Information and Communication Technologies (ICTs), Total Production, ICT investment, Ecuador, manufacturing companies, manufacturing sector.
Resumen: Este artículo analiza el uso, acceso, y desarrollo de las Tecnologías de la Información y la Comunicación (TIC) en las empresas manufactureras ecuatorianas durante el período 2012-2014. Este estudio resume los aspectos teóricos en torno a las TIC, su importancia, limitaciones, y desafíos. Además, este manuscrito demuestra la correlación lineal entre la producción total en el sector manufacturero y la inversión en TIC, y desarrolla un modelo de regresión “log-log” entre las dos variables antes descritas., que prueba la elasticidad de la producción total con respecto a la inversión en TIC. Este documento brinda conclusiones y recomendaciones para futuros estudios para mejorar la inversión en TIC en las empresas manufactureras ecuatorianas.
Palabras clave: Tecnologías de la información y la comunicación (TIC), producción total, inversión en TIC, Ecuador, empresas manufactureras, sector manufacturero.
Elasticity of the Total Production measured by the Investment in Information and Communication Technologies: Evidence from the Ecuadorian Manufacturing Companies
Elasticidad de la producción total medido por la inversión en tecnologías de la información y comunicación: Evidencia de las empresas manufactureras ecuatorianas
Received: 05 January 2018
Accepted: 05 April 2018
Corresponding author: ana_b_tulcanaza@kumoh.ac.kr
For an organization or enterprise, information is an essential resource as important as money, machinery and manpower (Satyanarayana, Srinivasu, Rikkula, Sreenivasa, 2009). The opportune information needs to be communicated in different organizational levels, in order to facilitate the decision-making process to the economic agents. Information and Communication Technologies (ICTs) covers the aforementioned field.
ICTs refer to technologies that provide access to information through telecommunication services. The terminology is similar to Information Technology (IT), but ICTs focus primarily on communication technologies and infrastructure. It includes the Internet, wireless networks, cell phones, networking components, applications and all other electronic communication devices (TechTerms, 2017).
Some ICT studies have been developed in the recent years. For example, Fabiani, Schivardi and Trento (2005) used a survey of 1500 manufacturing firms interviewed in 2001, to supervise the ICT investment in Italy. Their results indicate that the ICT adoption tends to be associated with changes in the organizational structure of a company, where the firm-specific variables are size, human capital, and the presence of large companies in the local environment.
Neu and Brown (2008) isolated and characterized the organizational factors to carry out high-performance business services in manufacturing firms. This study conducted 32 depth interviews for 11 different managers from Global 100 information technology manufacturing firms, and their findings demonstrate that the ICT investment is the result of the manager’s ability to create internal alignment among several organizational factors which fit the market conditions.
Giuri, Torrisi and Zinovyeva (2008) examine the complementarity between ICT, skills and the organizational change from a panel of 680 Italian manufacturing companies during 1995-2003. They found a reciprocal relationship among skills and organizational change, and their results show that the hypothesis of total complementarity between ICT, human capital, and organizational change does not apply to small and medium firms. A study conducted by Gallego and Gutierrez (2015) considers the adoption and use of ICT by 3759 Colombian manufacturing firms. They concluded that companies that face competition in overseas markets are more likely to adopt ICT, and three main factors are complementary to the adoption of ICT by companies: human capital, organizational changes, and innovation results.
The Business Process Improvements (BPI) through ICT’s infrastructure capabilities show that IT and business leadership expands the IT governance and establishes a direct relationship between the Chief Executive Officer (CEO) and the Chief Information Officer (CIO) (Law & Ngai, 2007). In addition, most of the global companies accept the challenges of globalization where competitiveness is a factor of successful results, accompanied by a closer business-government partnership, an effective network of national agencies involved in the value chain and the optimal use of new technologies (Badrinath, 2004).
In this context, the general objective of this article is to demonstrate the linear correlation and elasticity between the total production and the ICT investment in the main Ecuadorian manufacturing firms. The specific objectives aim to understand the importance and the influence of ICTs in the global world, evaluating the actual situation of ICT in the Ecuadorian manufacturing companies, and identifying their main variables.
-
Hypothesis 1: Positive correlation between the logarithms of the ICT investment and the total production.
-
Hypothesis 2: Positive elasticity of the total production with respect to the ICT investment.
The breakdown is composed by four sections. The first one presents a deep literature review which refers to the theoretical framework through ICT. The second section explains the methodology of this study. The third part describes the empirical analysis of the ICT usage in the Ecuadorian manufacturing companies. Finally, the last part covers conclusions and recommendations for future research.
ICT has been used by academic researchers since the 1980s (Melody, Mansell, & Richards, 1986), and its abbreviation became popular after it was used in a report to the UK government by Dennis Stevenson in 1997 (The Independent ICT in Schools Commission, 1997). ICT has no universal definition, as the concepts, methods, and applications involved in ICT are constantly evolving on an almost daily basis. This approach contributes to the fact that the skills framework for the information age, are playing an important role in many models to describe and manage competencies for the ICT professionals in the 21st century (IEEE Computer Society, 2016).
ICT is an umbrella term used to encompass all rapidly emerging, evolving, and converging computer software, networking, telecommunications, Internet, programming, and information systems technologies (University of Kentucky, 2017). Historically, many of these fields were developed separately in different companies, departments and Research and Development (R&D) groups. Nowadays, all of these systems are combined and allow people and firms to interact in the digital world using organizational strategic operations in order to improve the user competencies.
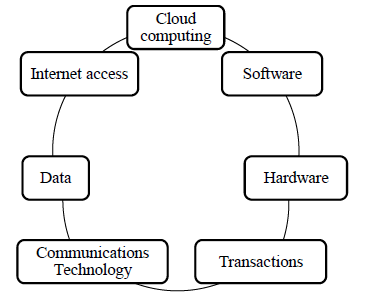
ICT involves both the Internet known as enabled sphere and the mobile domain, which works with wireless networks. It has also been used to describe the convergence of several techniques and the use of common transmission lines carrying diverse data and communication types and formats. The list of the ICT components is exhaustive due to the technology’s progress (Figure 1).
ICT offers accurate and opportune information for the managerial activities in an organization in order to help and facilitate the decision-making process, which improves the effectiveness of different stages in a company as planning, control, operation, implementation, and evaluation. ICT transforms and processes data into information, which is communicated to diverse departments in an organization. This transmission needs to be efficient and effective between sections to guarantee the quality of information. Each department chooses these inputs to generate reports and suggestions to managers, who demand available information anytime, which is provided by information system mechanisms.
On the other hand, managers cannot integrate masses of data and transform it into useful information, due to this process takes a lot of time and effort. They only need to consume productive information and make decisions aligned to the business and company objectives. In order to solve this problem, the ICT usage saves valuable time, reduces workforce and employees do not have to collect or extract data manually (raw data). As a substitute, this information is uploaded and presented by new communication capabilities, which are created by a “global village”, where people can communicate with others across the world as if they were living in the next door.
The ICT’s economic and social impact can be evaluated by how people have changed their daily personal and work life around the recent years, and how all the processes are automatized in order to get effective results. ICTs have become efficient, productive and competitive tools for companies, and most of the countries have recognized the importance of their implementation in the productive sectors. The importance of ICT has been so monumental for the economic development and business growth, that has been labeled as the Fourth Industrial Revolution (TechTarget, 2016), accompanied by the Digital Area and the Big Data Revolution using cut costs in automated business procedures.
The World Bank (World Bank Group, 2016) found that more than 75% of people around the world accesses to a cellphone. However, the Internet access remains exorbitantly expensive in many countries due to the lack of the ICT infrastructure. In this study, the global population was estimated of 7.4 billion people and more than 4 billion do not access to the Internet. For these reasons, the World Bank, various governmental and non-governmental authorities and organizations promote policies and programs focus on
greater access to the ICT tools for population. Furthermore, the United Nations considers as one of its Sustainable Development Goals (SDG) the “significantly increase access to information and communications technology and strive to provide universal and affordable access to the Internet in least developed countries by 2020” (The Global Goals, 2016). Conversely, some authors proved that the ICT tools have generated difficulties and challenges to organizations and individuals, due to the global increase of network crime levels, the developing of systems to steal money, and breakdowns to the private information and the intellectual property. Moreover, most of the ICT processes rise the automation through robots, which displace workers in their professional activities and limit people interactions with others.
Some previous studies as Bloom, Garicano, Sadun and Van Reenen (2009) show theoretically and empirically that ICT, conformed by information and communication components, has different effects on the employee empowerment and consequently on the wage inequality and reduction of the communication costs. Their study uses an original dataset of firms in the US and seven European countries. They concluded that better information technologies are associated with more autonomy and control. By contrast, communication technologies, including data networks, decrease autonomy of the human capital (workers and plant managers) in a company. Kretschmer (2015) gives an overview of the vast empirical literature on ICT and productivity. The empirical study demonstrates that the productivity effect is not only significant and positive, but also it increases over time when ICT is embedded in complementary organizational investments. The most important ICT studies are summarized in Table 1.
Main studies of ICT, organized in chronological order.
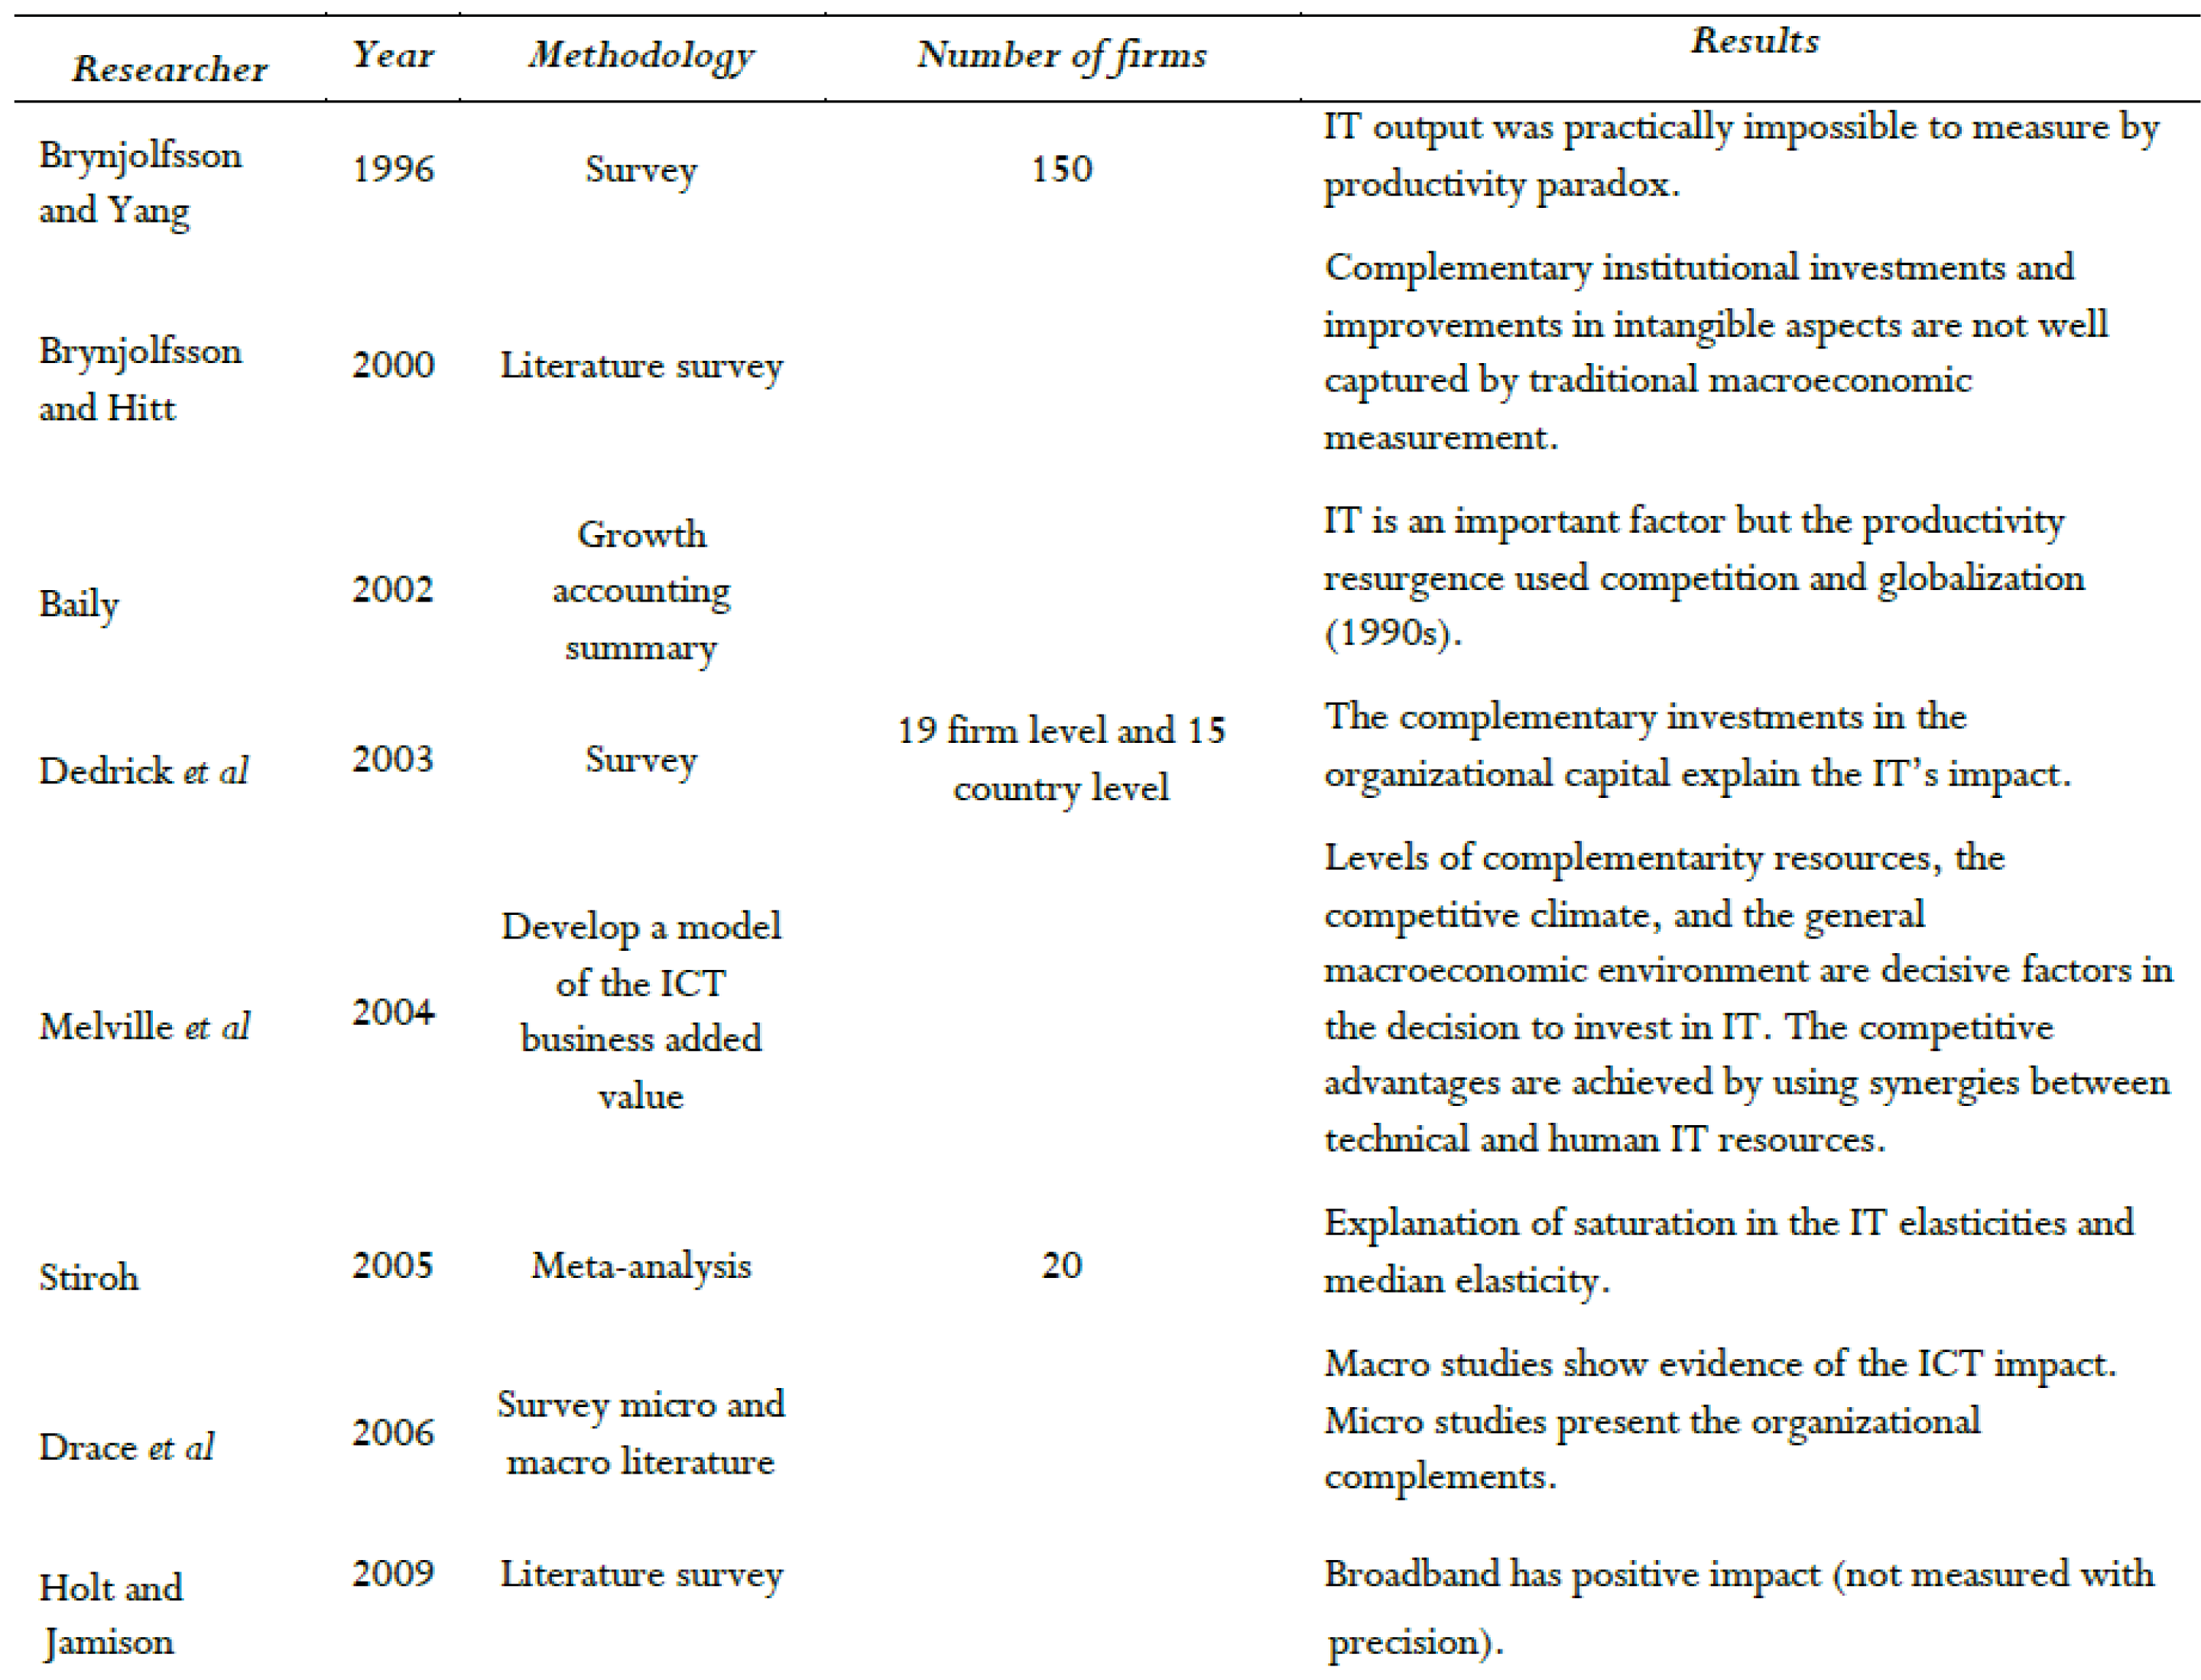
Authors, and Kretschmer Tobias “Information and Communication Technologies and Productivity Growth – A Survey of the Literature”Note: Continued on next table
Main studies of ICT, organized in chronological order (continued).
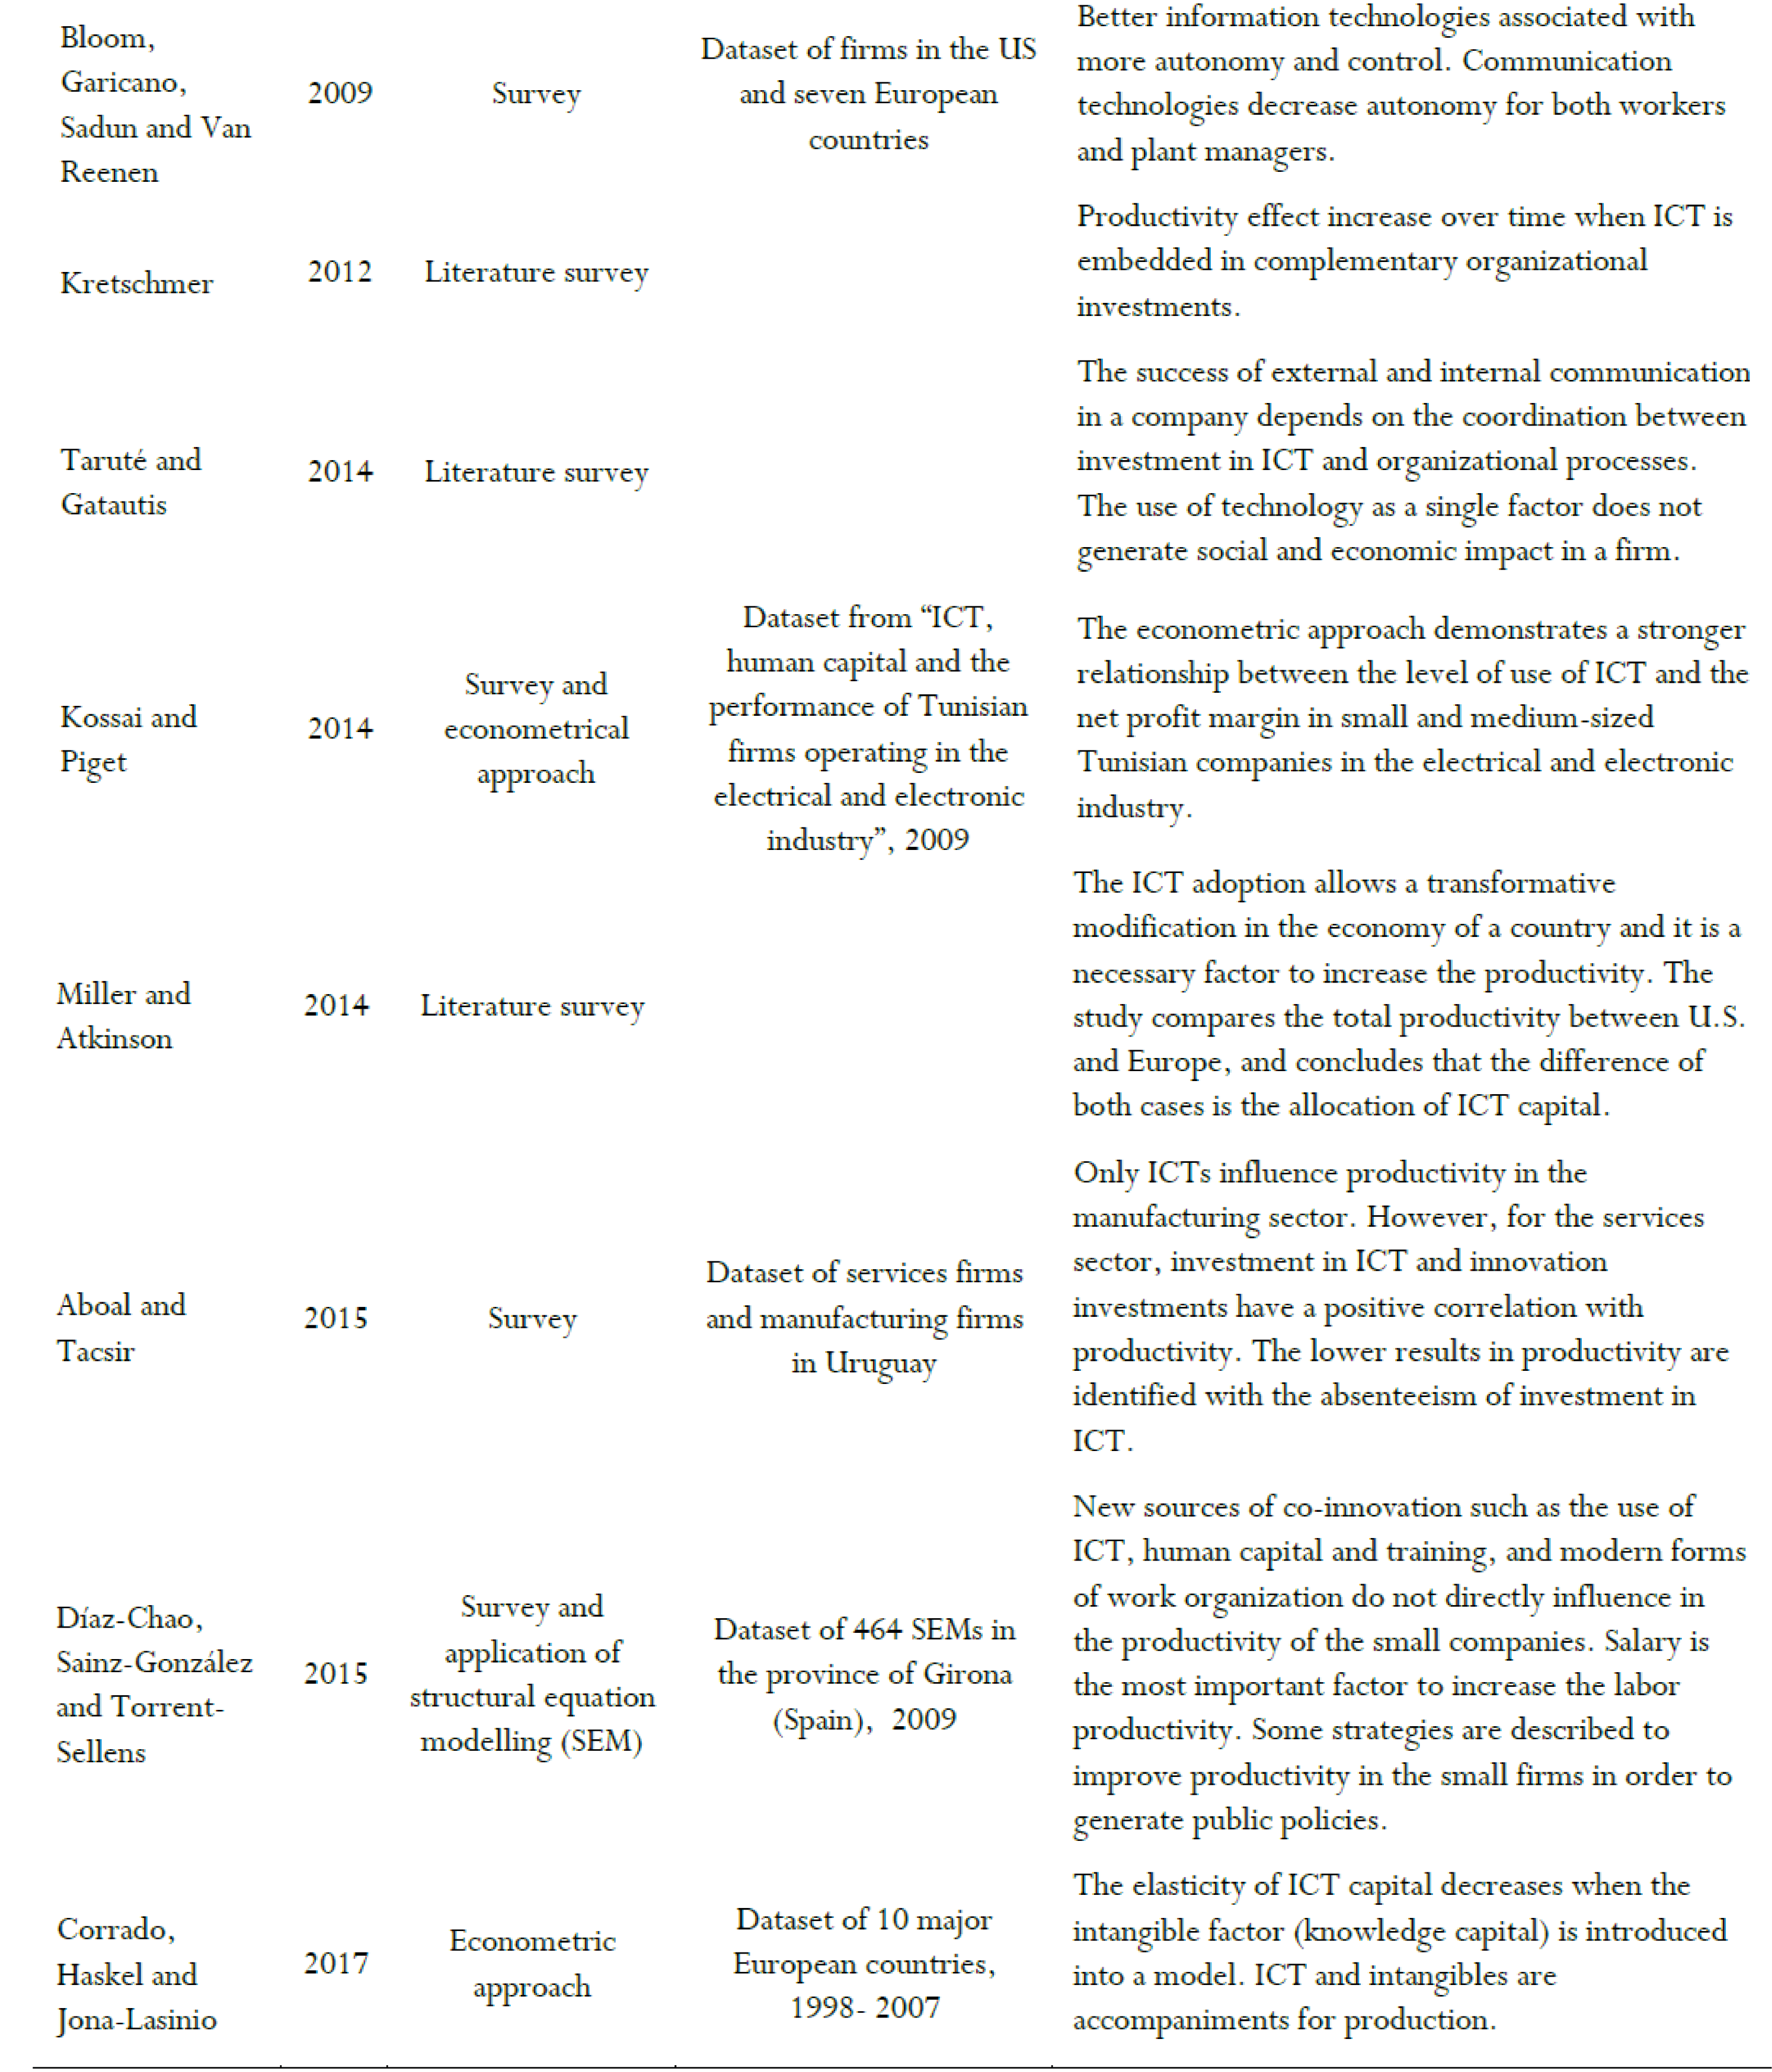
Authors, and Kretschmer Tobias “Information and Communication Technologies and Productivity Growth – A Survey of the Literature”
The theoretical framework shows that many ICT studies has been developed in recent years, and most of them are associated with the productivity factor in companies. However, there is no previous evidence that ICT has been studied for Ecuadorian manufacturing sector.
The information sources for this study are: (1) the ICT module developed by the National Institute of Statistics and Censuses (Instituto Nacional de Estadística y Censos, INEC) through the Manufacturing, Mining, Internal Commerce and Services Survey for 2012-2014, (2) data from the ICT Observatory from the Ecuadorian Ministry of Telecommunications and Information Society (Ministerio de Telecomunicaciones y de la Sociedad de la Información, Mintel), and (3) the manufacturing and mining survey from 2012-2014, constructed by INEC.
INEC and Mintel developed the ICT module through the industrial surveys for the Ecuadorian firms of Manufacturing, Mining, Internal Commerce and Service Sector for 2012-2014. The questions, variables and indicators were formulated using the “Compendium of practices on the ICT question implementation in business surveys” (Economic Commision for Latin America and the Caribbean [ECLAC], 2013).
The survey was applied for companies that had five or more employees. The sectors analyzed are: B (Mining), C (Manufacturing), G (Commerce) and E, I, J, K, L, M, N, Q, R and S (Services) according to the International Classification of Economic Activities (ISIC) Review 4.0. This study only refers to the manufacturing companies. Furthermore, the correlation coefficients between variables will be calculated to demonstrate the relationship between the ICT investment and the total production in the Ecuadorian manufacturing sector.
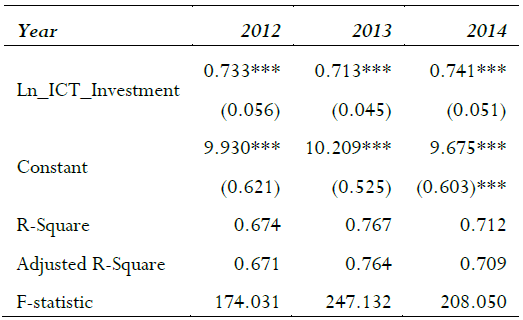
A “Log-Log” regression between the ICT investment and the total production is performed using the Ordinary Least Square (OLS) method. Logarithms are applied in these variables to stabilize their variance during the studied period. The ICT investment and the total production trends (original and logarithmic trends) are visualized in Appendix 1.
The data panel analysis could not be carried out as a statistical technique because the surveyed firms were dissimilar during the analyzed period, and the weight of the size of manufacturing companies did not remain in the studied period (the representativeness of the firms is not constant, especially in the “microenterprises” category, for more details refer to Table 3).
The number of manufacturing companies investigated is 1,368 (2012), 1,336 (2013) and 1,310 (2014) compared to the total number of firms studied, amounting to 4,128 (2012), 3,921 (2013) and 3,777 (2014). Manufacturing companies represent 33.1%, 34.1% and 34.7% for each year (Table 2).
Number of surveyed firms per economic sector
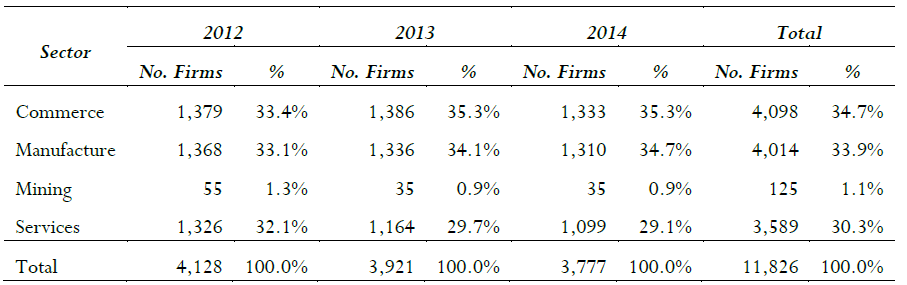
INEC and Mintel
The manufacturing companies are classified according to their size in: big, medium B, medium A, small and microenterprise. The size of companies is defined by INEC using variables such as the annual sales (S) and the number of employees (E). This distribution is: (a) big: S≥US$5,000,001 and E≥200, (b) medium B: US$2,000,001≤S≤US$5,000,000 and 100≤E≤199, (c) medium A: US$1,000,001≤S≤US$2,000,000 and 50≤E≤99, (d) small: US$100,001≤S≤US$1,000,000 and 10≤E≤49 and (e) microenterprise: S≤US$100,000 and 1≤E≤9 (INEC, 2014).
The category of big companies is the most representative during 2012-2014, its average contribution is 38.5% while the small companies symbolize 27.8%. The big, medium B and small firms represent on average 93.6% of the total sample during the analyzed period. The microenterprises do not record their information during 2012 and 2013 because the statistical sample is not representative of the study according to the Manufacturing, Mining, Internal Commerce and Services Survey (Table 3).
Number of manufacturing firms per size
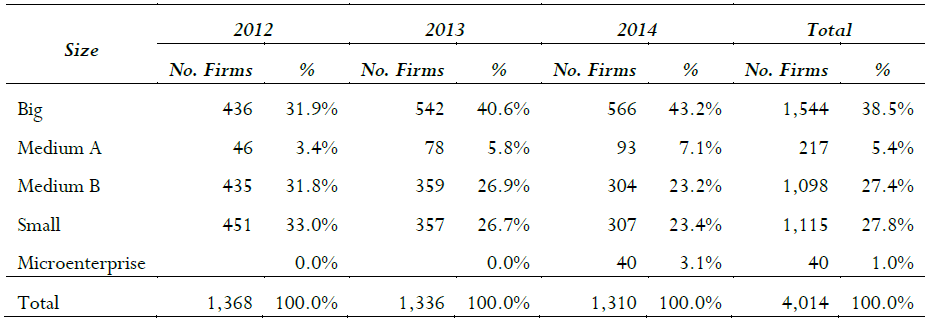
INEC and Mintel
The investment in ICT in the manufacturing companies -refers to disbursements to buy physical devices, software or computer applications- was US$ 39.6 million during 2012. It increased in 54.9% until 2014 (US$ 61.4 million). The big companies show a similar trend compared to the total manufacturing firms, their ICT investment varies between US$ 36.5 million (2012) to US$ 59.4 million (2014). On the other hand, the ICT investment for medium A, medium B, and small firms decreased by 36.8% from US$ 3.1 million to US$ 1.9 million during 2012-2014. The highest reduction (-33.1%) in the ICT investment occurs in medium B firms, changing from US$ 2.5 million (2012) to US$ 1.7 million (2014) (Figure 2).
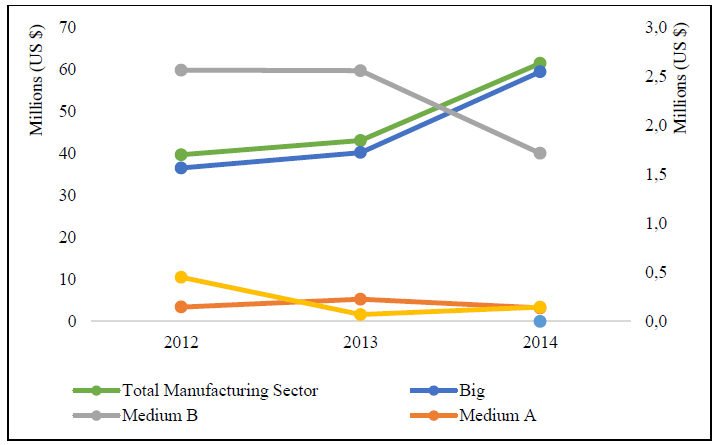
Figure 2
ICT investment in manufacturing firms per size
Notes: Primary axis (series) corresponds to total manufacturing sector and big firms. Secondary axis (series) refers to medium B, medium A, small and microenterprise firms.
INEC and MintelReferring to holding technological devices in manufacturing companies - number of desktops or laptops, Personal Digital Assistant (PDA), smartphones, tablets, and other devices (projectors, printers, etc.) used by companies to carry out their economic activities, the manufacturing firms can own several types of devices, the answers are not exclusive-, 98.9% of them used computers in their economic activities during 2012, while the percentage was reduced to 97.3% in 2014. On the other hand, smartphones are needed by the manufacturing firms showing an increase between 11.7% (2012) to 16.8% (2014), similar to the possession of tablets, growing up from 9.6% (2012) to 13.1% (2014) (Figure 3).
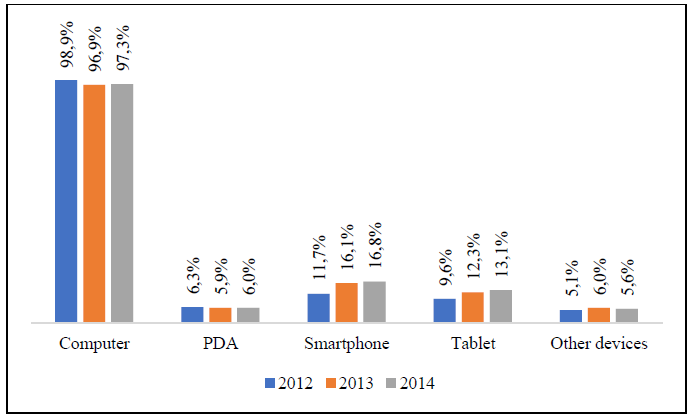
Figure 3
Holding technological devices in manufacturing firms
INEC and Mintel.
The number of devices used by manufacturing companies to develop their economic activities has been maintained during the studied period, varying by 1.1% (from 1,800 to 1,819 technological devices during 2012 and 2014, respectively). In 2014, 70.1% of the total possession of technological devices corresponds to computers, while 12.1% are smartphones and 17.8% represent other devices (grouped: PDA, tablet and other devices) (Figure 4).
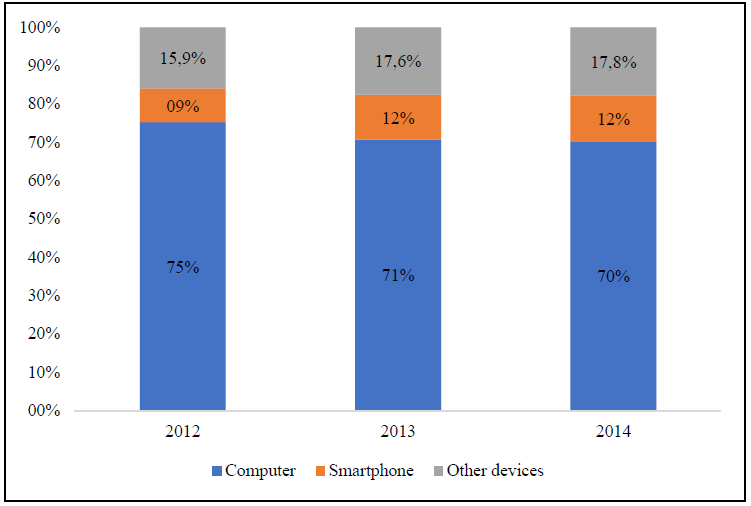
Figure 4
Holding technological devices in manufacturing firms (Percentage of technological devices)
INEC and Mintel
Internet access in manufacturing companies has remained constant during 2012-2014. The percentage of the total number of companies with an Internet connection was 96.8% (2012), 95.7% (2013) and 96.2% (2014) (Figure 5). On the other hand, the distribution of manufacturing firms that access to Internet according to their size is: 42.8% (big companies), 22.9% (medium B firms), 21.5% (small companies), 6.9% (medium A firms) and 2.1% (microenterprise) in 2014.
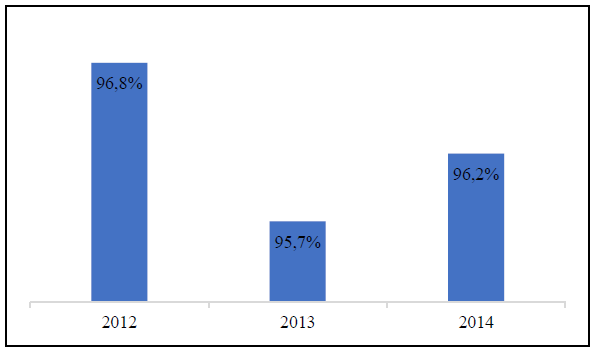
Figure 5
Percentage of manufacturing firms with Internet access
INEC and Mintel
In the manufacturing companies (with Internet access), the most widely used type of Internet connection (companies can use several types of connection, the answer is not exclusive) is the fixed broadband with an average of 94.5% during 2012-2014, while 13.5% of firms work with mobile broadband and 4.0% with another type of connection (includes narrow band) (Figure 6).
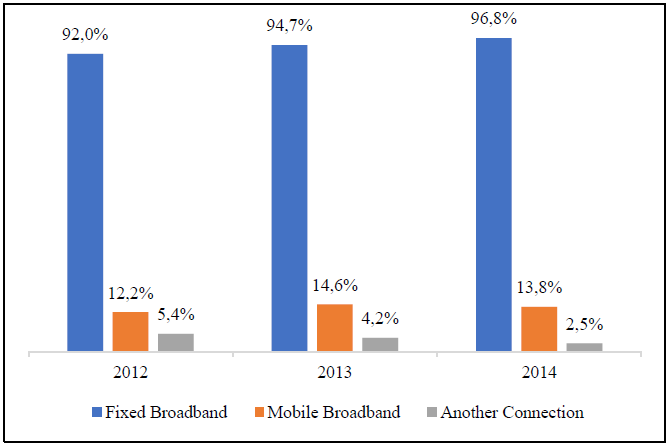
Figure 6.
Types of Internet connection (Percentage of manufacturing firms with Internet access)
INEC and Mintel
On average, 13.9% of the total manufacturing companies use the Internet to make purchases, while 8.2% of firms cover their sales by the Internet during 2012-2014. However, there is a significant reduction in the number of manufacturing companies that make purchases and sales, 11.0% and 12.9%, respectively (Figure 7).
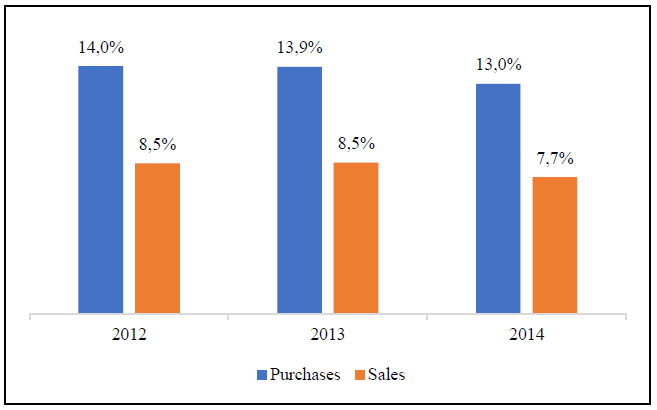
Figure 7
Percentage of manufacturing firms that carries out commercial transactions over the Internet
INEC and Mintel
Most of the manufacturing surveyed companies employed cellphones and emails as media for their businesses (companies can have several types of media, the answer is not exclusive, and the “Others” category includes: specialized messaging, call center, virtual mailboxes and unified communications). For example, in 2012, 96.7% and 95.9% of the manufacturing companies used these categories as communication channels, while during 2014, these percentages changed to 97.5% and 95.4%, respectively (Figure 8).
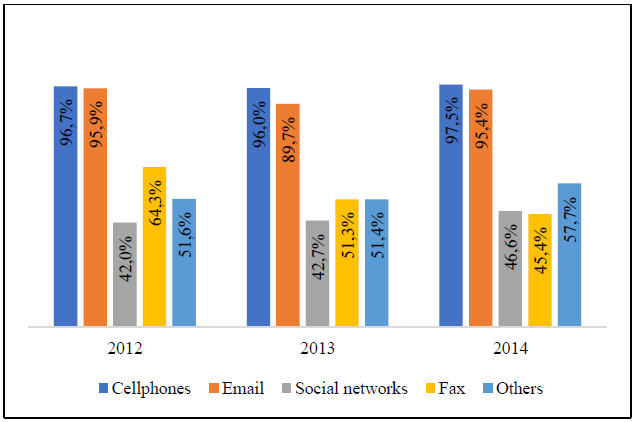
Figure 8
Media usage (Percentage of manufacturing firms)
INEC and Mintel
In 2012, all the manufacturing companies (with Internet access) used Internet browsers -the most popular free browsers are: Mozilla Firefox, Opera, Google Chrome, and Netscape- while 26.1% of them employed operating systems -the most popular operating systems are: GNU/Linux, GNU/Hurd, GNU/Darwin, OpenBSD, FreeBSD, NetBSD, and SO3-, 25.2% office automation application (Open Office) and 17.7% other kind of open source software (includes open source application and software security). During 2014, it is evident that the categories of operating system, office automation application and others showed a rapid increase to 40.0%, 61.7% and 35.5%, respectively (Figure 9).
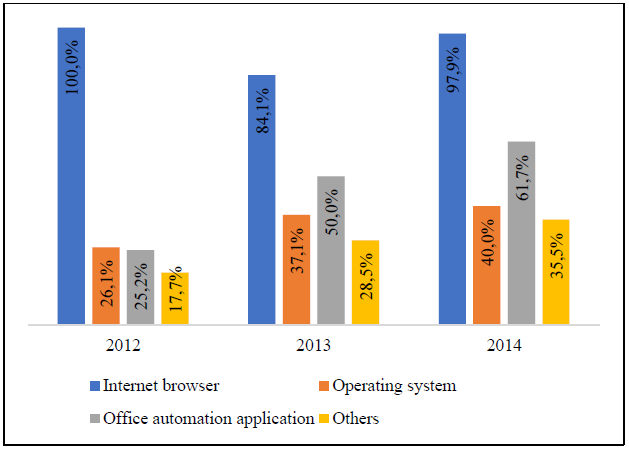
Figure 9.
Types of open sources software (Percentage of manufacturing firms)
INEC and Mintel
The human resources in manufacturing companies are not highly trained in ICT because only the third part of the manufacturing firms owned the ICT specialists during 2012. In 2014, the percentage decreased to 28.9%. Regarding the gender of the ICT specialist, 67.5% are men and 32.5% are women (2014) (Figure 10).
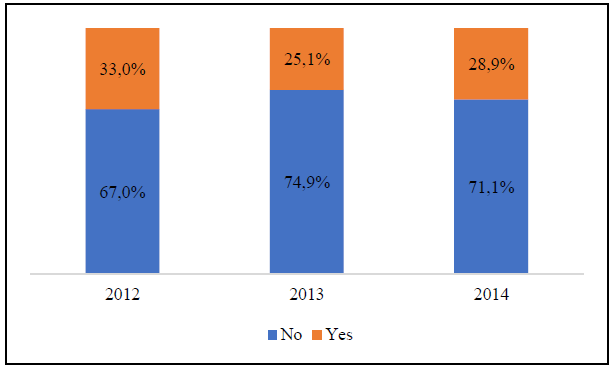
Figure 10.
Percentage of manufacturing firms with ICT specialists
INEC and Mintel
On the other hand, the manufacturing and mining survey shows 114 manufacturing subsectors (ISIC Review 4.0) during 2012-2014, and the total number of observations is 302. Furthermore, a ratio (ICT_vs_Production) of the ICT investment and the total production was created in order to understand the relationship between both variables. In addition, a natural logarithmic transformation was applied for the series of the ICT investment (Ln_ICT_Investment) and the total production (Ln_Total_Production), to reduce their standard deviation and stabilize the variance in both trends. In Appendix 1 (literals c, and d),
the distribution of natural logarithmic series proves that the transformation adjusted better (straight line for the linear regression model) than the original series.
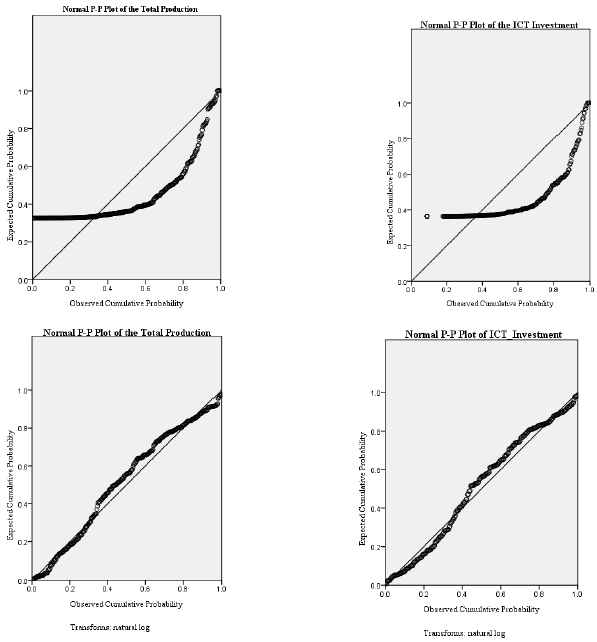
The standard deviation for the total production and the ICT investment is large because both series present extreme values, dispersion of data (data points are spread out over a wider range of values), and their mean is not enough characterized for all the surveyed companies. In addition, the dispersion depends on the economic resources invested in ICT per size of company. For instance, the big companies represent in average 94.4% of the total ICT investment in the manufacturing sector, while small firms and microenterprises contribute with 0.5% of the total ICT investment. Moreover, firms considered as big, medium A and medium B, suggest a 72.2% of the total production in the manufacturing sector; while small companies and microenterprises signify 27.8% of the total. In Appendix 2, histograms for the total production and the ICT investment are presented. The main statistics are shown below (Table 4).
Statistics from manufacturing survey
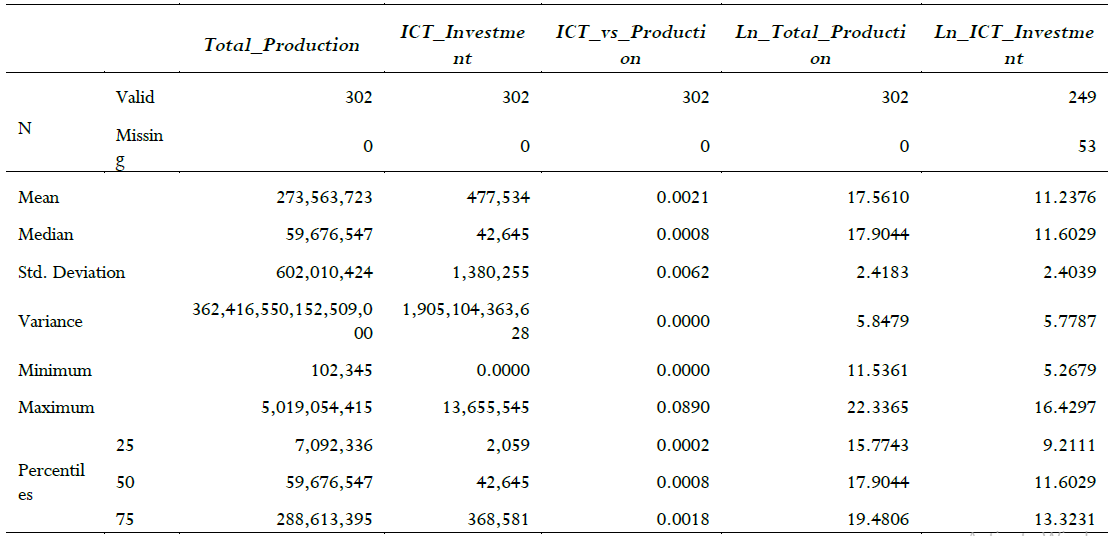
INEC
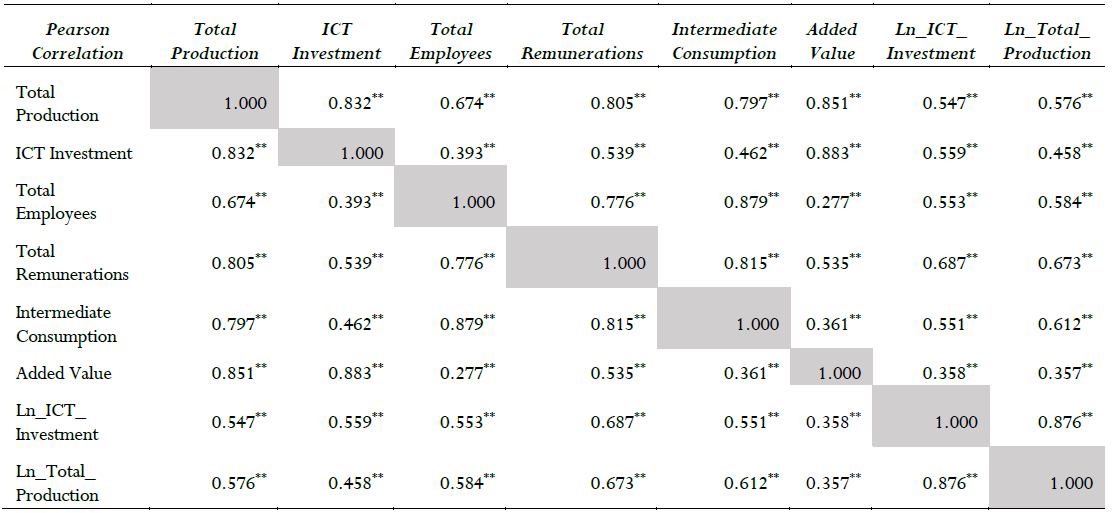
The variables of the manufacturing and mining survey (2012-2014) occupied in this study are: total production, ICT investment, total employees, total remunerations, intermediate consumption, added value, Ln_ICT_Investment, and Ln_Total_Production. The linear correlations between variables for 2012, 2013 and 2014 are shown below (Table 5, Table 6 and Table 7).
Linear correlation between variables from manufacturing survey, 2012
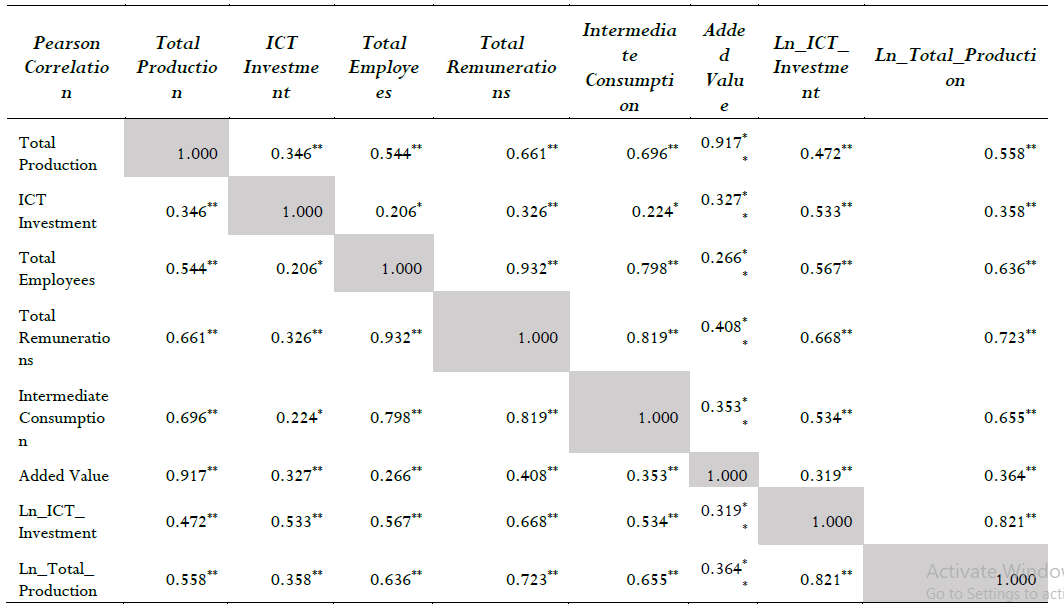
INECNotes: Significance level: * p<0.1, ** p< 0.05, *** p<0.01. Number of observations: 97
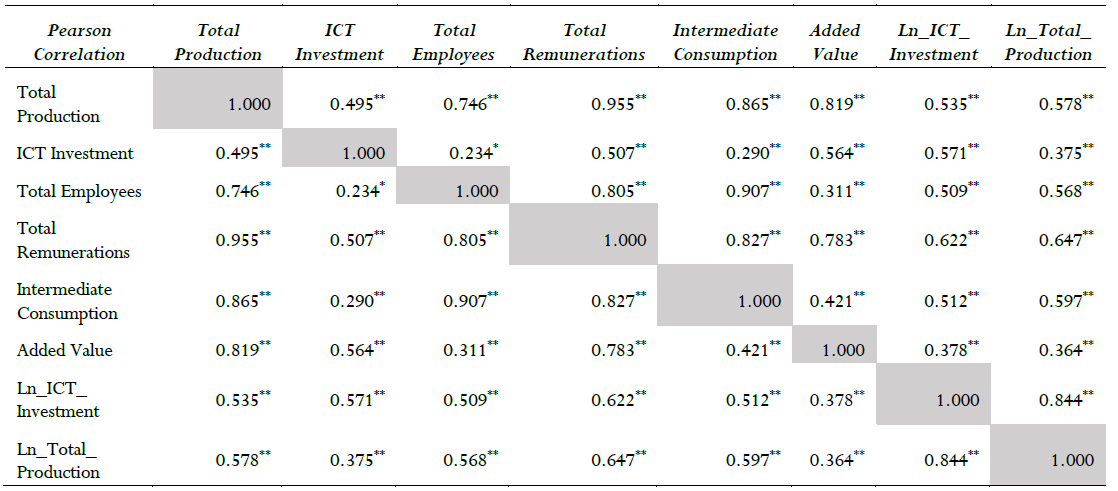
Linear correlation between variables from manufacturing survey, 2013
INECNotes: Significance level: * p<0.1, ** p< 0.05, *** p<0.01. Number of observations: 102
Linear correlation between variables from manufacturing survey, 2014
INECNotes: Significance level: * p<0.1, ** p< 0.05, *** p<0.01. Number of observations: 103
This study exclusively analyzes the relationship between the ICT investment and the total production. Thus, the correlation between Ln_ICT_Investment and all the variables is significant at least at 0.05 level. The highest correlation coefficient is presented between the Ln_ICT_Investment and Ln_Total_Production variable, while the lowest correlation coefficient is between Ln_ICT_Investment and added value. The correlation coefficients are summarized below (Table 8).
Correlation coefficients between Ln_ICT_Investment and variables from manufacturing survey, 2012-2014
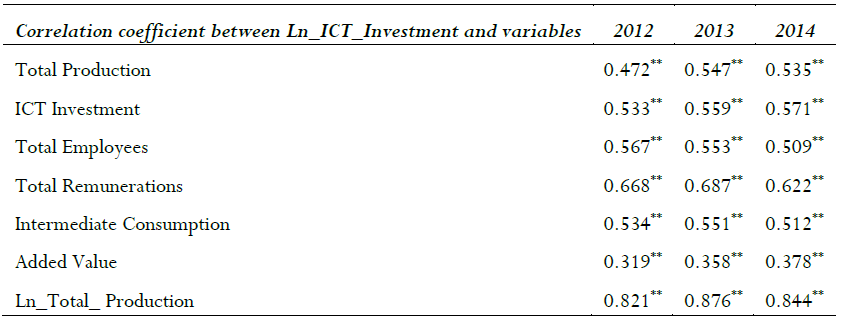
INECNotes Significance level: * p<0.1, ** p< 0.05, *** p<0.01
Hypothesis 1: Positive correlation between the logarithms of the ICT investment and the total production.
The results reflect a direct positive correlation between Ln_ICT_Investment and Ln_Total_Production in the manufacturing sector. The coefficients are significant at 0.05 level, being: 0.821 (2012), 0.876 (2013) and 0.844 (2014). For example, the relationship is positive at 84.4% in 2014, which means that one variable goes up or down as well as the other. The ICT investment (original variable) depends on the total production (original variable), and the highest relationship is presented in the year 2013.
Hypothesis 2: Positive elasticity of the total production with respect to the ICT investment.
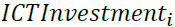
The OLS method is employed using a “Log-Log” model. This model is performed because the nonlinearity evidence in parameters between the studied variables (the ICT investment and the total production) (see Appendix 1). The log transformation generates the desired linearity in parameters, which is one of the OLS assumptions, and the interpretation of the regression coefficients is straightforward. The coefficients in a “Log-Log” model represents the elasticity of the variable Y with respect to X. In order words, the coefficient is the estimated percentage change in the dependent variable, for every percentage change in the independent variable. In addition, the highest correlation coefficients between Ln_ICT_Investment and Ln_Total_Production is another strong argument to employ this model. The “Log-Log” regression is determined as follows (Equation 1):
 (1)
(1)
-
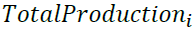 : Total production of firm i, i=1,…,n; n2012=97, n2013=102, and n2014=103.
 -
 : ICT investment of firm i, i=1,…,n; n2012=97, n2013=102, and n2014=103.
 -
: Intercept.
-
: Measure of elasticity.
-
: Error term.
The results for the “Log-Log” regression analysis are shown below (Table 9). The results revealed are statistically significant, at least with p-value < 0.05. The highest elasticity is shown during 2014 (β1=0.741). The coefficient of determination (R-squared), which is a measure of how well a model explains and predicts future outcomes, is representative (more than 0.5), meaning that the total production is mostly explained by the ICT investment.
Log-Log regression models between ICT investment (independent variable) and total production (dependent variable) from manufacturing survey
INECNotes Significance level: * p<0.1, ** p< 0.05, *** p<0.01.
For instance, the elasticity for 2014 is 0.741, consequently a 1 percentage increase in the ICT investment is associated with a 0.741 percentage growth in the total production of the manufacturing companies, on average. Furthermore, 71.2% of the variation of total production is explained by this model.
ICT is an umbrella term used to cover all technologies in order to broadcast, process, and share information instantaneously. ICT tools are considered the basis for reducing the digital gap in a country and building the information society. Consequently, ICTs have become efficient, productive and competitive tools for modern companies. The economic and social impact of ICT can be evaluated by how people have changed their daily personal and work life in recent years, and how all the processes are automatized to obtain effective results.
The evidence from this study points to the idea that there is a relationship between the ICT investment and the total production. The findings of this document are in line with the previous results, even when there is no precedence evidence in the Ecuadorian economic sectors. However, the limitations of this research are: (1)the statistical information does not cover the same companies per year, each survey contains different representatives (which is not clearly defined by INEC), (2) some questions in the survey use the category “do not report” and the loss of data equals 15% of the total database; and (3) the “microenterprises” category is not represented in the survey during 2012-2013 period.
This manuscript confirms hypothesis 1 and 2, demonstrating a positive direct correlation between the logarithms of the ICT investment and the total production in the Ecuadorian manufacturing sector. The correlation coefficients are significant at least at 0.05 level, which are: 0.821 (2012), 0.876 (2013), and 0.844 (2014). In addition, a “Log-Log” regression model per year is performed between both variables, and the results are powerful (at least at 0.05 level) to prove a positive elasticity of the total production with respect to the ICT investment.
This paper aims at sensitizing Ecuadorian manufacturers on the use of ICT to increase their productivity, which is a key factor in achieving competitive vision in a global environment. In addition, the Ecuadorian government can generate public policies to promote the ICT management in different economic sectors to reduce costs and improve the basis for strategic decision-making and risk administration.
A similar methodology can be adopted to future studies for different economic sectors in order to compare the correlation coefficients between the ICT investment and the total production. For further research, we strongly recommend to use panel data techniques to reduce possible biases on the estimated coefficients. Furthermore, panel data takes into account the individual heterogeneity, allowing to control variables that are not either observable or measurable in business practices across companies, or variables that change over time but not across entities. Panel data usually contains more degrees of freedom and more sample variability, which is appropriate to infer into the model parameters.
Appendix 1.
Distribution of the main variables (a)Total production (original series), (b) ICT investment (original series), (c) Total production (with natural logarithmic transformation) and (d) ICT investment (with natural logarithmic transformation)
INEC
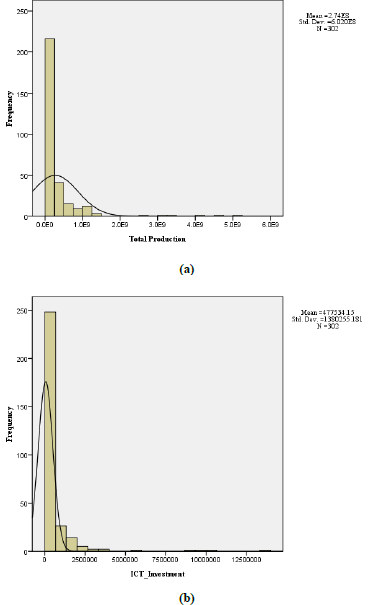
Appendix 2.
Histograms of the main variables: (a) Total production, (b) ICT investment
INEC
ana_b_tulcanaza@kumoh.ac.kr
Main studies of ICT, organized in chronological order.
Authors, and Kretschmer Tobias “Information and Communication Technologies and Productivity Growth – A Survey of the Literature”Note: Continued on next table
Main studies of ICT, organized in chronological order (continued).
Authors, and Kretschmer Tobias “Information and Communication Technologies and Productivity Growth – A Survey of the Literature”
Number of surveyed firms per economic sector
INEC and Mintel
Number of manufacturing firms per size
INEC and Mintel
Figure 2
ICT investment in manufacturing firms per size
Notes: Primary axis (series) corresponds to total manufacturing sector and big firms. Secondary axis (series) refers to medium B, medium A, small and microenterprise firms.
INEC and MintelFigure 3
Holding technological devices in manufacturing firms
INEC and Mintel.
Figure 4
Holding technological devices in manufacturing firms (Percentage of technological devices)
INEC and Mintel
Figure 5
Percentage of manufacturing firms with Internet access
INEC and Mintel
Figure 6.
Types of Internet connection (Percentage of manufacturing firms with Internet access)
INEC and Mintel
Figure 7
Percentage of manufacturing firms that carries out commercial transactions over the Internet
INEC and Mintel
Figure 8
Media usage (Percentage of manufacturing firms)
INEC and Mintel
Figure 9.
Types of open sources software (Percentage of manufacturing firms)
INEC and Mintel
Figure 10.
Percentage of manufacturing firms with ICT specialists
INEC and Mintel
Statistics from manufacturing survey
INEC
Linear correlation between variables from manufacturing survey, 2012
INECNotes: Significance level: * p<0.1, ** p< 0.05, *** p<0.01. Number of observations: 97
Linear correlation between variables from manufacturing survey, 2013
INECNotes: Significance level: * p<0.1, ** p< 0.05, *** p<0.01. Number of observations: 102
Linear correlation between variables from manufacturing survey, 2014
INECNotes: Significance level: * p<0.1, ** p< 0.05, *** p<0.01. Number of observations: 103
Correlation coefficients between Ln_ICT_Investment and variables from manufacturing survey, 2012-2014
INECNotes Significance level: * p<0.1, ** p< 0.05, *** p<0.01
Log-Log regression models between ICT investment (independent variable) and total production (dependent variable) from manufacturing survey
INECNotes Significance level: * p<0.1, ** p< 0.05, *** p<0.01.
Appendix 1.
Distribution of the main variables (a)Total production (original series), (b) ICT investment (original series), (c) Total production (with natural logarithmic transformation) and (d) ICT investment (with natural logarithmic transformation)
INEC
Appendix 2.
Histograms of the main variables: (a) Total production, (b) ICT investment
INEC


