

Articles
Design and Development of a Mini-Orange Magnetic Spectrometer with Multichannel Facility for Conversion Electron Spectroscopy
Journal of Nuclear Physics, Material Sciences, Radiation and Applications
Chitkara University, India
ISSN: 2321-8649
ISSN-e: 2321-9289
Periodicity: Bianual
vol. 8, no. 1, 2020
Received: 15 August 2020
Revised: 24 September 2020
Accepted: 28 September 2020
Published: 09 November 2020
Corresponding author: vrkamisetti@gmail.com

undefined: Background: Conventional magnetic spectrometers used for conversion electron detection are very cumbersome, require strong magnetic fields and the spectra have to be scanned point by point and have very low transmission. A magnetic filter using permanent magnets and an Si(Li) detector would facilitate multichannel analysis with high transmission. The mini-orange is a new type of spectrometer for conversion electrons combining a solid state Si(Li) detector with a filter of permanent magnets around a central absorber of lead. Purpose: An indigenously developed magnetic spectrometer if optimized properly would be of great use in conversion electron spectroscopy for both online and offline experiments. Methods: A Mini-Orange magnetic spectrometer made of small permanent magnets has been designed and developed indigenously and optimized for its best performance condition. The transmission curves for different energy regions are plotted using the conversion electron spectra from the standard gamma transitions from 153Gd, 169Yb and 131Ba decays. The optimized spectrometer facilitates multichannel acquisition of conversion electron spectra for precision electron spectroscopy. The system also can be used in in-beam experiments with minor modifications of the vacuum chamber. Results: The optimized spectrometer was used for precision electron spectroscopy. Experimental transmission curves are then obtained by plotting Transmission (T) against the corresponding electron energy for low energy, medium energy and a broad energy range. Out of the several experiments done the optimum settings for f and g, that resulted in this curve, is identified at f = 7.5 cm and g = 4.5 cm. Conclusions: The optimized spectrometer facilitates multichannel acquisition of conversion electron spectra for precision electron spectroscopy. The system also can be used in in-beam experiments with minor modifications of the vacuum chamber.
1. Introduction
Conversion electron measurement is an important aspect of nuclear spectroscopy. Nucleus from an excited state depopulates by competing process of gamma and conversion election emission. Various types of magnetic devices have been used to measure the conversion electrons, such as, solenoids with strong field strengths, magnetic mirrors and orange type permanent magnets etc. The advantage of the orange type filters is its compactness in size and its ability to measure electrons in wide energy range and its ability to operate in a high background condition of in- beam experiments, providing multichannel analysis facility as detection precedes selection. Such type of spectrometer was first developed by Van Klinken [1-3] for conversion electron spectroscopy. The magnetic filter is a set of small permanent magnets, usually made of rare earth materials, such as SmCo5, due to their capability of producing intense magnetic field with small quantities of bulk material. The magnet pieces are wedge shaped arranged around a central absorber, which reduces the background due to direct gamma ray flux. The present work reports the indigenous development of such a facility. Sector magnets produce quite strong magnetic fields and are fairly compact in their build. Cambi et al. [4] used a compact magnet with uniform field to transport electrons in the momentum range of . The efficiency was 0.2%. Ejiri et al. [5] developed an achromatic sector magnet for transporting electrons. A very wide based electron transporter was designed by Komma [6] incorporating a triple focusing sector magnet. Van Klinken et al. [1-3] developed a Mini-orange Spectrometer for in- and off-beam conversion electron spectroscopy. These spectrometers have the following features: i) Conversion electrons are separated from positrons. The central absorber cuts off soft γ-rays, X-rays, δ-rays and other charged particles emitted from the target, ii)Since the magnets and the electron-orbit radius are comparable in size to the detector, electrons in a fairly large energy range (from 0.1 to a few MeV) are accepted by the detector. The low energy electrons, such as δ-rays are blocked and the maximum energy is determined by the detector thickness, iii) the absolute efficiency is as large as 7-10% because of the large acceptance angles of both and and iv) the size is small and this is very suitable for coincidence measurements with other detectors. It is quite inexpensive and easy to operate as well.
2. Methodology
2.1. Basic Principle
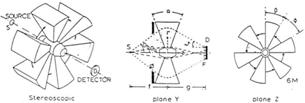
The mini-orange is a new type of spectrometer for conversion electrons combining a solid state Si(Li) detector with a filter of permanent magnets around a central absorber of lead. Figure 1 shows a schematic diagram of a typical mini-orange set-up. Plane Y is through the system axis, Z through the middle of the magnets as viewed from the source. Conversion electrons from the source S are bent around the central absorber towards the detector D by a toroidal magnetic field between the permanent magnets. The detector is especially well protected against positron radiation, because the field deflects it away from the detector. The detector can intercept a wide range of transmitted electrons, if its size is large with respect to the dimensions of the magnets system. However, since high-resolution detectors are restricted to areas of a few cm2, they can be made relatively large by using small sized magnets. Thus, the finally evolved system resembles a miniature orange spectrometer. However, the energy resolution and maximum measurable energy are not determined by the magnets, but by the quality and thickness of the Si(Li) detector. The toroidal field no longer works as a spectrometer. It only separates the electrons and provides space for the central absorber against other types of radiation.
2.2 Vacuum Chamber-Source, Detector and Magnet Arrangements
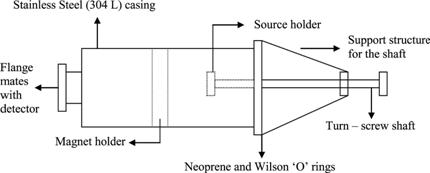
A vacuum chamber has been designed and built at Indira Gandhi Centre for Atomic Research (IGCAR), Kalpakkam, with the following features: i) be able to mate in a vacuum-tight environment with the front-flange ofthe Si(Li) detector, ii) be built of totally non-magnetic material: non-magnetic stainless steel (304L) with absolute leak proof till well over 10-6Torr , iii) be able to hold the magnet assembly and the source and also allow for variations in the source-magnet positions, without breaking the high vacuum. Some of its features are as follows: outer diameter: 168 mm, thickness of chamber wall: 3 mm, Chamber length: 257 mm and chamber volume: 4.5 liters.
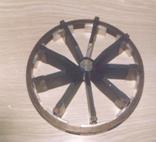
One end of the chamber has a connecting flange that mates with the front-flange of the Si (Li) detector and the other end consists of a movable shaft attached through a Wilson 'O' seal. This moving shaft of a length of about 260 mm has a 'source holder' at the end, which holds the radioactive source inside the chamber. With this shaft arrangement, the source-magnet distance, f, can be varied to a maximum of 200mm. The entire assembly view of the structure is clearly shown in Figure 1. The typical orange type arrangement of nin magnets is shown in Figure 2.
2.3 Si(Li) Detector Used
In conversion electron spectroscopy, room temperature silicon detectors are unsatisfactory because of their relatively high noise level. To minimize the noise, both the detector and the first stage of the preamplifier must be cooled. These requirements are satisfied by the EG & G ORTEC’S liquid nitrogen cooled BETA-X detector. It contains a 10 mm diameter, 5 mm deep Si(Li) detector, coupled to a noise-optimized cryogenic electronic front- end. An easy to operate valve gives access to the cryostat vacuum. The front flange can be opened for connection to an experimental vacuum chamber. A Beryllium window in the front flange makes the BETA-X detector a useful tool for X-ray spectroscopy as well. BETA-X is equipped with a cryogenic streamline preamplifier and high voltage filter combination, optimized for the specific applications. This includes high voltage shut-off to protect the detector from FET failures. The specifications of the BETA-X are: Detector Model: EG&G ORTEC SLB-10190, Cryostat configuration: CFG-B-SH, detector active diameter:10 mm, detector sensitive depth:5.30 mm, detector-window distance:7mm, absorbing layers:Beryllium:0.05 mm, Gold:≅200 A°, Silicon:≅ 0.1µm, Operating bias: negative 1000 V, resolution at 190 eV at 5.9 keV (X-rays), 1 keV at 115 keV (conversion electrons) and 3.5 keV at 976 keV (conversion electrons). The preamplifier specifications are as follows: Conversion gain:1.3 mV/keV negative output pulse, Rise time: 25 ns.
2.4 Connecting the Chamber with the Si(Li) Detector and the High Vacuum System
The Si(Li) detector used has a Soft-Copper ‘O’ ring that sits in a groove on the front flange of detector (Figure 3) This same ‘O’ ring is used for the junction that mates the vacuum chamber to the detector in a vacuum-tight environment. The Copper ‘O’ ring is made so as to ensure good vacuum and also reduce the friction and cold-flow.The vacuum chamber- detector assembly is connected via a valve on the detector assembly and neoprene tubing to a dummy chamber of the vacuum pump. The vacuum pump used is an ALCATEL TURBOPACK, which consists of: i) primary pump (fore pump) with high performance, compact design, single phase motor, low noise level Rotary Vane Pump [ALCATEL Model: 2005 SD, PASCAL series] which has a performance- range from atmospheric pressure to 10-4 mbar, ii) secondary Pump which is compact, robust and reliable, air-cooled Turbo Molecular Pump [ALCATEL Model: ATP 80] with a maximum range of upto 5x10⁻⁸ mbar; a one-touch operation, programmable Turbomolecular pump controller [ALCATEL Model: ACT 200T] and electronic display [ALCATEL Model: ACS 1000] vacuum multi-gauge unit.
The Mini - Orange Electron Spectrometer
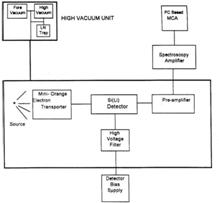
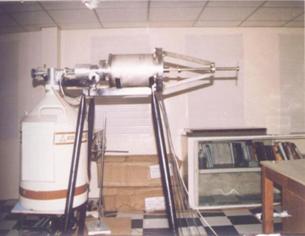
A block diagram of the electron spectroscopy system for use with the Mini-Orange electron transporter is shown in Figure 4. In the electron spectroscopy system, the size and material of the detector have a crucial influence on the performance of the spectrometer, in determining the final efficiency and the sensitivity to the background radiation. The detector thickness is an important parameter, since it sets the useful range of the spectrometer.A photograph of the Mini-Orange arrangement in operation is shown in Figure 5. This system has been used for recording conversion electron spectra of many long lived beta and electron capture decays thus yielding highly precise spectroscopic information.
2.6 Experimental Transmission Curves
Transmission of the mini-orange electron spectrometer has always been identified as analogous to the efficiency of a Ge(Li) detector. Hence, it becomes important to obtain suitable transmission curves, from which, transmission values may be interpolated for a given energy and source to magnet to detector geometry. Unlike the efficiency in the case of Germanium detectors, transmission not only exhibits energy dependence, but also shows a remarkable dependence on the source-magnet-detector geometry. Vanklinken et al. [3]. have pointed out that the highest transmission encountered by them occurred for a value of f (source to magnet distance) that was less than the corresponding value of g (magnet-detector distance). Using different combinations of magnets and various geometries, transmission curves may be obtained. These curves may indicate either a broad-range system with lesser peak transmission, or a narrow range system with higher transmission. A good review may be obtained from the works of Vanklinken et al [1-3].
Electron back scattering is the chief cause for the deviation of the measured spectrum from the continuum. Waldschmidt and Wittig [7] reported that k has a fixed value of k = 0.2 for the fraction of back scattered electrons independent of energy, but strongly dependent on the angle of incidence. Rester and Rainwater [8] reported that not only does the value of k depend on energy of the incoming electron, but that the data may differ from detector to detector.
It is clear that the transmission depends on a variety of parameters, like the field strength, physical dimensions of the magnets and the central absorber, the number of magnets, the source to magnet to detector geometries etc. All these determine the acceptance angle intervals of the detector to electrons and the angle of incidence, at the detector surface for the particles of a given energy. These contribute much towards the efficiency of the system at that energy. The counting efficiency of the detector itself forms yet another parameter on which the transmission (T) may depend.
Transmission is diminished by the back scattering of electrons from the detector surface. Hence, the measured counting rate IM must be corrected as follows: NM (E) = IM (1-kM) where, IM = measured counting rate with mini-orange, kM = the back scattering fraction of the incoming electrons, when measured with the mini-orange. The dependence of transmission (T) on several such factors makes it desirable to have a computational method, which allows an accurate prediction of the transmission for a given set of parameters. This would prove extremely beneficial in choosing the correct set of parameters for a required application and range of energies to study. A computer code has been written that performs this task. It considers the various parameters involved, that decides the transmission and calculates the results. For a given set of such parameters, the code generates the energy range that may be transmitted, the respective transmission value for each of the energy in the range, and the crucial back scattering factor k.
Keeping in mind the above pointers, it becomes clear as to how important it is to obtain the transmission curve for particular magnet configuration and source-magnet- detector geometry. Since a symmetric configuration of 9 magnets is used throughout the experiments, the only other variable parameter with respect to which transmission curves are obtained are the above mentioned geometries. A rough analysis of the preliminary investigations done with our system revealed three clearly demarcated energy regions, for which precise experimental transmission curves may be obtained. These energy regions tallied well with the electron energies of interest in the present work. A broad classification resulted in these three regions being identified as: i) low energy region (< 100 keV). ii) medium energy region (100 < E < 400 keV). and iii) a broad range system
3. Results
Calibration of the Spectrometer
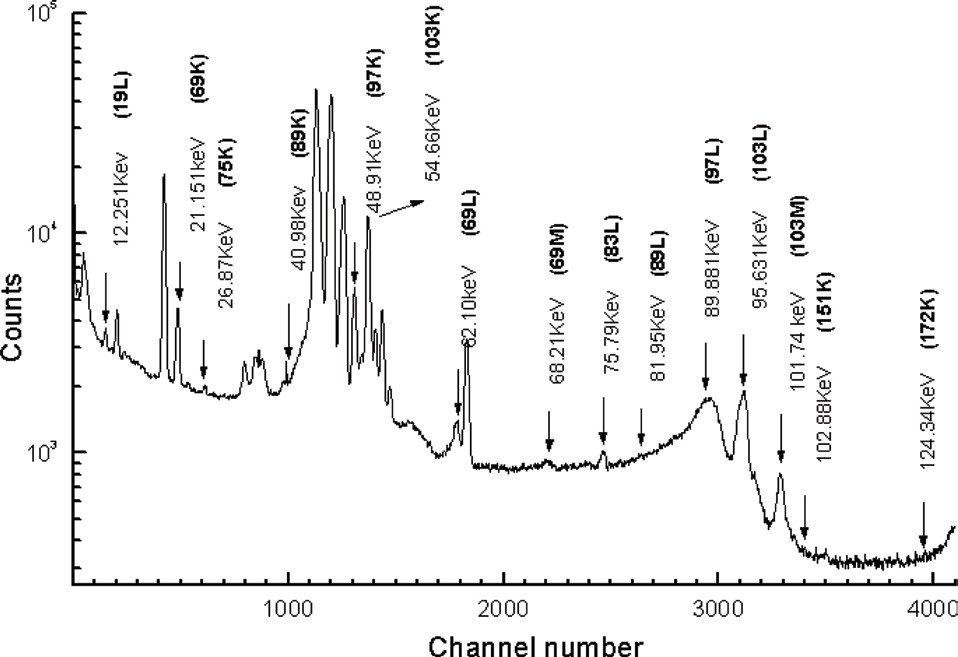
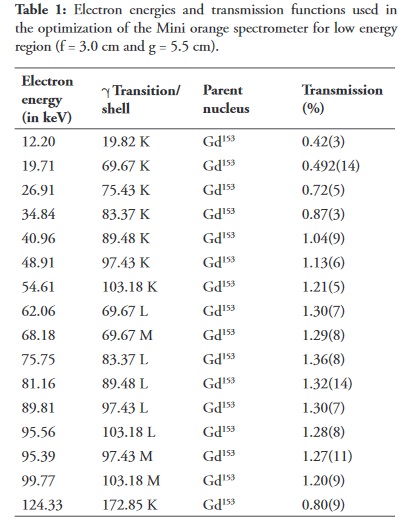
The nucleus 153Gd has a good number of intense transitions that result in well-defined conversion lines in the low energy region. Typical conversion lines and their energies are shown in Table 1. This nucleus has hence been identified as a good source to obtain the transmission plots in the low energy region. The 153Gd source for mini-orange electron spectroscopy is prepared in the typical way. Two spectra have been acquired for each source - one with the mini- orange and one without. The vacuum chamber designed to hold the magnets and the source, mates with the detector front flange on its own front end. The back end can be opened to insert the magnets and the source holder on a calibrated rod. The source was placed on the source holder, at the end of the rod and screwed shut.
For spectroscopy with the magnets, initially, the magnets are pushed through the chamber to the appropriate distance. A calibrated scale on the inside walls of the chamber showed, at every step, the detector-magnet distance - g. The source-holder rod is then inserted and the chamber closed. Using the calibration on the rod, the screw-shaft is turned till the appropriate value of ‘f ’ is reached. The chamber is then evacuated and the spectrum acquired. Typical counting time for these spectra is of the order of 1.5 105 seconds. Counting time plays an important role in determining the counting rate, IM, and hence, much care is taken to note it carefully. One such spectrum with the magnets in is shown in Figure 6. For spectroscopy without the magnets, the chamber is pumped down, to enable the removal of the magnets, without disturbing the setting of the source holder rod. The system is then again evacuated and the spectrum acquired for the same source-detector distance. Typical counting time ranged at about 1105 seconds.
Using the above method, few spectra are acquired for different settings of ‘f ’ and ‘g’ and the counting rates were calculated. The back-scattering factor, k, is obtained from the computer code developed to simulate the entire process. With the data then obtained, the Transmission (T), in percentage of 4, was calculated for each setting of ‘f ’ and ‘g’.
3.2 Optimization of the Spectrometer for Different Energy Regions
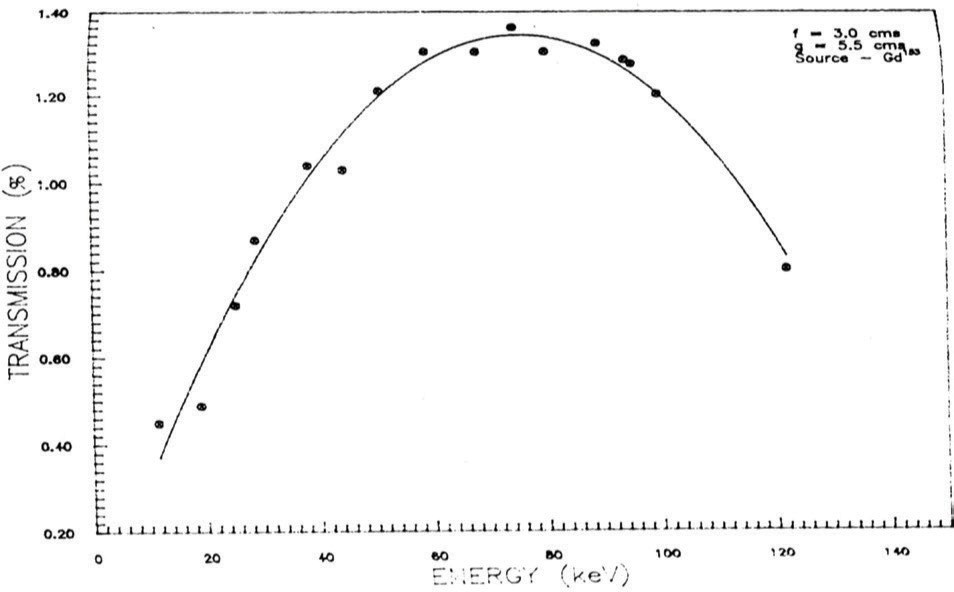
The procedure mentioned above, describes the method to optimize the system for low energy regions, using the 153Gdsource. The optimum combination of f and g distances for this region, is found to be at f = 3.0 cm and g = 5.5cm. Experimental transmission curves are then obtained by plotting Transmission (T) against the corresponding electron energy. Such a curve for low energy region (< 120 keV) is shown in Figure 7. The electron energies and corresponding transmission values are used in the plots shown in Table 1.
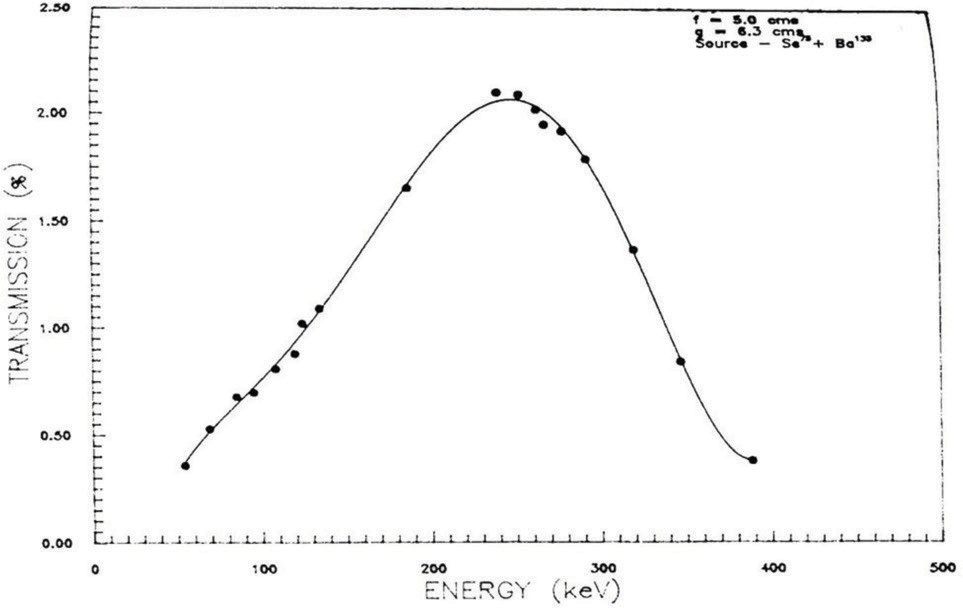
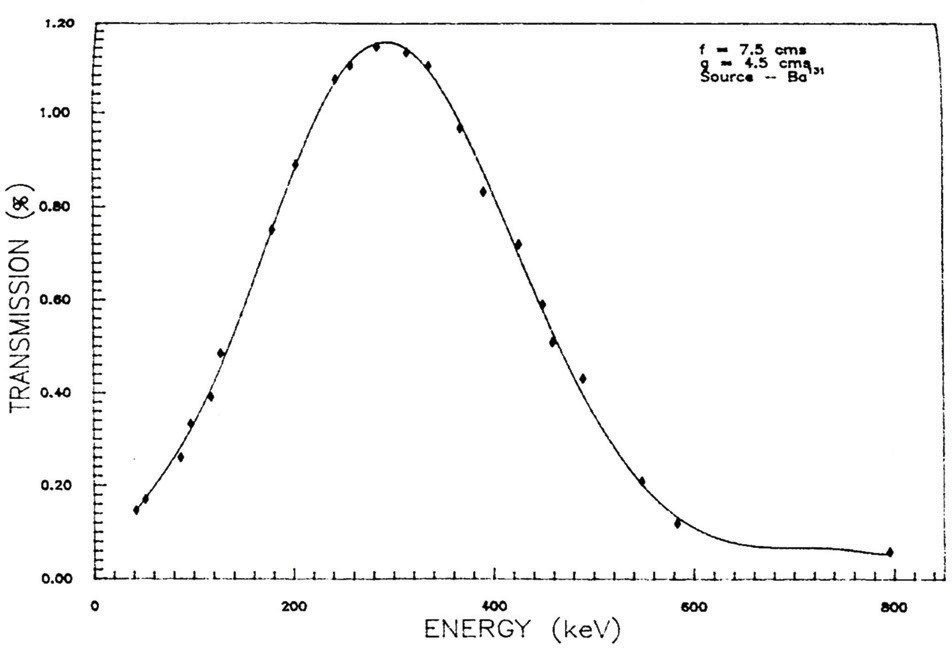
In a similar effort to optimize the medium energy region, a mixed source of 169Yb and 133Ba were used. The resulting transmission curve is shown in Figure 8. The optimum settings of f and g, for this region, is found to be at f = 5.0 cm and g = 6.3 cm. A further attempt to obtain a broad-range transmission curve (50 < E < 800 keV) is made. By using a source of 140Ba, such an optimization curve is obtained and is shown in Figure 9. Out of the several experiments done the optimum settings for f and g, that resulted in this curve, is identified at f = 7.5 cm. and g = 4.5 cm. It may be mentioned,in conclusion, that only conversion lines corresponding to strong and well-studied transitions were used for calibrating the mini-orange spectrometer. Errors in the calculation of the Transmission function (T), can be due to the measured counting rate, errors related to the time of acquisition and computation errors associated with the back +scattering factor,K. Overall error percentages are, however, limited to about 5%-8%, on an average, due to the selection of only strong conversion lines in the optimization process.
Conclusion
A Mini-Orange magnetic spectrometer made of small permanent magnets has been designed and developed indigenously and optimization for its best performance conditions is presented. The transmission of the spectrometer has been defined and the transmission curves for different energy regions are plotted using the conversion electron spectra from the standard gamma transitions from 153Gd, 169Yb and 131Ba decays. The optimized spectrometer facilitates multichannel acquisition of conversion electron spectra for precision electron spectroscopy. The system also can be used in in-beam experiments with minor modifications of the vacuum chamber.
Unlike the traditional magnetic spectrometers detection precedes selection in the magnetic filters thus providing multichannel analysis facility. This is advantageous as the spectra can be acquired for longer duration thus improving the statistics. In the traditional magnetic spectrometers in order to have good counts each point of the spectrum has to be collected for very long time, sometimes the spectrum has to be acquired for more than a week during which spectrometer and the involved electronic settings might be varying. Most importantly all the background due to delta rays, particularly in in-beam spectroscopy would be completely eliminated using the MO spectrometer. Many experiments have been performed using the present spectrometer by us [9-12] reporting many conversion electron measurements which were for the first time reports and were appreciated by the nuclear physics community.
Acknowledgement
The authors express their heartfelt gratitude to their founder chancellor Bhagawan Sri Sathya Sai Baba varu for providing us with all the facilities and His blessings and grace.
References
J. Van Klinken and K. Wisshak, Nucl. Instr. Meth. 98, 1 (1972). https://doi.org/10.1016/0029-554X(72)90416-8
J. Van Klinken, SJ Feenstra, K. Wisshak and H. Faust, Nucl. Instr. Meth. 130, 427 (1975). https://doi.org/10.1016/0029-554X(75)90040-3
J. Van Klinken, S.J. Feenstra and G. Dumont, Nucl.Instr. Meth. 151, 443 (1978).https://doi.org/10.1016/0029-554X(78)90152-0
A. Cambi, T.F. Fazzini, A. Giannatiempo and P.R.Maurenzig, Nucl. Instr. Meth. 103, 331 (1972).https://doi.org/10.1016/0029-554X(72)90391-6
[5] H. Ejiri, T. Shibata, Y. Nagai and S.Nakayama, Nucl.Instr. Meth. 134, 107 (1976).https://doi.org/10.1016/0029-554X(76)90130-0
M. Komma, Nucl. Instr. Meth. 154, 271 (1978).https://doi.org/10.1016/0029-554X(78)90410-X
[7] M. Waldschmidt and S. Wittig, Nucl. Instr. Meth. 64,189 (1968).https://doi.org/10.1016/0029-554X(68)90195-X
D.H. Rester and W.J. Rainwater, Nucl. Instr. Meth.41, 51 (1966).https://doi.org/10.1016/0029-554X(66)90336-3
S. Deepa, D.R. Rao and K. Venkataramaniah,Radiation Physics and Chemistry 119, 207 (2016).https://doi.org/10.1016/j.radphyschem.2015.10.018
S. Deepa, K. Vijay Sai, R. Gowrishankar and K. Venkataramaniah, European Physics Journal A 48 , 126 (2012). https://doi.org/10.1140/epja/i2012-12126-2
[11] S. Deepa, K. Vijay Sai, R. Gowrishankar, D. Rao and K. Venkataramaniah, Appl. Radiat. Isotopes 69, 869 (2012). https://doi.org/10.1016/j.apradiso.2011.02.012
D. R. Rao, K. VijaySai, M. Sainath and K. Venkataramaniah, European Physics Journal A 26, 41 (2005). https://doi.org/10.1140/epja/i2005-10152-9
Author notes
vrkamisetti@gmail.com
Additional information
Copyright: Copyright: [© 2020 M. Sainath et al.] This is an Open Access article published in Journal of Nuclear Physics, Material Sciences, Radiation and Applications (J. Nucl. Phy. Mat. Sci. Rad. A.) by Chitkara University Publications. It is published with a Creative Commons Attribution- CC-BY 4.0 International License. This license permits unrestricted use, distribution, and reproduction in any medium, provided the original author and source are credited.
Journal: J. Nucl. Phys. Mat. Sci. Rad. TO.
Volume & Issue: 8 (1)
Year: 2020
Journal Homepage: https://jnp.chitkara.edu.in/index.php/jnp
Publisher: Chitkara University Publications
Article Url:: https://jnp.chitkara.edu.in/index.php/jnp/article/view/237

