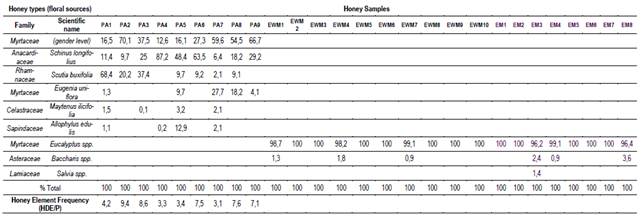
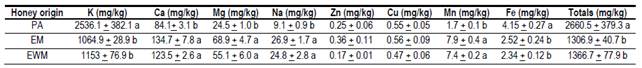
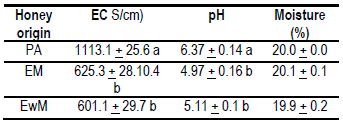
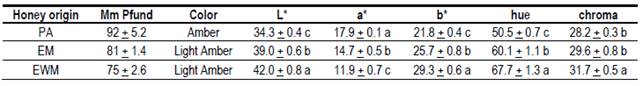
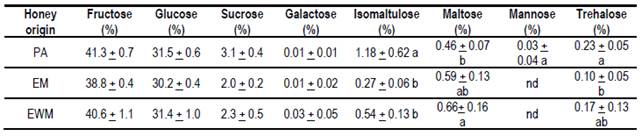
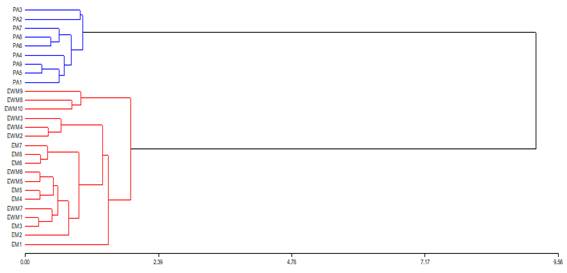
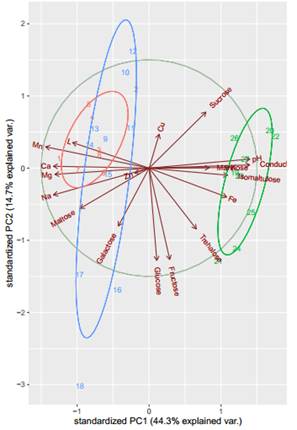
Servicios
Descargas
Buscar
Idiomas
P. Completa
Honey characterization from two landscapes of the northeast region of Uruguay
Cracco, Pablo; Moreni, Arnaldo; Cabrera, Cristina;
Cracco, Pablo; Moreni, Arnaldo; Cabrera, Cristina; Galietta, Giovanni; Santos, Estela
Honey characterization from two landscapes of the northeast region of Uruguay
Caracterización botánica y fisicoquímica de mieles del noreste del Uruguay
Caracterização de méis de duas paisagens da região nordeste do Uruguai
Agrociencia Uruguay, vol. 26, no. 1, e980, 2022
Universidad de la República
resúmenes
secciones
referencias
imágenes

Abstract: The world honey market values ​​organic and natural honeys. Forest activity in the northeast of Uruguay, free of agricultural activities and with the presence of a protected area, is an opportunity for local beekeepers and transhumant people. The characterization of these honeys through melissopalynology and physical-chemical parameters could generate new valorization strategies. The objective of this study was to characterize honeys (n=27) from the protected area and from afforestation with Eucalyptus grandis under two production systems (transhumance and non-transhumance beekeepers). Botanical composition was analyzed by palynology, mineral profile, moisture, conductivity, pH, color (CIEL*a*b*), sugar profile and presence of glyphosate. The palynological analysis determined two types of honeys (monofloral from Eucalyptus sp. in the forestation and honeydew honeys with the presence of diverse pollens from native species in the protected area. No significant differences (p<0.05) were found between the honeys from eucalyptus for both beekeeping production systems in all the parameters evaluated. The honeydew honeys have an unknown origin and were statistically different from the previous ones. The average values ​​of pH and conductivity for these honeys were 6.37 ± 0.14 and 1113 ± 25.6 µS/cm respectively. The concentration of minerals K (2536.1 ± 382.1 mg/kg honey) and Fe (4.15 ± 0.27 mg/kg honey) was higher than those found in eucalyptus honey. The percentages of Isomaltulose (1.18 ± 0.62) and Trehalose (0.23 ± 0.05) sugars were higher in the honeys from the protected area while Maltose (0.46 ± 0.07) was lower. Glyphosate residues were not detected in all the samples analyzed. Should insist on good management practices carried out by beekeepers when they arrive from agricultural areas (transhumance beekeepers). Research should continue to determine the origin of the myelates in the protected area. Although the volumes produced are smaller, their valuation could increase due to the originality of these honeys. The northeast region of Uruguay has the potential to produce quality honey properly identified by geographic and botanical origin.

Keywords: Uruguay honey,honeydew,pollen determination,physicochemical characterization.

Resumen: El mercado mundial de miel valora las mieles orgánicas y naturales. La actividad forestal en el noreste del Uruguay, libre de actividades agrícolas y con la presencia de un área protegida, es una oportunidad para los apicultores locales y trashumantes. La caracterización de estas mieles a través de la melisopalinología y los parámetros fisicoquímicos podría generar nuevas estrategias de valorización. El objetivo de este trabajo fue caracterizar mieles (n=27) provenientes del área protegida y de la forestación con Eucalyptus grandis bajo dos sistemas de producción (apicultores trashumantes y no trashumantes). Se analizó la composición botánica mediante palinología, perfil de minerales, humedad, conductividad, pH, color (CIEL*a*b*), perfil de azúcares y presencia de glifosato. El análisis palinológico determinó dos tipos de mieles (monofloral de Eucalyptus sp.) en la forestación y mieles de mielada con presencia de pólenes diversos de especies nativas en el área protegida. No se encontraron diferencias significativas (p<0,05) entre las mieles de eucalipto para ambos sistemas de producción apícola en todos los parámetros evaluados. Las mieles de mieladas tienen origen desconocido y fueron estadísticamente diferentes respecto a las anteriores. Los valores promedios de pH y conductividad para estas mieles fueron 6,37± 0,14 y 1113 ± 25,6 µS/cm, respectivamente. Los minerales K (2536,1 ± 382,1 mg/kg miel) y Fe (4,15 ± 0,27 mg/kg miel) fueron mayores respecto a los encontrados en las mieles de eucaliptos. Los porcentajes de azúcares Isomaltulosa (1,18 ± 0,62) y Trehalosa (0,23 ± 0,05) fueron mayores en las mieles del área protegida, mientras que Maltosa (0,46 ± 0,07) fue menor. No se detectaron residuos de glifosato en todas las muestras analizadas. Sin embargo, se debe insistir en las buenas prácticas de manejo que realizan los apicultores cuando llegan desde áreas agrícolas (apicultores trashumantes). Se deberá continuar investigando para determinar el origen de los mielatos del área protegida. Si bien los volúmenes producidos son menores, podría aumentar su valoración debido a la originalidad de estas mieles. La región noreste de Uruguay tiene potencial para producir mieles de calidad debidamente identificadas por origen geográfico y botánico.

Palabras clave: miel de Uruguay, mielato, determinación polínica, caracterización fisicoquímica.

Resumo: O mercado mundial de mel valoriza os méis orgânicos e naturais. A atividade florestal no nordeste do Uruguai, livre de atividades agrícolas e a presença de uma área protegida, é uma oportunidade para apicultores locais e pessoas transumantes. A caracterização destes méis através da melissopalinologia e parâmetros físico-químicos poderá gerar novas estratégias de valorização. O objetivo deste trabalho foi caracterizar os méis (n=27) da área protegida e da arborização com Eucalyptus grandis sob dois sistemas de produção (apicultores com transumância e não transumância). A composição botânica foi analisada por palinologia, perfil mineral, umidade, condutividade, pH, cor (CIEL*a*b*), perfil de açúcares e presença de glyphosate. A análise palinológica determinou dois tipos de méis (monofloral de Eucalyptus sp. na florestação e méis de melada com presença de diversos pólens de espécies nativas da área protegida. Não foram encontradas diferenças significativas (p<0,05) entre os méis de eucalipto para ambos os sistemas de produção apícola em todos os parâmetros avaliados. Os méis de melada têm origem desconhecida e foram estatisticamente diferentes dos anteriores. Os valores médios de pH e condutividade para esses méis foram 6,37 ± 0,14 e 1113 ± 25,6 µS/cm respectivamente Os minerais K (2536,1 ± 382,1 mg/kg de mel) e Fe (4,15 ± 0,27 mg/kg de mel) foram maiores que os encontrados no mel de eucalipto. Nos méis da área protegida enquanto Maltose (0,46 ± 0,07) foi menor, resíduos de glifosato foram detectados em todas as amostras analisadas. Devem insistir nas boas práticas de gestão realizadas pelos apicultores quando chegam das zonas agrícolas (apicultores de transumância). A pesquisa deve continuar para determinar a origem dos mielatos na área protegida. Embora os volumes produzidos sejam menores, sua valorização pode aumentar devido à originalidade desses méis. A região nordeste do Uruguai tem potencial para produzir mel de qualidade devidamente identificado por origem geográfica e botânica.

Palavras-chave: mel do Uruguai, melada, determinação de pólen, caracterização físico-química.

Carátula del artículo

Food Technology

Honey characterization from two landscapes of the northeast region of Uruguay

Caracterización botánica y fisicoquímica de mieles del noreste del Uruguay

Caracterização de méis de duas paisagens da região nordeste do Uruguai

Cracco, Pablo
Universdad de la República, Uruguay
Moreni, Arnaldo
Universdad de la República, Uruguay
Cabrera, Cristina
Universdad de la Repúblic, Uruguay
Galietta, Giovanni
Universdad de la República, Uruguay
Santos, Estela
Universdad de la República, Uruguay
Agrociencia Uruguay
Universidad de la República, Uruguay
ISSN-e: 2730-5066
Periodicity: Bianual
vol. 26, no. 1, e980, 2022

Received: 12 November 2021

Accepted: 07 May 2022

Published: 19 May 2022


Corresponding author: pcracco@gmail.com

1. Introduction

Honey is a natural sweet substance produced by bees Apis mellifera from plant nectar, from secretions of live parts of plants, or from excretions of insects that feed on live parts of plants and which bees collect, process, and combine with specific substances of their own, and deposit, dehydrate, store and leave in the honeycomb to mature and age(1).

The most common resource used by bees in honey production is flower nectar. However, there are other extra-floral sources of secretions of sap-sucking insects, mainly Aphididae(2). The honey production of Apis mellifera in Uruguay is one of the main farm products, marketed, in more than 90%, to Europe and North America(3). These honeys must be subject to a continuous routine analysis, which demonstrates their genuine origin, their quality in terms of physicochemical parameters and free of contaminating residues. Some studies have characterized Uruguayan honeys(4)(5)(6)(7)(8)(9)(10)(11)(12). But the physicochemical approach in the northern region of the country is still incipient. Studies that refer to honeys from the northeast of Uruguay do not contemplate the production of the department of Rivera(6). The development of livestock and forestry production in this agricultural-free region allows both local (non-transhumant) beekeepers and those who move from agricultural (transhumant) areas to produce eucalyptus honey. An area of natural forest known as Valle del Lunarejo is associated with this region, which belongs to the National System of Protected Areas (SNAP by its Spanish acronym). It is possible to find combinations of soil, climate and vegetation in this area that allow producing typical honeys at different times of the year. These honeys have shown to differ in their botanical origin, with the presence of myelates(11)(12).

Glyphosate contamination does not seem to be a threat in both, protected area and afforestation, due to the production system itself; however, it is necessary to take specific precautions in each harvest season. Characterizing the honeys of this region is fundamental to create new marketing opportunities with a differential product, with characteristics typical of the place and free of contaminants. This study aimed to characterize, through physicochemical parameters, botanical origin and contaminant residues (glyphosate), honey produced in forest systems of Eucalyptus grandis (monofloral) and honey produced in the protected area Valle del Lunarejo.

2. Material and Methods
2.1 Sampling

Samples of honey from the northeast of Uruguay from forest production of Eucalyptus grandis were analyzed under two beekeeping production systems, without transhumance (EWM) and with transhumance (EM) in the autumn 2019 season, and from the native forest of the Valle del Lunarejo protected area (PA), in 2019 spring season (Figure 1). Ten beehives were randomly selected at each production site, and two frames with wax sheets were introduced into each beehive. After these were worked and capped, pieces of honeycomb were cut and placed in sterile jars for further analysis. This sampling method ensures the freshness of the honey, the production period, and the geographical origin, in addition to controlling the techniques applied in the apiary (cures, feeding, etc.)(11).


Figure 1
Location of the 3 apiaries in the northeastern region of Uruguay Limit between two systems afforestation and protected area

2.2 Botanical and physicochemical determination
2.2.1 Palynological analysis

Palynological analysis was performed according to the Louveaux method(13). After centrifuging, the residue was observed under a 400 magnification microscope, and 600 pollen grains were identified and accounted for to determine the relative abundance of each determined rate(14). The honeydew elements (HDE) were determined and quantified to relate them to the abundance of pollen grains.

2.2.2 Minerals

Minerals were determined by flame (Ca, Mg) or emission (Na, K) Atomic Absorption Spectroscopy with an EAA Perkin Elmer PinAAcle 500 (USA). A liquid sample was aspirated, aerosolized and burned in flame for the release of specific minerals(15). One gram of honey was taken to acidic solution, with ultrapure HNO. (1M) and HCl 6 M, in Erlen with steam trap device, in hot iron, for one hour, and then brought to volume with distilled H.O, less than 18 Mohms(16). A standard curve was constructed for each analyte from Ca, Mg, K and Na stock solutions of 1000 mg/l Merck (Germany). The content of Iron (Fe), Zinc (Zn), Copper (Cu) and Manganese (Mn) in honey was also quantified, with an Atomic Absorption Spectrometer (Perkin Elmer, AAnalyst 300, USA), equipped with a deuterium lamp as background corrector, with flame (air-acetylene; 8.0 l/min and 1.4 l/min).

2.2.3 Moisture, conductivity, and pH

The moisture content was measured with a 3 M ATAGO-MASTER manual refractometer (58° to 90° Brix), using a drop of honey from each sample. Data were expressed as moisture percentage (%). Conductivity and pH were measured in a dilution of 20% (w/v) of deionized water. Electrical conductivity was measured with a conductivity meter OAKTON CON 10 (USA). Conductivity was expressed in μS/cm. The pH was measured with a pH meter JENWAY 3305 (UK), at 20 °C room temperature.

2.2.4 Color

The honey extracted from the honeycombs was centrifuged in a centrifuge (Thermo Scientific, Sorvall ST-16R, USA) for 10 min at 3000 rpm. Once centrifuged, a disposable bucket for spectrophotometry of 4 cm³ and 1 cm wide (PS, PlastiBrand™, Germany) was filled. The bucket was covered and placed horizontally on a white background on a countertop illuminated with fluorescent light tube (T8, 36 W, cold - Philips L24540). The color was measured in three areas of the bucket, in the CIELAB color space with a colorimeter (Konica Minolta CR-10, Japan), illuminant D65, observer angle 10º and illuminant angle 8º. The variables of color were measured: luminosity (L*), a* (+a* red, - a* green) and b* (+b* yellow, -b* blue), and tone (Hue, ºHab) and saturation (Chroma, C*ab) were calculated. A classic color determination was made in mm Pfund, so as to compare. It was determined using a HANNA digital colorimeter, with direct reading on the 4 cm³ buckets.

2.2.5 Sugars

The sugars: fructose, glucose, sucrose, mannose, galactose, isomaltulose (palatinose), maltose and trehalose were determined by high-performance liquid chromatography (HPLC). One gram of honey was taken from each sample, which was stirred with 20 mL of deionized H.O to homogenize. The solution was filtered before injection into the HPLC using PVDF filters of 13 mm diameter and 0.45 microns of pore size (Merck Millipore). An HPLC Prominence, LC-20A series, Shimadzu Corporation (Japan) was used, equipped with a differential refractive index detector (RID-20A), integrated solvent supply pump with quaternary gradient kit (LC-20AT), autosampler (SIL-20AC HT), column thermostatization oven (CTO-10AS VP) and degassing unit (DGU-20A 5R).

LabSolutions software was used for data processing. A Column Luna Omega SUGAR 100 Å, 3 μm, 250x4.6 mm (Phenomenex, USA) was used for separation, thermostatized at 40 ºC. The mobile phase consisted of Acetonitrile:H.O (80:20) at a flow of 1 mL min-1. The RID detector was thermostatized at 40 ºC. The total running time was 30 min. Quantification was carried out with external standards: D(-)-Fructose (99.9%, Certified Reference Material, Sigma-Aldrich, USA),: D(+) -Glucose anhydrous AR® ACS (97-102%, Macron Fine Chemicals, USA), D(+)-Sucrose (99.5%, Sigma-Aldrich, USA), Isomaltulose (94.5%, USP Reference Standard, USA), D(+)-Galactose (≥99%, Sigma-Aldrich, USA), D(+)-Mannose (≥99%, Synthetic, Sigma-Aldrich, USA), D-(+)-Maltose monohydrate (≥99%, Solanum tuberosum, Sigma-Aldrich, USA) and D-(+)-Trehalose dihydrate (≥99%, from Saccharomyces cerevisiae, Sigma-Aldrich, USA); generating respective calibration curves for each sugar.

2.2.6 Glyphosate

Glyphosate + AMPA content was determined from 50 g of a composite sample of honey. The reference technique was based on the Spanish standards(17). Results are expressed in mg/kg honey (ppm). The detection limit is 0.05 mg/l and the quantification limit is 0.2 mg/l.

2.3 Statistical analysis

The data obtained were analyzed with a simple ANOVA and the mean differences, by the Tukey-Kramer test (p<0.05). Homogeneity of variances and normal distribution of the analyzed variables are assumed. Two multivariate analysis tools were used: cluster analysis (dendrogram) to evaluate the similarity between the samples obtained, and principal component analysis (PCA) to look for possible associations between physicochemical and nutritional variables and the honeys studied. The dendrogram was performed with the average Manhattan distance and Ward's grouping method using the variables Luminosity, pH, conductivity, sugars and minerals. The Infostat program was used(18). The PCA was performed with the same variables. The ANOVA and the PCA were carried out with the RStudio program(19).

3. Results
3.1 Honey samples

A total of 27 honey samples were obtained, 10 samples were from EWM, 8 from EM and 9 from PA. The number of samples from each production site is different since the frames were not 100% capped in EM and PA at the time of harvesting.

Table 1
Relationship between pollens and honeydew elements HDE of each honey sample

Data ​​represents HDE/pollen ratio and percent of pollen in each honey sample.

Table 2
Means and standard deviations of the minerals analyzed in the 3 honey groups

Different letters in each column mean significant differences p> 0.05 (Tukey-Kramer).

3.2 Palynology

The result of the palynological analysis is presented in Table 1. The honeys obtained in EWM and EM presented a very high percentage of Eucalyptus sp. (dominant pollen > 95%), agreeing with the monofloral requirements. These samples were obtained between March and April, over 15 days, when most of the supers were completely capped (10 kg). Honey samples from the PA site produced in spring (September to December) have a greater diversity of botanical origins, highlighting the presence of Anacardiaceae and at least two species of Myrtaceae (Table 1). These honeys (PA) showed the presence of abundant honeydew elements and a ratio of HDE/pollen>3, characteristic of myelates honey(13).

3.3 Minerals

Results of the mineral content are observed in Table 2 and are within the range reported by other authors. Honey from the United States of America has an average value of 1700 mg/kg of minerals in honey(20); in Europe, it presents values of 1000 to 2000 mg/kg in floral honeys and more than 10000 mg/kg in myelates(21).

3.4 Moisture, conductivity, and pH

The data obtained are presented in Table 3. No significant differences were found for moisture between honeys. The values were within the range cited in the literature and accepted for honey(1). The electrical conductivity analysis showed no significant differences between the EWM (601 ± 29.7 µS/cm) and EM (625.3 ± 28.1 µS/cm) honey; however, these results were significantly different to the PA value (1113.1 ± 25.6 µS/cm). No significant differences were found in the pH values for EWM (5.11 ± 0.1) and EM (4.97 ± 0.16) honey, respectively; however, these were significantly different from PA honey (6.37 ± 0.14).

Table 3
Means and standard deviations of conductivity pH and moisture of the 3 groups of honey

Different letters in each column mean significant differences, p> 0.05 (Tukey-Kramer).

Different letters in each column mean significant differences, p> 0.05 (Tukey-Kramer).

3.5 Color

The results obtained for color, measured through the mm Pfund scale and by CIE L*a*b methodology (Table 4), show that there is a similarity between the eucalyptus honeys of both production systems, EWM: 75 mm and EM: 81 mm, being in the shade of Light Amber. The PA honeys had a darker coloration, 92 mm, which is classified as Amber.

3.6 Sugars

The data obtained are presented in Table 5. There were no significant differences between EWM and EM honeys, however, they differ significantly from PA honey in the contents of disaccharides: isomaltulose, maltose and trehalose, and in the mannose monosaccharide.

3.7 Glyphosate

No presence of glyphosate was detected in the honey samples analyzed in the 3 sites, EWM and EM (forest) and PA (native forests).

3.8 Descriptive statistics

Two groups of honey can be observed through cluster analysis (dendrogram). On the one hand, eucalyptus honeys that, regardless of the site and the form of production, are associated with similar characteristics. On the other hand, honeydew honeys, in addition to being a single group, were closer to each other (Figure 2). Regarding the PCA multivariate analysis, the contents of Mn, Ca, Mg, Na, Maltose and Galactose were found to be the variables that best explain the groupings of the EWM and EM honeys, while for PA honeys the Fe, pH, conductivity, Isomatulose and Mannose had a greater incidence (Figure 3).

4. Discussion
4.1 Palynology

The abundant floral supply and the proximity of these floral sources to the EWM and EM apiaries explain the absolute predominance of eucalyptus pollen. The forestry system does not allow the implantation of other plant species within the forest, thus, some other species are found on the periphery of the afforestation (Baccharis sp.). PA honeydew honeys take more time to produce and are botanically more diverse. Beyond the extended production time, which allows the flowering of numerous species (Table 1), this demonstrates the richness and diversity of the protected area. These honeydew honeys with diverse floral pollen contents could be valued for their high mineral content and antioxidant properties(2).

To ensure its origin, a complementary analysis of carbon isotopes was performed(22)(23). It was determined that its origin is from C3 plants (Table 6), since they do not exceed the limit value (Δδ13C ± 2.1 ‰) and the F/G ratio (Δδ13C ± 1.0 ‰)(22). Discarding a possible adulteration by use of syrups. Although its specific origin is not known, it is possible that, due to its high content of K and Maltose, it comes from some species of Fabaceae. The Bracatinga .Mimosa scabrella, Fabaceae) of the southern region of Brazil generates a myelate with these characteristics(24). Beak-sucking insects that feed on C3 species are likely present in this region, generating myelates. Recently, it was discovered in Uruguay that the Flatidae Epormenis cestri, when fed on Sebastiania schottiana, excretes a substance that bees collect, making a honeydew honey with high pH and conductivity(25).

4.2 Minerals

The EWM and EM honeys presented similar and even higher mineral content than other eucalyptus honeys(26)(27), despite the fact that this study determined only 8 minerals of the 54 possible minerals detected in honey(27). Significant differences were found between eucalyptus honey (EWM and EM) and PA honey for minerals K, Ca, Mg, Na, Mn and Fe. The lower Na content (9.1 mg/kg honey) in PA honey compared to EWM and EM is highlighted.

Table 4
Means and standard deviations of the color variables of the 3 honey groups

Different letters in each column mean significant differences p> 0.05 (Tukey-Kramer).

Table 5
Means and standard deviations of the analyzed sugars in the 3 honey groups

Different letters in each column mean significant differences p> 0.05 (Tukey-Kramer). nd = not detected


Figure 2
Dendrogram. In blue, honeys from protected area; in red, both groups of honeys from Eucalyptus grandis


Figure 3
PCA Multivariate Analysis In green PA honey in blue EWM honey and in red EM honey

Table 6
Carbon isotopes of a sample composed of honeydew

This value is lower than others found in this same region(11). The higher content of Fe also stands out (4.15 mg/kg honey) in PA honey, which coincides with another study for this same region(12). The Mn content is very low in honey in general(21)(27). PA honey had lower content (1.7 mg/kg), but matches previous results reported for the region(12). The content of these minerals is relevant in the human diet since they are members of enzymes such as catalase (Fe) and superoxide dismutase (Mn), which act by preventing oxidative stress at cellular level(27). These differences found in the mineral profile are attributed to the different groups of soils and vegetation existing at each site(28).

4.3 Moisture, conductivity and pH

Regarding the moisture of honey, although the rules establish a maximum, exceptions are accepted. Bibliography cites honeys from desert climates with less than 14% moisture(29) and honeys from humid tropical climates with values over 27%(30). Working with honeys extracted from 100% capped honeycombs ensures the minimum moisture bees are able to achieve in the climatic conditions of the region(31).

The European limit for electrical conductivity applied to floral honeys is 800 μS/cm, this reaffirms the extra-floral origin of PA honeys, values associated with high mineral contents(28). Other floral honeys (with the presence of myelates) of the region (PA) presented high conductivity values (920 μS/cm) associated with high values of K (3150 mg/kg honey)(11). The conductivity values of EWM and EM honeys (600 μS/cm) were higher than other values reported for eucalyptus honeys with fewer minerals (480 μS/cm)(27). This greater amount of minerals could mean a differential feature of the eucalyptus honeys of Uruguay. Eucalyptus honeys from other regions of Uruguay have been reported to contain higher conductivity values than those found in this study(10). This could be explained by differences in soils (fertility, depth and mineral content) or by eucalyptus varieties.

The pH values found in PA honeys (6.37) have not been previously reported in Uruguay(7) and differ from previous studies carried out in this same region and the same harvest season (spring). The mentioned study found honeys with myelates, but of floral origin of Schinus,Lithraea brasiliensis, Myrcianthes sp. and Gleditsia sp., with an average pH of 4.2(11). This difference could indicate that different honeys can be produced in the same region and season of the year due to a year effect, and it can give them greater value for their originality. These characteristics could be typical of this place, associated with the botanical and geographical origin. At medicinal level, honeys with high pH values (up to 6.97)(29) acquire value due to their use in treatments of gastric ulcers(32), so, evaluation of these myelates through these physicochemical and nutritional characteristics should continue.

4.4 Color

All honeys presented shades of color that are the most accepted by the Uruguayan consumers(8). Pfund values, as well as the mineral content in EWM and EM honeys, are higher than those reported for eucalyptus honeys(27)(33). In Uruguay, values of 62 to 75 mm Pfund were found in honeys of Eucalyptus sp. with L* values from 32.6 to 34.3(8). These L* values are lower than those found in this study (Table 5). The way the samples are obtained, the storage period and temperature, and the lighting conditions when measuring could explain these differences. Eucalyptus honeys in the world present different color ranges in mm Pfund (53 mm to 96 mm and 41 mm to 77 mm), but the differences between species must be considered(33). L* values measured through the CIE L*a*b methodology (Table 5) were within the range reported for other Uruguayan honeys(11). They were significantly different, being the honeys of EWM more luminous (42.0) than EM (39.0) and PA (34.3). This difference in L* occurs even though the EWM and EM honeys did not present differences in the total mineral content and belong to the same scale according to Pfund. This supports the increased ability to separate honeys through color by the CIE L*a*b* method.

4.5 Sugars

While the honey samples obtained in EWM and EM were obtained from the production of Eucalyptus grandis, the values of fructose, glucose, the sum of both (F+G), and sucrose are within the ranges reported for eucalyptus honeys Eucalyptus globulus.(34) and Eucalyptus camaldulensis(35). These values are within the accepted ranges proposed in standards for eucalyptus floral honeys(1). Apart from some differences in mineral content and conductivity, these honeys can be determined as eucalyptus by their sugar content.

4.6 Glyphosate

The absence of glyphosate in EWM and PA honeys could be due to local beekeepers not producing outside the region. These results coincide with an older study conducted at the PA site, where the presence of glyphosate was also not detected(11). There is a low risk of contamination due to the productive systems (livestock and afforestation) of the region(11). The absence of glyphosate in EM honeys does not imply that there is no risk of contamination if the beekeepers were previously in agricultural areas. It is necessary to insist on the good management practices that must be carried out by transhumant beekeepers in agricultural areas and when they arrive from them.

5. Conclusions

Through this study, typical eucalyptus honeys from the northeastern region of Uruguay and honeys from the native forest of the protected area have been characterized physicochemically. The productive potential of eucalyptus in that region and the quality of the honey obtained are highlighted. The volumes produced in a short time (10 kilos per hive in 15 days) justify transhumance into this crop, obtaining contaminant-free honeys. In the native forest of the protected area, another type of honey is produced, of extra-floral origin, with particular characteristics that could enhance it. Although the production period is longer and the volumes produced are smaller, the originality of that honey makes it different and can be an argument for the maintenance and expansion of protected areas. Subsequent research should study the identification of insects, and from which plants these honeydew honeys are generated and what antioxidant properties they could have. Within the protected area it is possible to obtain honeys with different characteristics compared to other regions, which should be studied for a longer time and in greater depth.

Supplementary material
Additional information

Editor: Gustavo Gonzalez-Neves (https://orcid.org/0000-0002-0828-4752) Universidad de la República, Facultad de Agronomía, Montevideo, Uruguay

Author contribution statement: Cracco and Moreni: Conception of the test, collection and preparation of samples, color determination, statistical analysis, and writing. Cabrera: Minerals and glyphosate determination. Galietta: Sugars, pH and conductivity determination, and writing. Santos: Palynological analysis and writing.

Acknowledgments

To the Food Quality & Product Quality Laboratory of the Agronomy College.

To beekeepers Leonardo Rodríguez and Martín Rodríguez.

References
1. Codex Alimentarius. Revised codex standard for honey, standards and standard methods. Rome: FAO; 2001. 7p.
2. Pita-Calvo C, Vazquez M. Differences between honeydew and blossom honeys: a review. Trends Food Sci Technol. 2017;59:79-87.
3. Carrau A, Bianchi S, Pintos J. Sector apícola: situación y perspectivas [Internet]. In: Anuario OPYPA 2021. Montevideo: MGAP; 2020 [cited 2022 May 07]. 11p. Available from: https://bit.ly/3OXHi9U.
4. Bazurro D, Díaz R, Sánchez M. Tipificación de miel de palma butiá (Butia capitata) durante la floración de 1995-1996 en el Departamento de Rocha. Rocha: PROBIDES; 1996. 25p. (Documento de trabajo; 12).
5. Daners G, Tellería C. Native vs. introduced bee flora: a palynological survey of honeys from Uruguay. J Apic Res. 1998;37:221-9.
6. Corbella E, Tejera L, Cernuschi F. Calidad y origen botánico de mieles del noreste de Uruguay. Revista INIA. 2005;(3):6-7.
7. Corbella E, Cozzolino D. Classification of the floral origin of Uruguayan honeys by chemical and physical characteristics combined with chemometrics. LWT. 2006;39(5):534-9.
8. Gámbaro A, Ares G, Giménez A, Pahor S. Preference mapping of color of Uruguayan honeys. J Sens Stud. 2007;22(5):507-19.
9. Tejera L, Invernizzi C, Daners G. Población y recursos alimenticios en colonias de Apis mellifera L. en Uruguay. Arch Zootec. 2013;62:607-10.
10. Santos EI, Meerhoff E, Da Rosa EG, Ferreira J, Raucher M, Quintana W, Mancebo Y. Color and electrical conductivity of honey produced by Apis mellifera in Uruguay. Innotec [Internet]. 2018 [cited 2022 May 05];16:51-5. doi:10.26461/16.08.
11. Cracco P. Componentes nutricionales y caracterización fisicoquímica de mieles de cuatro regiones del Uruguay [master’s thesis]. Montevideo (UY): Universidad de la República, Facultad de Agronomía; 2019. 69p.
12. Moreni A. Contenido de micronutrientes y capacidad antioxidante en mieles de cuatro regiones fitogeográficas del Uruguay [master’s thesis]. Montevideo (UY): Universidad de la República, Facultad de Agronomía; 2019. 59p.
13. Louveaux J, Maurizio A, Vorwohl G. Methods of melissopalynology. Bee World. 1978;59:139-57.
14. Von Der Ohe W, Oddo LP, Piana ML, Morlot M, Martin P. Harmonized methods of melissopalynology. Apidologie. 2004;35(1):18-25.
15. Paul BN, Chanda S, Das S, Singh P, Padey BK, Giri SS. Mineral assay in atomic absorption spectroscopy. The beats nat sci. 2014;4(1):1-17.
16. Cabrera MC, Ramos A, Saadoun A, Brito G. Selenium, copper, zinc, iron and manganese content of seven meat cuts from Hereford and Braford steers fed pasture in Uruguay. Meat Sci. 2010;84:518-28.
17. UNE. Calidad del agua: determinación de aniones disueltos por cromatografía de iones en fase líquida. Parte 1, Determinación de bromuro, cloruro, fluoruro, nitrato, nitrito, fosfato y sulfato (ISO 10304-1:2007). Madrid: AENOR; 2009. 23p. UNE-EN ISO 10304-1:2009.
18. Di Rienzo JA, Casanoves F, Balzarini MG, González L, Tablada M, Robledo CW. InfoStat [Internet]. Version 2015. Córdoba: Universidad Nacional de Córdoba, Facultad de Ciencias Agropecuarias; 2015 [cited 2022 May 07]. Available from: https://bit.ly/3dDvIyu.
19. RStudio Team. RStudio: Integrated Development for R [Internet]. Boston: RStudio; 2015 [cited 2022 May 07]. Available from: http://www.rstudio.com/.
20. White JW. Honey. Adv Food Res. 1978;24:288-364.
21. Lazarević K, Jovetić M, Tešić Ž. Physicochemical parameters as a tool for the assessment of origin of honey. J AOAC Int [Internet]. 2017 [cited 2022 May 07];100(4):840-51. doi:10.5740/jaoacint.17-0143.
22. Method 998.12: C-4 plant sugars in honey, internal standard stable carbon isotope ratio method. In: Cunniff P, editor. AOAC official methods of analysis. 16th ed. Washington: AOAC Int.; 1999. p. 27-30.
23. Elflein L, Raezke KP. Improved detection of honey adulteration by measuring differences between 13C/12C stable carbon isotope ratios of protein and sugar compounds with a combination of elemental analyzer - isotope ratio mass spectrometry and liquid chromatography - isotope ratio mass spectrometry (δ13C-EA/LC-IRMS). Apidologie. 2008;39:574-87.
24. Bergamo G, Seraglio SKT, Gonzaga LV, Fett R, Costa ACO. Physicochemical characteristics of bracatinga honeydew honey and blossom honey produced in the state of Santa Catarina: an approach to honey differentiation. Int Food Res J. 2019;116:745-54.
25. Nogueira E, Juri P, Invernizzi C. Efecto del jarabe de azúcar en la sobrevivencia larval en colonias de abejas melíferas afectadas por Mal del Río. Veterinaria (Montev.) [Internet]. 2021 [cited 2022 May 07];57:215. doi:10.29155/vet.57.215.2.
26. Ouchemouck S, Louaileche H, Schweitzer P. Physicochemical characteristics and pollen spectrum of some Algerian honeys. Food Control. 2007;18:52-8
27. Solayman M, Asiful I, Sudip P, Yousuf A, Ibrahim K, Nadia A, Siew HG. Physicochemical properties, minerals, trace elements, and heavy metals in honey of different origins: a comprehensive review. Compr Rev Food Sci Food Saf [Internet]. 2019 [cited 2022 May 07];15(1):219-33. doi:10.1111/1541-4337.12182.
28. Bogdanov S, Haldimann M, Luginbühl W, Gallmann P. Minerals in honey: environmental, geographical and botanical aspects. J Apic Res. 2007;46:269-75.
29. Roshan ARA, Gad HA, El-Ahmady SH, Al-Azizi MM, Abou-Shoer MI, Khanbash MS. Characterization and discrimination of the floral origin of sidr honey by physicochemical data combined with multivariate analysis. Food Anal Methods. 2017;10(1):137-46.
30. Jaafar MHM, Hamid KA, Anuar N, Zohdi RM, Effendi TJB. Physicochemical properties and pharmacokinetic profiles of selected Malaysian honey [Internet]. In: 2012 IEEE Symposium on Business, Engineering and Industrial Applications. Danvers: IEEE; 2012 [cited 2022 May 07]. p. 140-5. doi:10.1109/ISBEIA.2012.6422856.
31. Finola MS, Lasagno MC, Marioli JM. Microbiological and chemical characterization of honeys from central Argentina. Food Chem. 2007;100(4):1649-53
32. Taha MME, Abdelwahab SI, Elsanousi R, Babiker SE, Elraih H, Mohamed E, Sheikh BY, Abdulla MA. Effectiveness of Sidr Honey on the prevention of ethanol-induced gastroulcerogenesis: role of antioxidant and antiapoptotic mechanism. Pharmacogn J. 2015;7(3):157-64.
33. Persano Oddo L, Piazza MG, Sabatini AG, Accorti M. Characterization of unifloral honeys. Apidologie. 1995;26:453-65.
34. Rodríguez Flores MS, Escuredo Pérez O, Seijo Coello MC. Characterization of Eucalyptus Globulus Honeys Produced in the Eurosiberian Area of the Iberian Peninsula. Int J Food Prop. 2014;17(10):2177-91.
35. Sorkun K, Doğan C, Başoğlu N. Physicochemical characteristics and composition of Eucalyptus camaldulensis Dehn honey produced in Turkey. Apiacta. 2001;36(4):182-9.
Notes
Author notes

pcracco@gmail.com


Figure 1
Location of the 3 apiaries in the northeastern region of Uruguay Limit between two systems afforestation and protected area
Table 1
Relationship between pollens and honeydew elements HDE of each honey sample

Data ​​represents HDE/pollen ratio and percent of pollen in each honey sample.
Table 2
Means and standard deviations of the minerals analyzed in the 3 honey groups

Different letters in each column mean significant differences p> 0.05 (Tukey-Kramer).
Table 3
Means and standard deviations of conductivity pH and moisture of the 3 groups of honey

Different letters in each column mean significant differences, p> 0.05 (Tukey-Kramer).
Table 4
Means and standard deviations of the color variables of the 3 honey groups

Different letters in each column mean significant differences p> 0.05 (Tukey-Kramer).
Table 5
Means and standard deviations of the analyzed sugars in the 3 honey groups

Different letters in each column mean significant differences p> 0.05 (Tukey-Kramer). nd = not detected

Figure 2
Dendrogram. In blue, honeys from protected area; in red, both groups of honeys from Eucalyptus grandis

Figure 3
PCA Multivariate Analysis In green PA honey in blue EWM honey and in red EM honey
Table 6
Carbon isotopes of a sample composed of honeydew

Buscar:
Contexto
Descargar
Todas
Imágenes
Non-profit publishing model to preserve the academic and open nature of scientific communication
Mobile reader generated through XML-JATS4R