Abstract:
The current
guidelines and recommendations for P fertilization in Uruguay can be improved
by adjusting the sampling depth and analytical methods of testing soil P in
pastures with different fertilization history. A set of field trials was
conducted between 2008 and 2012 on 14 sites of Uruguay for the purpose of
comparing two sampling depths and three methods for assessing P availability by
their correlation with annual dry matter yield response. The trials had a
randomized complete block design and were sown with Trifolium repens or Lotus
corniculatus. Soil P availability was determined
by sampling 0-7.5 and 0-15 cm depth using three analytical methods: Bray I,
cationic resins, and citric acid. Rock phosphate and triple superphosphate were
applied at five P rates. (0-240 kg kg P2O5
ha-1). Annual forage yield was recorded. Relative yield was
calculated as measured yield/maximum yield observed within a block. The
correlation between relative yield and soil P availability was studied using
the modified arcsine-logarithm calibration curve (ALCC) and analyzing the
resulting correlation coefficient, root-mean-square error (RMSE) of the soil P
test, and RMSE of the relative yield. The 0-7.5 cm soil
sampling depth did not show a better fit than the deeper sampling (0-15 cm),
with the latter having less variation in soil P test values. When rock
phosphate was used, the correlation coefficients were 0.50 for cationic resins,
0.53 for citric acid, and 0.38 for Bray I. When triple superphosphate was used,
the correlation coefficients were 0.37 for cationic resins, 0.44 for citric
acid and 0.43 for Bray I. For both P sources, the citric acid method with the sampling
of 0-15 cm soil depth is the preferred soil P test method for management of P
in leguminous pastures for the soils studied.
Keywords: Bray I,cationic resin,citric acid,correlation,pastures,soil P test.
Resumen:
En Uruguay, se reconoce que las pautas y las recomendaciones vigentes para la fertilización fosfatada de pasturas pueden mejorarse a través de un ajuste de la profundidad de muestreo y los métodos analíticos para determinar el fósforo (P) extractable en suelo. El objetivo de este trabajo fue comparar dos profundidades de muestreo y tres métodos de extracción de P en suelo, a través de su correlación con la respuesta vegetal. Los experimentos fueron realizados entre los años 2008 y 2012, en 14 sitios de Uruguay, sobre pasturas de Trifolium repens y Lotus corniculatus fertilizadas con roca fosfórica y superfosfato triple. Se determinó anualmente la disponibilidad de P en el suelo a 0-7,5 y 0-15 cm de profundidad, con tres métodos analíticos: Bray I, resinas catiónicas y ácido cítrico. Se midió anualmente el rendimiento de forraje. La profundidad de muestreo del suelo 0-7,5 cm no mostró un mejor ajuste que el muestreo más profundo (0-15 cm), teniendo este último una menor variación en los valores de análisis de suelo. Cuando se usó roca fosfórica, los coeficientes de correlación fueron 0,50 para resinas catiónicas, 0,53 para ácido cítrico y 0,38 para Bray I. Cuando se usó superfosfato triple, los coeficientes de correlación fueron 0,37 para resinas catiónicas, 0,44 para ácido cítrico y 0,43 para Bray I. Para ambas fuentes de P, el método de ácido cítrico, con muestreo de 0-15 cm de profundidad, es el que mejor se ajusta en la determinación del P extractable, para el conjunto de los suelos evaluados.
Palabras clave: Bray I, resina catiónica, ácido cítrico, correlación, pasturas.
Resumo:
No Uruguai, é reconhecido que os parâmetros e recomendações vigentes para a fertilização fosfatada de pastagens podem ser aprimoradas através de um ajuste da profundidade de amostragem e dos métodos analíticos para determinar fósforo (P) extraível do solo. O objetivo deste trabalho foi comparar duas profundidades de amostragem e três métodos de extração de P do solo e correlacionar com a resposta vegetal. Os experimentos foram realizados entre os anos de 2008 e 2012, em 14 campos de Uruguai, sobre pastagens formadas por Trifolium repens e Lotus corniculatus, fertilizadas com rocha fosfatada e superfosfato triplo. Anualmente foi determinada a disponibilidade de P em diferentes profundidades do solo, 0-7,5 e 0-15 cm, com três métodos de analíticos: Bray I, resinas catiônicas e ácido cítrico; além do rendimento de forragem. A profundidade de amostragem do solo de 0-7,5 cm não mostrou melhor correlação com a resposta vegetal na comparação com amostragem mais profunda (0-15 cm), apresentando esta última menor variação nos valores das análises de solo. Quando foi usado rocha fosfatada, os coeficientes de correlação foram 0.50 para resina catiônica, 0.53 para acido cítrico e 0.38 para Bray I. Entretanto, quando usado superfosfato triplo, os coeficientes de correlação foram 0.37, 0.44 e 0.43 para os métodos de resina catiônica, acido cítrico e Bray I, respectivamente. Para ambas as fontes de P o método de acido cítrico, com amostragem de 0-15 cm de profundidade, foi o que melhor se ajustou a determinação de P extraível, em os solos avaliados.
Palavras-chave: Bray I, resina catiônica, ácido cítrico, correlação, pastagens.
Carátula del artículo
Natural and environmental resources
Soil sampling depth and phosphorus extraction method for phosphorus in leguminous pastures
Profundidad de muestreo del suelo y método de extracción de fósforo en
pasturas de leguminosas
Profundidade de amostragem e método de extração de
fósforo em solos com pastagens de leguminosas
 Cuadro
,
R. rcuadro@inia.org.uy
Instituto
Nacional de Investigación Agropecuaria (INIA), Uruguay
Cadenazzi,
M.
Universidad
de la República, Uruguay
Quincke,
J. A.
Instituto Nacional de Investigación Agropecuaria (INIA), Uruguay
Agrociencia Uruguay
Universidad de la República, Uruguay
ISSN-e: 2730-5066
Periodicity: Bianual
vol. 26, no. 1, e954, 2022
Received: 05 August 2021
Accepted: 07 January 2022
Published: 02 March 2022
Corresponding author: rcuadro@inia.org.uy
1. Introduction
Under certain management conditions, soil P availability often becomes vertically stratified within the 0-15 or 0-20 cm depth, with decreasing availability with depth(1)(2)(3)(4). Broadcast P fertilization with no incorporation contributes to this high P stratification(5). It has been hypothesized that under such conditions sampling at shallower depths compared with the traditional sampling depths of 0-20 cm relates better to yield response to applied P(6). Adetunji(7) addressed this hypothesis for maize on tropical alfisols and found that the correlation between soil test P and maize P uptake was similar for sampling the 0-10 cm compared with the 0-20 cm depth.
The relative accuracy of different soil test methods for P availability varies with soil types and P management conditions(8). Among the dilute strong acid extractants, the Bray I method(9) has been widely adopted mostly for acid-neutral soils of both North and South America that are fertilized with soluble P sources(10)(11). Phosphorus sink-based tests, such as anion-cation exchange resins, were predictors of response to P for a variety of soil conditions(12) and for pastures fertilized with sparingly soluble P fertilizers(13). Among the dilute weak acids, the citric acid method was initially proposed by Dyer(14), and more recently studied in pot experiments(15), leguminous pastures(16), flooded rice systems(17), and forest systems(18). In these studies, the correlation of citric acid P with P uptake or relative yield compared well with other soil tests, such as Bray I. Crop response to rock phosphate can be similar to triple superphosphate under some conditions(19)(20)(21). The preferred soil P test method can differ with the applied P source(22)(23).
To assess the correlation between the soil test value and crop yield, regression models are usually adjusted with the pasture's relative yield (RY) with P applied compared to no P application, using the ordinary least squares method. In this method RY is dependent and random, and soil test method is assumed independent, fixed and error-free. However, the soil P test value is not fixed as it is not controlled by the researcher(24). To cope with this joint bivariate distribution(25), Dyson and Conyers(26) proposed the Arcsine Logarithm Calibration Curve (ALCC) method to determine soil test critical levels for nitrogen (N), P, potassium (K) and sulphur (S), as well as yield response potential in several crops.
Optimizing the choice of soil sampling depth and the soil test method for P availability will allow a more reliable management of P fertilization of pastures for increased net returns to fertilizer P and agronomic efficiency, while reducing the potential for P loss to the environment. The objective of this study was to evaluate two soil sampling depths and three test methods by comparing the goodness of fit between extractable soil P and the annual yield response of two forage legumes. The hypotheses were: a) that soil P test from a lower sampling depth (0-7.5 cm) correlates better with pasture yield response than when sampling at 0-15 cm depth; and b) that the citric acid method correlates better than the Bray I and the resin methods under different soil types and P fertilizer sources.
2. Materials and methods
2.1 Site description and trial design
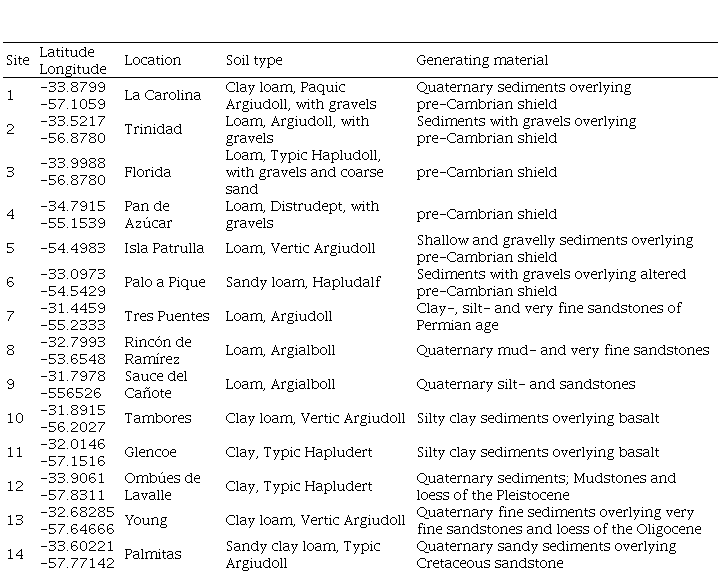
The study was a set of field trials conducted from 2008 to 2012 at 14 sites in different regions of Uruguay to evaluate the response of Lotus corniculatus (LC) and Trifolium repens (TR) pastures to applied P (Table 1). (Table 1, in Supplementary material)
Table 1
Percentage of sand silt and clay soil pH in water and soil P test using Bray I citric acid and cationic resins as extraction methods (PBray, PCitric and PResins) for the experimental sites at the beginning of this study
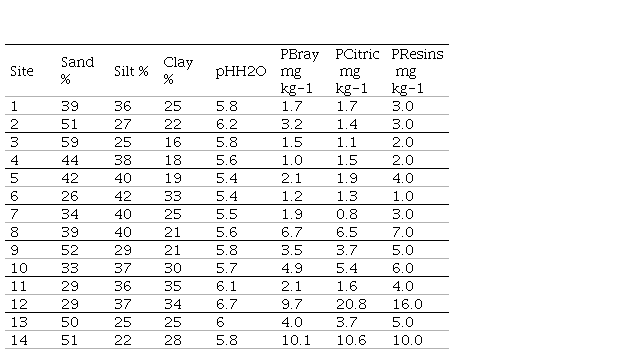
Pastures were established in 2008 by broadcast sowing after a chemical control of the native grassland. Due to a poor plant stand, the pastures had to be reestablished in the second year. The soil textures ranged from clay to sandy loam, and the soil pH ranged from 5.4 to 6.7. Sites with no history of fertilization and low levels of extractable soil P with natural grassland as their previous pasture were selected. Sites 12 and 14, however, did have some previous P inputs, with Bray I P of about 10 mg kg-1 compared with 1.0 to 6.7 mg kg-1 for other sites. Site 12 possibly received P via excreta due to temporal cattle concentration. Site 14 possibly had a history of fertilization associated with previous annual crop-pasture rotation.
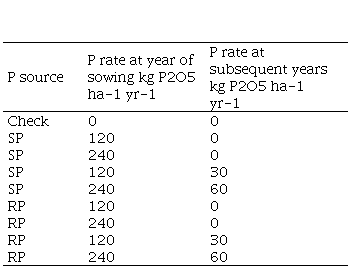
The trials had a randomized complete block design with four replications. Plot size was 10 m. (2*5m). Broadcast application of triple superphosphate (SP, 0-46-0) and Algerian rock phosphate (RP, 0-29-0) were compared at different annual rates (Table 2). The RP was ground to a mesh of 100 mm and 10% P rendered soluble in a 2% citric acid solution.
Table 2
Phosphorus rates kg P2O5ha-1 yr-1 using broadcast applications of superphosphate SP or rock phosphate RP at year of sowing and at subsequent years as fall topdressed refertilizations
2.2 Data collection and analysis
In March-April of each year, soil samples were collected from each plot (20 cores per composite sample) for the 0-7.5 cm and 7.5-15.0 cm depths, and analyzed for P availability by Bray I(9), cationic resins(27) and citric acid(14)(Table 3). Soil P content at 0-15 cm depth was calculated as the mean extractable P of the two sampling depths.
Table 3
Main methodological aspects of the three soil phosphorus tests used in the present study Bray I Cationic resins and Citric acid
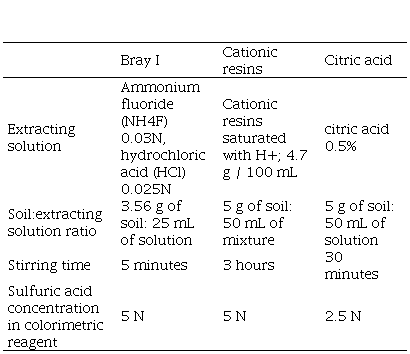 Note: techniques were slightly modified from
the original studies in all cases.
Note: techniques were slightly modified from
the original studies in all cases.
Annual forage production was calculated for years 2 and 3 from seasonal yield determinations using a mower to a height of 5 cm. Dry matter yield was obtained from oven-drying subsamples at 105 °C and then corrected by percent cover of either LC or TR. Year 4 was also determined for sites 4 and 7. Considering the plot with the highest yield in each block for each source as 100%, the annual relative yield (RY) of each plot was calculated for each year as RY= measured plot yield/maximum yield at each block.
The first step of the statistical analysis was to study the relationship between soil test value (STV) and RY for each year by fitting models of linear regression with the arcsine-logarithm calibration curve (ALCC) method, as modified by Correndo and others(28). A Microsoft Excel® spreadsheet was used as a model adjustment tool, designed for this purpose with the name "Modified ALCC Tool”(29). Response curves were adjusted for subsets partitioned by site, species, depth, method, source, and year, which resulted in 696 regression curves. A total of 497 curves were selected as statistically significant (p<0.05) (Table 4), as suggested by Correndo and others.(28)
Through the model of Correndo and others(28) the following statistics of adjustment are obtained: coefficient of determination (r2), root-mean-square error of the relative yield (RMSE RY) and of the soil test value (RMSE STV).
In the second step, a mixed model was applied, with site and species as random effects, while depth, method, source and their interactions were considered as fixed effects.
The assumption of normality was previously validated by the Q-Q plot (r2=0.998) and the Shapiro-Wilks test (p=0.378) based on the analysis of the model's residuals, confirming the normal distribution of the errors. The Levene test (p=0,067) confirmed that the variances were homogeneous. For the root-mean-square error of the relative yield (RMSE RY) and of the soil test value (RMSE STV), a non-parametric analysis of variance (Kruskal-Wallis) was performed. Statistical analyses were performed with the InfoStat software(30).
Table 4
Number of calibration curves generated with ALCC method and number of selected curves p005 for further analysis according to the three factors of variation evaluated soil P test method sampling depth and P source
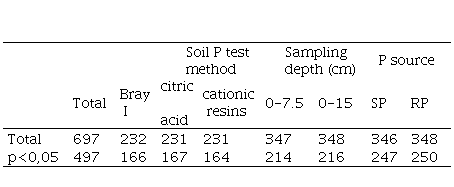 Note: SP: superphosphate; RP: rock phosphate.
Note: SP: superphosphate; RP: rock phosphate.
2.3 Transparency of data
Data not available: The data set that supports the results of this study is not publicly available.
3. Results
The annual forage yields ranged from 0 to 12838 with a mean of 4306 kg DM ha-1 LC, and from 0 to 13590 with a mean of 3866 kg DM ha-1 TR. The coefficients of determination (r2) recorded in the present study ranged from 0.25 to 0.86. Previous studies based on the ALCC method (Dyson and Conyers, 2013) reported that most coefficients of determination ranged between 0.06 and 0.49, although these authors did not filter for significant response curves.
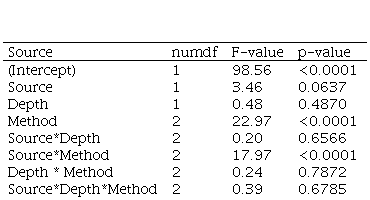
The mixed model analysis was performed using compound symmetry, first-order autoregressive and autoregressive integrated moving average (ARIMA) error correlation structures. The ARIMA model was the most efficient of the three models, presenting the lowest AIC and BIC values and the highest loglik. Results obtained using the latter error correlation structure are presented in Table 5.
Table 5
Marginal hypothesis tests SC type III for the coefficient of determination r2 obtained from calibration curves between soil P test and dry matter yield
3.1. Effect of soil sampling depth on goodness of fit between extractable P and forage yield response
Sampling depth and its interactions did not affect the r2 of the calibration curves between soil test P availability and forage yield (Table 5).
The RMSE STV was less with 0-15 cm compared with 0-7.5 cm soil samples (Table 6), but RMSE RY was not affected by sample depth.
Table 6
Coefficient of determination (r2) rootmeansquare error of the soil test value (RMSE STV) and rootmeansquare error of the relative yield RMSE RY from calibration curves between soil P test and dry matter yield for the two soil sampling depths
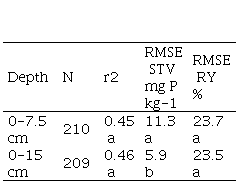 Note: analysis
of variance for r2; Kruskal-Wallis analysis for RMSE
STV and RMSE RY. Means with a common letter for the same column were not
significantly different (p>0.05).
Note: analysis
of variance for r2; Kruskal-Wallis analysis for RMSE
STV and RMSE RY. Means with a common letter for the same column were not
significantly different (p>0.05).
3.2 Effect of soil test method and P source on goodness of fit between extractable P and forage yield response
The coefficient of determination was affected by soil test method and its interaction with P source but not with sampling depth (Table 5). For SP fertilizations, the citric acid and Bray I methods did not differ for the r2 and RMSE STV, while the cationic resins method had the lowest r2 and highest RMSE STV (Table 7). Citric acid has a slightly higher RMSE RY than cationic resins and Bray I.
Table 7
Coefficient of determination (r2) root mean square error of the soil test value (RMSE STV) and rootmeansquare error of the relative yield RMSE RY from calibration curves between soil P and dry matter yield as affected by soil P test method and P source
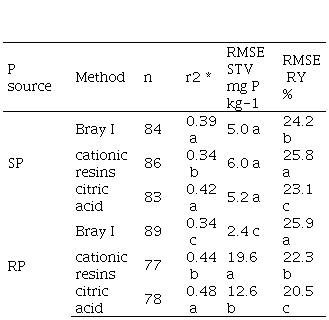 * Means with a common letter for the same source and in the same column were not significantly different p005 Note SP superphosphate RP rock phosphate
When RP was used, citric acid and cationic resins showed higher r2 values than Bray I. Bray I had the lowest and cationic resins had the highest RMSE STV. RMSE RY was highest for Bray I and lowest for citric acid.
3.3. Correlation between the different soil P test
The correlations between the different soil P test methods for RP were lower than those for SP (Table 8). For both RP and SP, the correlation between cationic resins and citric acid was higher than the correlations of Bray I with the cationic resins and citric acid methods.
Table 8
Pearson's correlation coefficients (r) between the different soil P test methods (Bray I citric acid and cationic resins) when soils were fertilized with rock phosphate (RP) or superphosphate (SP)
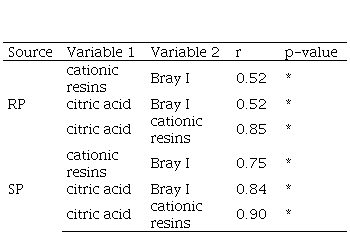 * Significant differences, p<0.05.
* Significant differences, p<0.05.
4. Discussion
In some studies, r2 values for STV with RY were higher for 0-10 cm compared with 0-20 cm soil sampling(31). In the present study, however, there was a similar correlation between the pasture RY and extractable soil P for the 0-7.5 cm and 0-15 cm sampling depths, which is in agreement with other results for different crops(32)(33)(34)(35)(36)(37). Soil test depth might have more effect with greater vertical stratification of available P(36). Although plants may respond to stratification by adapting their root mass growth according to the vertical distribution of available P(38)(39)(40), both LC and TR typically show root growth throughout the 0-15 cm depth in absence of physical or chemical barriers(41)(42).
Del Pino and Ruiz(32) reported that the coefficient of variation for the STV was higher for the 0-7,5 cm sampling depth than for 0-15 cm, and concluded that the shallow sampling depth was subject of a greater sampling error. The first centimeters of soil are exposed to a greater variation in moisture and temperature throughout the year, which directly relates with variability due to mineralization and immobilization processes(43). The present study was not intended for measuring the sampling error. However, the higher values of RMSE STV found for the 0-7.5 cm would be consistent with a greater sampling error (Table 6).
The differences between the analytical methods are related to the nature of the extracting agent in each case and to the respective physicochemical mechanisms to remove or "solubilize” P from the soil matrix(44)(45). The possible mechanisms are the following: the action of acid solvents, the substitution of the phosphate anion by other anions, the formation of compounds with polyvalent cations bound to P (Ca-P, Al-P, and Fe-P), and the hydrolysis of those cations bound to P(44).
When P is added from soluble sources such as triple superphosphate, Bray I has a stronger lineal association with citric acid than with cationic resins, which is reflected in the correlations shown in Table 8 (r=0.84 and 0.75, respectively). In addition to P-bound cations, cations in the soil’s exchange complex can also be exchanged with the resins’ hydrogen ions, providing, in turn, additional P solubilization capacity. Therefore, cationic resins may have a stronger extraction of soil P on certain soils, as reported also by Casanova and others(46). However, a significant amount of the resin-extractable P would not be actually plant-available, which is reflected in both a lower determination coefficient and a higher RMSE RY for cationic resins in Table 7.
When P is added from sparingly soluble sources such as phosphate rock, Bray I shows a low capacity to extract P bound to Ca from that source(47). In this method, P extraction takes place by the effect of fluoride, which forms compounds with iron (Fe) and aluminium (Al), leaving P in soluble form. Additionally, the acidity dissolves a reactive fraction of calcium phosphates. However, this does not prevent from P being adsorbed to calcium carbonate or hydrated oxides of Fe or Al during the extraction procedure. In addition, calcium carbonate in soil may partly neutralize the extractant´s acidity, thus reducing its capacity for solubilizing phosphate(46). In calcareous soils or in RP- fertilized soils, solubilized Ca may react with P to form insoluble compounds, removing P from the solution(44). This low P extractability of Bray I when RP is used results in very low values of RMSE STV (Table 7). However, legumes have the capacity to solubilize complex P compounds by releasing organic acids (malate, citrates and oxalates) from their roots, which makes them highly efficient when rock phosphate is used as a source of P(48)(49). This results in a poor correlation between Bray I and plant response and is demonstrated with a low r2 in Table 7.
In the citric acid method (as well as in other methods based on weak acids) P is rendered extractable through the formation of compounds with polyvalent cations, in this case with the citrate anion(44). In addition, the citrate acts by anionic substitution, releasing the adsorbed P and preventing P reabsorption. This makes the citric acid method suitable for soils containing a significant amount of Ca-P, as it occurs with RP fertilization. This would explain the better adjustment of citric acid versus Bray I when RP is used as the source of P.
In the cationic resins method, the mechanism for solubilizing P operates by fixing cations (Fe, Al, Ca) to the cationic resins, with a similar result to that of compound formation. Additionally, as it is an exchange process, hydrogen ions (H+) are released, acidifying the medium, and adding the solvent action of acidity on a reactive fraction of calcium phosphates(27)(50). Cationic resins and citric acid seem to have similar capacity to extract P-Ca, therefore evidencing a high correlation between them (Table 8) and slight differences in their relation with plant response (Table 7).
5. Conclusions
For the case of unmixed soils with broadcast application of P, shallow sampling (0-7.5 cm) did not evidence a better adjustment between relative pasture yield and soil P test values than deeper sampling (0-15 cm), with the latter showing less variation in soil P test values. Therefore, the recommended soil sampling depth for no-till pastures with broadcast fertilization should not be different from the traditional 0-15 cm depth.
The citric acid method generally evidenced a good performance for all soils and both P sources. It can be inferred that the citric acid method extracts a proportion of available soil P that is well correlated with the amount of P absorbed by the plants to produce forage.
For the ranges of soil’s physicochemical properties analyzed, this study provides evidences for soil P testing procedures to better assess plant available P for leguminous pastures. However, critical levels should be developed for an adequate interpretation of soil P test values according to pasture and soil types. This would allow for improved P fertilization recommendations in pastures.
Appendices
Supplementary
material
Table 1
Identification and edaphic
characteristics of the experimental sites of this study
Additional information
Author contribution statement: RC: collected and analyzed the data,
interpreted the results, and wrote the article; MC: contributed to the analysis
of the data; AQ: performed the conceptualization of the experiment, data
analysis, interpretation of results and edited the article.
Editor: The following editor approved this article. Mónica M. Barbazán (https://orcid.org/0000-0002-0028-4870) Universidad de la República, Facultad de Agronomía, Montevideo,
Uruguay
References
1. Murphy WE, Culleton N. Distribution of available phosphorus in soil under long term grassland. In: Tunney H, Carton OT, Brookes PC, Johnston AE, editors. Phosphorus Loss from Soil to Water. Wallingford: CAB International Publications; 1997. p. 448-9.
2. Humphreys J, Tunney H, Duggan P. Soil phosphorus determination using three extraction procedures, the effect of sampling depth and comparison of phosphorus fertiliser recommendations for grassland. Ir J Agric Food Res. 1998;37(1):29-38.
3. Mallarino A, Borges R. Phosphorus and Potassium Distribution in Soil Following Long-Term Deep-Band Fertilization in Different Tillage Systems. Soil Sci Soc Am J. 2006;70:702-7.
4. Owens P, Deeks L, Wood G, Betson E, Lord E, Davison P. Variations in the depth distribution of phosphorus in soil profiles and implications for model-based catchment-scale predictions of phosphorus delivery to surface waters. J Hydrol. 2008;350(3-4):317-28.
5. Robbins S, Voss R. Phosphorus and potassium stratification in conservation tillage systems. J Soil Water Conserv. 1991;46(4):298-300.
6. James D, Wells K. Soil sample collection and handling: technique based on source and degree of field variability. In: Westerman RL, editor. Soil testing and plant analysis. Madison: Soil Science Society of America; 1990. p. 25-44.
7. Adetunji MT. Optimum sample size and sampling depth for soil nutrient analysis of some tropical soils. Commun Soil Sci Plant Anal. 1994;25(3-4):199-205.
8. Bachmeier A, Rollán A. Fósforo extractable en un suelo Haplustol éntico del área semiárida central de Córdoba, Argentina: comparación de dos métodos de evaluación. AgriScientia. 1994;11:23-8.
9. Bray R, Kurtz T. Determination of total, organic and available forms of phosphorus in soils. Soil Sci. 1945;59:39-45.
10. Mallarino A, Atia A. Correlation of a resin membrane soil phosphorus test with corn yield and routine soil tests. Soil Sci Soc Am J. 2005;69(1):266-72.
11. Marino M, Echeverría H. Diagnóstico de requerimiento de fósforo para alfalfa (Medicago sativa L.) en argiudoles. Agriscientia. 2018;35(1):11-24.
12. Da Silva FC, van Raij B. Disponibilidade de fósforo em solos avaliada por diferentes extratores. Pesq Agropec Bras. 1999;34(2):267-88.
13. Saggar S, Hedley MJ, White RE, Perrott KW, Gregg PEH, Cornforth IS, Sinclair AG. Development and evaluation of an improved soil test for phosphorus, 3: field comparison of Olsen, Colwell and Resin soil P tests for New Zealand pasture soils. Nutr Cycl Agroecosyst. 1999;55:35-50.
14. Dyer R. On the analytical determination of probable available mineral plant food on soils. J Chem Soc Trans. 1894;65:115-67.
15. Simard R, Sen Tran T, Zizka J. Strontium Chloride-Citric Acid Extraction Evaluated as a Soil-Testing Procedure for Phosphorus. Soil Sci Soc Am J. 1991;55:414-21.
16. Morón A. Relevamiento del estado nutricional y la fertilidad del suelo en cultivos de trébol blanco en la zona Este de Uruguay. In: Seminario de Actualización Técnica: fertilización fosfatada de pasturas en la región este. Treinta y Tres: INIA; 2004. p. 17-31. (Actividades de Difusión; 356).
17. Hernández J, Berger A, Deambrosi E, Lavecchia A. Phosphorus Soil Tests for Flooded Rice Grown in Contrasting Soils and Cropping. Commun Soil Sci Plant Anal. 2013;44:1193-210.
18. Fäth J, Mellert K, Blum U, Göttlein A. Citric acid extraction: an underestimated method in forest nutrition? J Plant Nutr Soil Sci. 2019;182:691-3.
19. Chien S, Menon G. Factors affecting the agronomic effectiveness of phosphate rock for direct application. Fert Res. 1995;41:227-34.
20. Shigaki F, Sharpley A. Phosphorus source and soil proprieties effects on phosphorus availability. Soil Sci. 2011;176(9):502-7.
21. Risso D, Cuadro R, Morón A. Respuesta de un mejoramiento de campo a estrategias de fertilización fosfatada sobre un suelo de basalto. In: Alternativas tecnológicas para los sistemas ganaderos del basalto. Montevideo: INIA; 2014. p. 35-53. (Serie Técnica; 217).
22. Bolland M, Allen D, Gilkes R. The influence of seasonal conditions, plant species and fertilizer type on the prediction of plant yield using the Cowell bicarbonate soil test for phosphate. Fertil Res. 1989;19:143-58.
23. Bolland M, Gilkes E. Colwell soil test as predictors of triticale grain production on soil fertilized with superphosphate and rock phosphate. Fertil Res. 1992;31:363-72.
24. Webster R. Regression and functional relations. Eur J Soil Sci. 1997;48:557-66.
25. Legendre P, Legendre L. Interpretation of ecological structures. In: Numerical ecology. 2nd ed. Amsterdam: Elsevier; 1998. p. 497-545.
26. Dyson C, Conyers M. Methodology for online biometric analysis of soil test–crop response datasets. Crop Pasture Sci. 2013;64:435-441.
27. Zamuz E, Castro L. Evaluación de métodos de análisis de suelo para determinar fósforo asimilable. Boletín Técnico (CIAAB). 1974;(15):15p.
28. Correndo A, Salvagiotti F, García F, Gutiérrez Boem H. A modification of the arcsine-log calibration curve for analyzing soil test value-relative yield relationships. Crop Pasture Sci. 2017;68:297-304.
29. Correndo A, Salvagiotti F, García F, Gutiérrez Boem H. Modified ALCC Excel Tool v3 [Internet]. 2017 [cited 2022 Feb 15]. Available from: https://bit.ly/3GPhess.
30. Di Rienzo JA, Casanoves F, Balzarini MG, González L, Tablada M, Robledo CW. InfoStat [Internet]. Version 2018. Córdoba: Universidad Nacional de Córdoba, Facultad de Ciencias Agropecuarias; 2018 [cited 2022 Feb 15]. Available from: https://bit.ly/3dDvIyu.
31. Schlindwein J, Bortolon L, Fioreli E, Oliverira E, Gianello C. Phosphorus and potassium fertilization in no till southern Brazilian soils. J Agric Sci. 2013;4(12):39-49.
32. Del Pino A, Ruiz A. Muestreo de suelo para recomendaciones de fertilización de pasturas convencionales [grade’s thesis]. Montevideo (UY): Universidad de la República, Facultad de Agronomía; 1986. 88p.
33. Mallarino A. Spatial variability patterns of phosphorus and potassium in no-tilled soils for two sampling scales. Soil Sci Soc Am J. 1996;60:1473-81.
34. Bordoli M, Mallarino A. Deep and shallow banding of phosphorus and potassium as alternatives to broadcast fertilization for no-till corn. Agron J. 1998;90:27-33.
35. Bordoli M, Quincke A, Marchesi A. Fertilización fosfatada de trigo en siembra directa. In: Actas del XIX Congreso de la AACS; Paraná, Argentina. [place unknown]: [publisher unknown]; 2004. CD-ROM
36. Zamuner E, Picone L, Echeverria H. Comparison of phosphorus fertilization diagnostic methods for wheat under no-tillage. Soil Tillage Res. 2006;89(1):70-7.
37. Barbagelata P, Melchori R. Fertilización fosfatada para trigo en siembra directa en entre ríos: diagnóstico de fertilidad y estrategias de fertilización. In: Actualización técnica 1: Cultivos de invierno. Paraná: INTA; 2010. p. 71-8.
38. Pothuluri J, Kissel D, Whitney D, Thien S. Phosphorus Uptake from Soil Layers Having Different Soil Test Phosphorus Levels. Agron J. 1986;78(6):991-4.
39. Barber J, Stanley A. Nutrient Absorption by plant roots. In: Barber J, Stanley A, editor. Soil nutrient bioavailability: a mechanistic approach. Canada: John Wiley and Sons; 1995. p 85-110.
40. Holanda F, Mengel D, Paula A, Carvhalo J, Bertoni J. Influence of crops rotations and tillage systems on phosphorus and potassium stratification and root distribution in the soil profile. Commun Soil Sci Plant Anal. 1998;29:2383-94.
41. Evans P. Comparative root morphology of some pasture grasses and clovers. New Zealand J Agric Res. 1978;20:331-5.
42. Lodge G, Murphy S. Root depth of native and sown perennial grass-based pastures, North-West Slopes, New South Wales: 1. Estimates from cores and effects of grazing treatments. Austr J Exp Agric. 2006;46(3):337-45.
43. Stewart J, Tiessen H. Dynamics of soil organic phosphorus. Biogeochemistry. 1987;4:41-60.
44. Kamprath E, Watson M. Conventional Soil and Tissue Tests for Assessing the Phosphorus Status of Soils. In: Khasawneh FE, Sample EC, Kamprath EJ, editors. The Role of Phosphorus in Agriculture. Madison: ASA; 1980. p 434-69.
45. Mallarino A. Field calibration for corn of the Mehlich-3 soil phosphorus test with colorimetric and inductively-coupled plasma emission spectroscopy determination methods. Soil Sci Soc Am J. 2003;67:1928-34.
46. Casanova O, Genta H, Mallarino A. Evaluación del comportamiento de cinco métodos para estimar fosforo asimilable en suelos del Uruguay [grade’s thesis]. Montevideo (UY): Universidad de la República, Facultad de Agronomía; 1975. 55p.
47. Chang S, Jackson M. Fractionation of soil phosphorus. Soil Sci. 1957;84:133-44.
48. Lambers H, Raven J, Shaver G, Smith S. Plant nutrient acquisition strategies change with soil age. Trends Ecol Evol. 2008;23:95-103.
49. Neumann G, Römheld V. The Release of Root Exudates as Affected by the Plant Physiological Status. In: Pinton R, Varanini Z, Nannipieri P, editors. The Rhizosphere: Biochemistry and Organic Substances at the Soil-Plant Interface. Boca Raton: CRC Press; 2007. p. 23-72.
50. Morón A. El fósforo en el sistema suelo-planta. Rev INIA. 1992;1(1):45-60.
Notes
Author notes
rcuadro@inia.org.uy


