


Eco Intensificacion
Stimulating Tropical Soils with Na+ Cl- Radicals and Reclamation of Na+ Cl- Salinity Using Biochar and Hydro-Leaching Technology: A Sustainable Strategy for Management of Saline and Sodic Soils Under Climate Change
Estimulación de suelos tropicales con iones Na+ Cl- y recuperación de la salinidad Na+ Cl- utilizando tecnología de biocarbón e hidrolixiviación: una estrategia sostenible para la gestión de suelos salinos y sódicos bajo el cambio climático
Revista Iberoamericana de Bioeconomía y Cambio Climático
Universidad Nacional Autónoma de Nicaragua, León, Nicaragua
ISSN-e: 2410-7980
Periodicity: Semestral
vol. 8, no. 16, 2022
Received: 08 August 2022
Accepted: 01 October 2022
Funding
Funding source: OCP Africa, under Phase two (2) of the GrantNumber: 006.
Contract number: 006
Award recipient: Monday Sunday Adiaha
Corresponding author: sundaymonday@niss.gov.ng

Abstract: Humanity suffered far-more-than 80% increase in environmental-climatic-ecosystem-degradation. As a modality towards sustainable-solution to salt-soil toxicity with climate-change, and for the reclamation/management of global Salt Affected-Soils, this study investigated soil-salinity status with the objectives of x-raying sustainable approaches for the management and reclamation of salt-affected soils. Stimulations and laboratory studies were conducted to induce soil samples with 70g of Na+Cl- radicals which follow a reclamation procedure with 70 g of biochar technology and leaching with one (1) liter of distilling water. Results indicated the two reclamation strategies were able to reclaim soils induced with Na+Cl- radicals at a Coefficient of Variation value at (CV=62%) which indicated a high variability potential in the reclamation technology. Forecasting results indicated that the area could remain free of salt, but if unsustainable practices like the application of untreated wastewater for irrigation, then a percentage at a high dosage of salt (4.3 dS/m for Na+Cl-) could result as observed during the inducement stage of this experiment. Biotechnical tools like Biochar at 70g are recommended for reclamation at a pot stage of salinity influence, and at a larger dosage for larger fields, as this could drive sustainable soil-productivity.
Keywords: Salt-affected soil, Biotechnical Tools, Hydro-leachingTechnology, Biochar Technology, Clean Mechanism, Sodic-soil sequestration.
Resumen: La humanidad ha sufrido un aumento de más del 80% en la degradación del medio ambiente-climático-ecosistema. Como una modalidad hacia la solución sostenible de la toxicidad del suelo salino con el cambio climático, y para la recuperación/gestión de los suelos globales afectados por la sal, este estudio investigó el estado de la salinidad del suelo con los objetivos de radiografiar los enfoques sostenibles para la gestión y recuperación de los suelos afectados por la sal. Se realizaron estímulos y estudios de laboratorio para inducir muestras de suelo con 70 g de radicales Na+Cl- que siguen un procedimiento de recuperación con 70 g de tecnología de biochar y lixiviación con un (1) litro de agua de destilación. Los resultados indicaron que las dos estrategias de recuperación fueron capaces de recuperar los suelos inducidos con radicales Na+Cl- con un valor de Coeficiente de Variación de (CV=62%) que indicaba un alto potencial de variabilidad en la tecnología de recuperación. Los resultados del pronóstico indicaron que el área podría permanecer libre de sal, pero si las prácticas insostenibles como la aplicación de aguas residuales no tratadas para el riego, entonces un porcentaje a una alta dosis de sal (4,3 dS/m para Na+Cl-) podría resultar como se observó durante la etapa de inducción de este experimento. Se recomiendan herramientas biotécnicas como el biocarbón a 70g para la recuperación en una etapa de influencia de la salinidad, y a una dosis mayor para campos más grandes, ya que esto podría impulsar la productividad sostenible del suelo.
Palabras clave: Suelo afectado por la sal, Herramientas biotécnicas, Tecnología de hidrolixiviación, Tecnología del biocarbón, Mecanismo limpio, Secuestro del suelo sódico.
1. INTRODUCTION
It is a far cry that disease outbreak, death, malnutrition including high-flux of migration has been recorded in lands of the global community affected with salts. The continual pilled-up of these soluble salts has over the years been geared by unsustainable land management, unsustainable agriculture including the vagrancies in the earth climatic system, which has worsen the hardship faced in many lands of the earth. With the increasing frequency in salt pollution-climatic variability nexus, more than 75% possibility in a worst-case scenario been projected (FA0, 2020). Rapid increase in environmental degradation aligning with soil-salt toxification and deforestation at a rate of above 80% has occurred in Asia. Also, above 50% painful experience has been faced in Africa relating to salty-lands which has geared migration and intensify the already dry-nature of the African continent, thereby altering habitats, degrade and natively manipulate the ecosystem towards unsustainability, while impacting on the lives-nutrition-economic nexus of the region (Abel et.al., 2019; International Institute of Applied System Analysis, 2019). This list is inexhaustive and heart-broken, presenting a view that if sustainable remediation is not taken then we will have more malnourished and sick people in years to come, our environment will be more polluted and toxic, our water system will become more and more difficult to remediate, there could be increase in local, national and international conflict among other unforeseen unpleasant happenings.
Soil salinity has emerged as the most significant problem of present-day agriculture especially as scanty of rainfall coupled with high temperature driven by climatic change which over the years and more devasting now has cause huge down-turn on Agricultural production and on soil functionality and sustainability.
The salinization, or development of salt affected soils (saline and sodic), is a degradation process usually leading to desertification of lands. In general, in salt affected soils the water deficits make the survival of natural vegetation and crops difficult or impossible. These moisture deficits are due to the difficulties for the plants to use the water stored in the soil ("saline soils"), or to the difficulties for root development and for water infiltration into the soil ("sodic soils"). Although those processes may occur and have occurred under natural conditions, they become accelerated, leading to secondary salinization, when, mainly in arid and semiarid environments, the soil water regime is drastically changed with the introduction of irrigation and/or drainage.
In many countries, irrigation has become a very important component of food production, sometimes the most important. The areas with irrigation in the World has increased from 50 Mha in the year 1900 to 100 Mha in 1950, and to more than 250 Mha (Pla, 2007), over the recent years this phenomena have also contributed to the decrease of productivity and the increasing risks of dryland agricultural production on lands already affected by other degradation processes, mainly water erosion. The yearly loss of productivity, and desertification of irrigated lands, amounts to 1.5 Mha around the World, but the salinity problems, in different degrees, presently affect almost 50% of all the irrigated land (Pla, 2007). The social, economic, and environmental effects of salinization are of a high magnitude, with the consequence of high value placed on the maintenance of irrigated lands, and their coincidence with areas of large urban and industrial developments.
Salinity are predominant conditions in the plains, valleys, deltas and coastal plains of the world with the influx of sea, river and ocean salt water (Pla, 2007). In arid and semiarid climates, the scarcity and erraticity of rainfall, together with the high evapotranspiration rates, makes the water and salt balances favourable for the processes of soil salinization (Pla, 2007; Pannell and Ewing, 2006) The problems of secondary salinization are a consequence of non-adequate water management by irrigation and drainage, under a particular set of conditions, including: -Climate, Crops, Soils, Fertilization, Groundwater depth, Water quality, Irrigation system.
Soil salinity is the presence of soluble salts in the soil solution. Excess soluble salts in the root zone reduce plant growth, through either, osmotic stress or specific ion toxicities (Vijayvargiya and Kumar, 2011). Salinity generally occurs in arid and semi-arid regions, where leaching of the profile is restricted (Bernstein, 1975; Yuan et al. 2007). Soil salinity is one of the important soil properties that significantly affect agricultural production and environmental quality especially in the semiarid regions of the world and conventional chemical indicators of soil salinity include; electrical conductivity (EC), total dissolved solids (TDS) – refers to the total amount of soluble salts in a soil-saturated paste extract expressed in parts per million or milligrams per liter (ppm or mg/L), and exchangeable sodium percentage (ESP) is the sodium adsorbed on soil particles as a percentage of the Cation Exchange Capacity (CEC), while electrolyte stability index (ESI) gives a good indication of soil dispersion, although the threshold ESI value below which effective structural breakdown might occur is 0.025, which is twice as small as the expected 0.05 (Lin and Bañuelos, 2015; Odeh and Onus, 2008). Against these soil degrading factor, this study objectives include:
i. Present the result output of field investigating of salinity status of soils in University of Abuja
ii. Evaluate and present sustainable approaches for management and reclamation of salt affected soils of the study area
iii. Indicate Earth-system properties variability with soil salinity of the study area
iv. Forecast three (3) years interval in the salinity of the area with the present empirical data
2. MATERIALS AND METHODS
2.1. Location of the Study Area
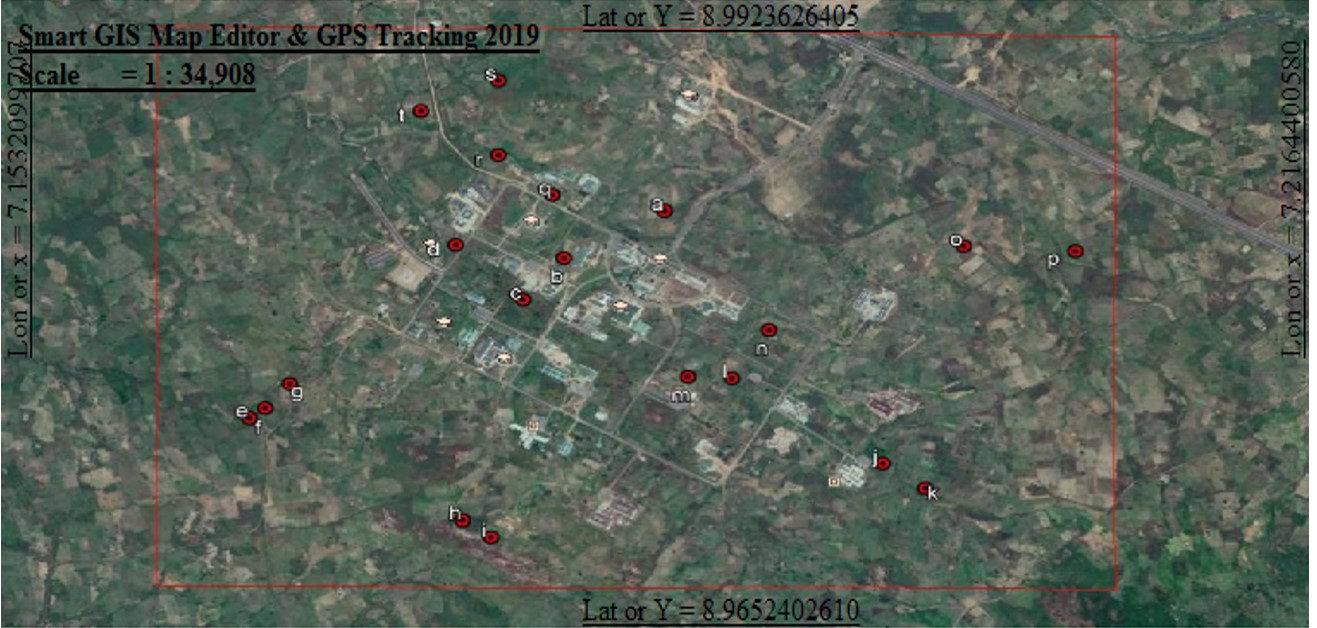
The study was conducted during the dry season of late 2020 within the landmass of University of Abuja the Federal Capital Territory (FCT) of Nigeria as in Fig. 1.
2.2 Background of the Study Area
The Federal Capital Territory of Nigeria falls within the Southern Guinean Savanna zone of the West Africa (Oku et al., 2020). The soils of Abuja are classified as Alfisols and sub order of Ustalfs with Ustic moisture regime. The area has a characteristics of the sub humid climate regime (Oku et al., 2020). There is a dominant occurrence of plinthite layers or continuous concretionary layers precisely within 24 cm and 39 cm and at times 150 cm depth (Oku et al., 2020). At the great-order group of Plinthustalfs, another sub-group as Typic Plinthustalfs exist (Lawal et. al., 2012; Oku et al., 2020).
2.3 Characteristics of the Soils of the Study Area
The soils of Abuja are underlain predominantly by basement complex rocks dominated by granites, gneisses, migmatites, quartzites and schist (Bennett et. al., 1979; Oku et al., 2020). The upland soils of the area which exist under the basement complex formation are generally deep, weakly to moderately structured and has sand to sandy clay in it texture with gravel and concretionary layers in the upper or beneath the surface layers (Ojanuga, 2006;Oku et al., 2020). Quartz is observed to be the prominent mineral constituents of the soils with high kaolinite clay content which is responsible for the relatively low plasticity of the soils (Alhassan et. al., 2012; Oku et. al., 2020).
2.4 Geographic information of the Study Area
Although officially in Abuja Municipal Council Area, the University of Abuja landmass falls within Gwagwalada. Gwagwalada is a suburb of the Federal Capital Territory, Nigeria. It is situated along Abuja-Lokoja road at about 55 kilometers away from FCT main town and centrally located between latitudes 8.55' N - 9. 00'N and longitudes 7. 00' E - 7. 04' E (Ishaya, 2013). With a population of about 157,770 at the 2006 census, the region covers a total landmass of about 65 km2. out of the 8,000 km2 of the total FCT land mass and located at the center of very fertile area with abundance of grasses (Ishaya, 2013). The area is bordered by Kuje Area council to the East, Abaji area council to the West, Kwali area council to the south and Abuja Municipal Area Council to the Northeast and to the North by Suleja Local Government Area of Niger State (Balogun, 2001).
2.5 Climatic and Geo-characteristics of the Study Area
The area is characterized by warm, humid, rainy season and a scorching dry season. Research report of Oku et. al. (2020) has indicated that the highest annual rainfall within the Territory is about 1632 mm. The area has been reported to have recorded a 20 % in its relative humidity. The area has recorded a 30% in it elevation with high values at the extreme south of the area.
2.6 Field Survey and Earth-system Property Data Collection
The University of Abuja landmass was stratified into four (4) stratum according to the catena that exist in the area. Twenty (20) experimental stations where five (5) random samples were taken and bulk together at each of the stratified points sampled to investigate the salinity variability that exist in the earth-system properties of the area.
2.7 Geographic studies and Data collection:
Field data were collected for geographic studies where each experimental stations in the three strata were georeferenced and mapped.
2.8 Soil Sampling and Data generation
Soil sampling was done with soil auger at a depth of 0-60cm at each location of the twenty (20) experimental points. Sampling methodology was stratified random sampling technique done in accordance with the four (4) catena used for the studies.
2.9 Pre-laboratory Investigation and Analysis
1. Particle size analysis distribution of (Afisols (Typic Plinthustalf )) the Area
Particle size distribution analysis (PSA) was done using the hydrometer method (Gee and Bauder, 1986).
2. Bulk density
Bulk density was determined by the core method (Burke et. al., 1986).
3. Porosity
Porosity was calculated as the function of total volume not occupied by soil solids, assuming a particle density of 2.65 Mg m-3(Danielson and Sutherland, 1986).
4. Organic Carbon Determination:
Soil organic matter content of the soil was estimated from the soil organic carbon content present in the soil. This procedure was done following the equation (equation 1) as presented by van Bemmelen, and used by Adiaha et. al., (2020 c) which presented a value of 0.58, as a standard for converting SOC to SOM.
5. Soil organic carbon
Soil organic carbon was determined by the wet oxidation method (Nelson and Sommers, 1982). Percentage (%) SOM = % organic carbon×1.724 (Walkley, 1934).
6. Soil salinity
Soil salinity was measured by passing an electric current between two electrodes of a salinity meter in a sample of soil solution, as described by Government of New South Wales Department of Agriculture, NSW Agriculture (2003).
2.10.1 Laboratory Simulations and Soil Salinity Inducement and Treatment
i. Soil samples were induced with 70g of Na+ Cl-. radical and kept in a control room temperature, this was done following the procedure outline by Todman1 et. al. (2018)
ii. Induced soil samples were treated with 70g of Biochar at one week after inducement (WAI) with Na+. Cl-. radical, this was done following the protocol outline by Todman1 et. al. (2018). The biochar was produced through thermal decomposition of biomass in an oxygen-limited environment.
iii. At 2WAI the sample was leached with one (1) liter of distilled water per can of the twenty (20) induced soil sample setup. This procedure was done following the direction prescribed by FAO (2017)
Post-laboratory Analysis
Particle size analysis, bulk density, porosity, Organic carbon, Soil Organic Matter including Soil salinity was determined one day after leaching (DAL) using the same procedure in the pre-analysis. This was done to determine the impact of the reclamation procedure on the status of the soil physical and chemical properties. The procedure was done following the description as prescribed by FAO (2017).
Laboratory Simulation Modelling
Result obtained from the % sand and % clay fraction of the experimental soil particle size analysis was fitted into the soil-water characteristics model. The use of the soil-water characteristics model was prescribed by NRCS (2015) and emphasized by USDA (2013) and has been utilized widely for Earth-system properties studies: modelling and forecast.
Earth-system properties including Wilting point, Field Capacity, Saturation, Matric Bulk Density, Available water, Matric Potential, Moisture Content and Matric Osmotic count were simulated by fitting particle size analysis result, Organic matter content including soil salinity analysis result into the soil-water characteristics model and modelled following the description by NRCS as prescribed (NRCS, 2015; USDA, 2013 and FAO, 2016, this simulation procedure has yield wide experimental result and has been validated in research report presented by FAO (2016) including the work of Adiaha et. al., (2020 c).
2.12 Data Processing and Analysis
i) Descriptive statistics: CV, % analysis, Mean, STD, SE including the chi-square statistics was applied in the study
ii) Correlation test of the Principal Component Analysis (PCA) of the exploratory statistics was applied to draw up relationship and evaluate the loss due to the impact of salinization in the experiment.
iii) In other to find the interaction that exit between the parameters, the Pearson Product Correlation (PPMC) analysis was utilized, where the coefficient of determination (R) and correlation coefficient (r) was utilized to establish the relationship. Simple Linear Regression model: Y = a + b*X was utilized to present the relating influence among the various parameters.
iv) The chi-square statistics was applied to predict the influence of the interacting parameters and test its significant at 0.05% probability level.
v) A modelling and statistical tool: Statgraphics Centurion “version 19” was utilized to run data analysis and modelling and for production of the graphics.
vi) QGIS and ArcGIS was used for geographic mapping and modelling
2.13 Standardization of Laboratory Experimentation and Analysis
All parameters determined in the study were compared with standardized ratings for tropical soils presented in Table 1, 2 and in Table 3.
| Parameter | Range / Rating | Source | |
| Low | < 2 | Udo et al., (2009) | |
| Organic matter (%) | Moderate | 2 - 3 | |
| High | > 3 | ||
| Very High | > 6 | ||
| Poor agricultural soils | < 40 | ||
| Porosity (%) | Satisfactory agricultural soil | 41 - 45 | |
| Good agricultural soils | 46 - 50 | ||
| Best agricultural soils | > 50 | ||
| Coefficient of variability (%) | Low | < 15 | Wildings, (1985) |
| Moderate | 16 - 35 | ||
| High | > 35 | ||
| 0.8 | Very slow | ||
| 0.8 – 2 | Slow | ||
| Saturated hydraulic conductivity (cm/hr) | 2.1 – 6.00 | Moderately slow | FAO, (1963) |
| 6.1 – 8.00 | Moderately rapid | ||
| 8.1 – 12.50 | Rapid | ||
| > 12.50 | Very rapid | ||
| < 1 | Low | ||
| Organic carbon (%) | 1 – 1.5 | Moderate | Udo et al., 2009 |
| > 1.5 | High |
| Soil salinity class | EC (dS/m) | Effects on crop plants |
| Non-saline | 0 – 2 | Salinity effects negligible |
| Slightly saline | 2 – 4 | Yields of sensitive crops may be restricted |
| Moderately saline | 4 – 8 | Yields of many crops are restricted |
| Strongly saline | 8 – 16 | Only tolerant crops yield satisfactorily |
| Very strongly saline | > 16 | Only very tolerant crops yield satisfactorily |
| Soil porosity status indicator | Rating (%) |
| Soil very compact | <5% |
| Soil compact | 5-10% |
| Soil moderately porous | 10-25% |
| Soil highly porous | 25-40% |
| Soil extremely porous | >40% |
3.0 RESULT AND DISCUSSION
3.1 Result output of field investigation of salinity variability status of soils at University of Abuja
The result of earth-system properties with salinity variability as presented in Table 4 indicated that the distribution of salinity is uneven in the area. The laboratory output indicated that soils at station 1 holds salinity value of 1.3 dS/m. At Station 2, the salinity value of the area was observed at 2.4 dS/m. Salinity value of 3.1 dS/m was observed for Station 3. It could be stated that the value at Station produced higher salinity value that stands over Station 4 (2.9 dS/m), Station 5 (2.0 dS/m) and all other stations in Strata 1 of the study area. It could be stated that the soils at location with Stata 1 of the study area ranges between electrical conductivity class of non-saline and slightly saline soils (1.3-.1 dS/m). A Coefficient of Variation at (CV= 28%) which indicated a moderate variability in the salinity of soils at this strata.
At Strata 2, as presented in (Table 5), a CV= 11% which is low variability in the salinity of the soils of the strata was observed. The salinity status at Station 6 indicated the site Electrical Conductivity (EC) flux at 2.5 dS/m presenting a view that soils of the site is slightly saline in nature. At Stata 7 an EC measure indicated 2.3 dS/m as salinity status of the area. At Strata 8 a salinity value of 2.5 was obtained which also indicated that the site is slightly saline. Station 9 presented a salinity value at 2.0 and Strata 10 EC salinity class was also observed at 2.0 and 1.8 respectively, this indicated that two stations are non-saline.
The behavior observed for Strata 3 in Table 6 presented that the strata is low variability class (CV= 9%) in its salinity status. It could be stated that all the stations in this strata holds a non-saline status in it EC with salinity values at (EC= 2.1, 2.0, 1.9, 1.6, 1.8 for Station 11, 12, 13, 14, and 15 respectively).
A similar variability class of CV= 3% as indicated in Table 7 was observed at soils that exist in Strata 4, where Station 16 produce a salinity value of 2.0 dS/m, Station 17 gave at salinity value at 1.9 dS/m, while Station 18, Station 19 and Station 20 produced a salinity class value at 1.8, 1.9 and 1.9 dS/m for the respective stations.
Result output and views presented in this study agrees with the research of FAO (2016) including the study of Oku et. al. (2020) which indicated variation in soil physical and chemical constituents due to variability that exist in the soil system and environmental influence.
| Strata 1 | ||||||||||||||||
| Lat | Long | Elevation (m) | Wilting point (% Vol) | Field Capacity (% Vol) | Saturation (% Vol) | Available water ( cm/cm) | Saturated Hydraulic conductivity (cm/hr) | Matric Bulk Density (g/cm3) | Organic Matter (% Wt) | Organic Carbon (%) | Moisture Content (% Vol) | Matric Potential (kPa) | Matric Osmotic count ( kPa) | Salinity (dS/m) | ||
| 8.983139 | 7.180917 | 284 | Station 1 | 3.3 | 10.3 | 47 | 0.07 | 12.848 | 1.4 | 14 | 8 | 13.8 | 126 | 126 | 1.3 | |
| 8.981389 | 7.177806 | 264 | Station 2 | 3.4 | 11.4 | 46.8 | 0.08 | 11.917 | 1.41 | 13 | 8 | 13.9 | 31 | 31 | 2.4 | |
| 8.979833 | 7.176528 | 261 | Station 3 | 4 | 12.2 | 46.5 | 0.08 | 10.704 | 1.42 | 12 | 7 | 14.8 | 32 | 32 | 3.1 | |
| 8.981889 | 7.174444 | 260 | Station 4 | 6.4 | 17.4 | 45.6 | 0.11 | 6.053 | 1.44 | 13 | 8 | 13.8 | 81 | 81 | 2.9 | |
| 8.975417 | 7.168 | 256 | Station 5 | 6.5 | 19.8 | 45.9 | 0.13 | 5.07 | 1.43 | 16 | 9 | 15 | 115 | 115 | 2 | |
| Mean | 4.72 | 14.22 | 46.36 | 0.09 | 9.32 | 1.42 | 13.60 | 7.89 | 14.26 | 77.00 | 77.00 | 2.34 | ||||
| STD | 1.43 | 3.71 | 0.53 | 0.02 | 3.16 | 0.01 | 1.36 | 0.79 | 0.53 | 40.00 | 40.00 | 0.65 | ||||
| CV % | 30 | 26 | 1 | 24 | 34 | 1 | 10 | 10 | 4 | 52 | 52 | 28 | ||||
| SE | 0.64 | 1.66 | 0.24 | 0.01 | 1.41 | 0.00 | 0.61 | 0.35 | 0.24 | 17.89 | 17.89 | 0.29 | ||||
| Strata 2 | ||||||||||||||||
| Lat | Long | Elevation (m) | Wilting point (% Vol) | Field Capacity (% Vol) | Saturation (% Vol) | Available water ( cm/cm) | Saturated Hydraulic conductivity (cm/hr) | Matric Bulk Density (g/cm3) | Organic Matter (% Wt) | Organic Carbon (%) | Moisture Content (% Vol) | Matric Potential (kPa) | Matric Osmotic count ( kPa) | Salinity (dS/m) | ||
| 8.975778 | 7.1685 | 252 | Station 6 | 4.6 | 14.1 | 46.2 | 0.09 | 8.904 | 1.43 | 14 | 8 | 14.9 | 36 | 36 | 2.5 | |
| 8.976694 | 7.169278 | 269 | Station 7 | 5.2 | 14.5 | 45.9 | 0.09 | 8.17 | 1.43 | 11 | 6 | 28.1 | 41 | 41 | 2.3 | |
| 8.971639 | 7.174667 | 275 | Station 8 | 3.4 | 11.7 | 46.8 | 0.08 | 11.733 | 1.41 | 15 | 9 | 89.3 | 31 | 31 | 2.5 | |
| 8.971028 | 7.175556 | 278 | Station 9 | 7.2 | 18.8 | 45.8 | 0.12 | 5.453 | 1.44 | 18 | 10 | 79.3 | 101 | 340 | 2 | |
| 8.973778 | 7.187639 | 289 | Station 10 | 5.9 | 15.3 | 45.9 | 0.09 | 7.778 | 1.43 | 12 | 7 | 83.2 | 48 | 263 | 1.8 | |
| Mean | 5.26 | 14.88 | 46.12 | 0.094 | 8.4076 | 1.428 | 14 | 8.12 | 58.96 | 51.4 | 142.2 | 2.22 | ||||
| STD | 1.16 | 2.10 | 0.33 | 0.01 | 1.85 | 0.01 | 2.24 | 1.30 | 28.33 | 23.21 | 120.83 | 0.25 | ||||
| CV % | 22 | 14 | 1 | 13 | 22 | 1 | 16 | 16 | 48 | 45 | 85 | 11 | ||||
| SE | 0.52 | 0.94 | 0.15 | 0.00 | 0.83 | 0.00 | 1.00 | 0.58 | 12.67 | 10.38 | 54.04 | 0.11 | ||||
| Strata 3 | ||||||||||||||||
| Lat | Long | Elevation (m) | Wilting point (% Vol) | Field Capacity (% Vol) | Saturation (% Vol) | Available water ( cm/cm) | Saturated Hydraulic conductivity(cm/hr) | Matric Bulk Density (g/cm3) | Organic Matter (% Wt) | Organic Carbon (%) | Moisture Content (% Vol) | Matic Potential (kPa) | Matric Osmotic count ( kPa) | Salinity (dS/m) | ||
| 8.972861 | 7.188944 | 293 | Station 11 | 4.7 | 10.3 | 46.7 | 0.06 | 12.06 | 1.41 | 16 | 9 | 84 | 30 | 286 | 2.1 | |
| 8.976917 | 7.183 | 283 | Station 12 | 4.3 | 11.7 | 46.7 | 0.07 | 11.733 | 1.41 | 11 | 6 | 67 | 31 | 276 | 2 | |
| 8.976972 | 7.181639 | 275 | Station 13 | 5.9 | 14.5 | 45.9 | 0.09 | 8.17 | 1.43 | 12 | 7 | 61 | 41 | 268 | 1.9 | |
| 8.978722 | 7.184139 | 282 | Station 14 | 5.2 | 13.8 | 46.2 | 0.09 | 9.05 | 1.43 | 10 | 6 | 52 | 34 | 226 | 1.6 | |
| 8.981833 | 7.190139 | 288 | Station 15 | 5.4 | 15 | 46.1 | 0.1 | 8.33 | 1.43 | 13 | 8 | 49 | 44 | 261 | 1.8 | |
| Mean | 5.1 | 13.06 | 46.32 | 0.082 | 9.8686 | 1.422 | 12.4 | 7.192 | 62.6 | 36 | 263.4 | 1.88 | ||||
| STD | 0.55 | 1.78 | 0.32 | 0.01 | 1.69 | 0.01 | 2.06 | 1.19 | 12.47 | 5.55 | 20.47 | 0.17 | ||||
| CV % | 11 | 14 | 1 | 18 | 17 | 1 | 17 | 17 | 20 | 15 | 8 | 9 | ||||
| SE | 0.25 | 0.80 | 0.14 | 0.00 | 0.76 | 0.00 | 0.92 | 0.53 | 5.58 | 2.48 | 9.15 | 0.08 | ||||
| Strata 4 | ||||||||||||||||
| Lat | Long | Elevation (m) | Wilting point (% Vol) | Field Capacity (% Vol) | Saturation (% Vol) | Available water ( cm/cm) | Saturated Hydraulic conductivity (cm/hr) | Matric Bulk Density (g/cm3) | Organic Matter (% Wt) | Organic Carbon (%) | Moisture Content (% Vol) | Matic Potential (kPa) | Matric Osmotic count ( kPa) | Salinity (dS/m) | ||
| 8.981639 | 7.193583 | 284 | Station 16 | 5.4 | 14.1 | 46.2 | 0.09 | 8.904 | 1.43 | 11 | 6 | 48 | 36 | 277 | 2 | |
| 8.983722 | 7.177444 | 272 | Station 17 | 4.7 | 11.7 | 46.6 | 0.07 | 11.038 | 1.42 | 13 | 8 | 42 | 31 | 262 | 1.9 | |
| 8.985222 | 7.175778 | 277 | Station 18 | 9.3 | 24 | 46.1 | 0.15 | 3.106 | 1.43 | 12 | 7 | 51 | 270 | 486 | 1.8 | |
| 8.987972 | 7.175778 | 272 | Station 19 | 5.5 | 15.5 | 46.1 | 0.1 | 8.05 | 1.43 | 10 | 6 | 71 | 48 | 277 | 1.9 | |
| 8.986889 | 7.173361 | 252 | Station 20 | 7 | 17.4 | 45.6 | 0.1 | 6.05 | 1.44 | 10 | 6 | 68 | 81 | 307 | 1.9 | |
| Mean | 6.38 | 16.54 | 46.12 | 0.102 | 7.4296 | 1.43 | 11.2 | 6.496 | 56 | 93.2 | 321.8 | 1.9 | ||||
| STD | 1.64 | 4.17 | 0.32 | 0.03 | 2.69 | 0.01 | 1.17 | 0.68 | 11.44 | 90.10 | 83.39 | 0.06 | ||||
| CV % | 26 | 25 | 1 | 26 | 36 | 0 | 10 | 10 | 20 | 97 | 26 | 3 | ||||
| SE | 0.73 | 1.86 | 0.14 | 0.01 | 1.20 | 0.00 | 0.52 | 0.30 | 5.12 | 40.29 | 37.29 | 0.03 | ||||
Study Survey and point of study location Map Fig 2
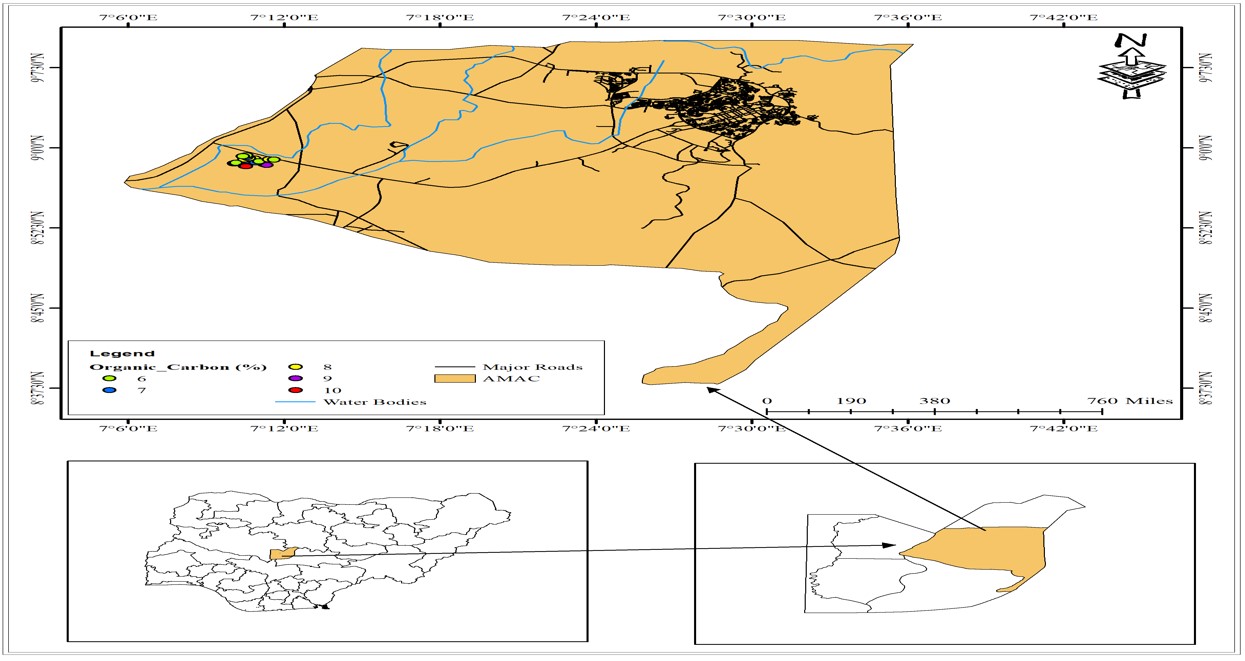
Organic Carbon Distribution in Soils of the Study Area Fig 3
Strata variation that exist between Earth-System Properties and Salinity flux in Soils of the Area
The Strata influence that exist in the four stratum experimented as presented in Table 8 for this research indicated that there exist a variability in the salinity of the various soils that exist in the area, where the Strata 1 produced soils with mean salinity value at 2.34 dS/m of the Electrical Conductivity of the soil. Soils at Strata 2 produced soils with a mean value of EC = 2.22 dS/m, while Stata 3 soils recorded a value at 1.88 dS/m and Starla 4 = 1.90 dS/m respectively. It could be stated that data presented in Table 8 for the salinity variation in the four (4) Stratum investigated for this studies indicated that soil at Strata 1 has a Slightly saline potential at 2.34 dS/m > 2.22 dS/m for Strata 2 >1.90 dS/m for Strata 4 > 1.88 dS/m with ranking = non-saline at Strata 3.
| Mean Strata | Wilting point (% Vol) | Field Capacity (% Vol) | Saturation (% Vol) | Available water ( cm/cm) | Saturated Hydraulic conductivity (cm/hr) | Matric Bulk Density (g/cm3) | Organic Matter (% Wt) | Organic Carbon (%) | Moisture Content (% Vol) | Matric Potential (kPa) | Matric Osmotic count ( kPa) | Salinity (dS/m) |
| Strata 1 | 4.72 | 14.22 | 46.36 | 0.09 | 9.32 | 1.42 | 13.60 | 7.89 | 14.26 | 77.00 | 77.00 | 2.34 |
| Strata 2 | 5.26 | 14.88 | 46.12 | 0.09 | 8.41 | 1.43 | 14.00 | 8.12 | 58.96 | 51.40 | 142.20 | 2.22 |
| Strata 3 | 5.10 | 13.06 | 46.32 | 0.08 | 9.87 | 1.42 | 12.40 | 7.19 | 62.60 | 36.00 | 263.40 | 1.88 |
| Strata 4 | 6.38 | 16.54 | 46.12 | 0.10 | 7.43 | 1.43 | 11.20 | 6.50 | 56.00 | 93.20 | 321.80 | 1.90 |
| Mean | 5.37 | 14.68 | 46.23 | 0.09 | 8.76 | 1.43 | 12.80 | 7.42 | 47.96 | 64.40 | 201.10 | 2.09 |
| STD | 0.55 | 1.13 | 0.10 | 0.01 | 0.83 | 0.00 | 0.98 | 0.57 | 17.53 | 19.82 | 86.39 | 0.18 |
| SE | 0.28 | 0.56 | 0.05 | 0.00 | 0.41 | 0.00 | 0.49 | 0.28 | 8.76 | 9.91 | 43.20 | 0.09 |
| CV % | 10 | 8 | 0 | 7 | 9 | 0 | 8 | 8 | 37 | 31 | 43 | 9 |
3.1.5 Particle Size Distribution (PSD) of Afisols (Typic Plinthustalf ) of the Area
Result of particle size distribution of the area as presented in (Table 9) indicated that soils of the area are Loamy Sand, Sandy Loam and Loam soils, with variation impact at 15% for sand, which shows a low variability impact, 30% silt variation which contributed a high potential for the soil-physical quality potential and variation. However, the clay content variation influence of the soil was recorded at 53% which indicated a high contributory influence in the build-up of the few soil salinity observed in the strata one. At Strata 2, a 9% variation influence was observed to have been contributed by the sand content in soils of the area, which indicated a low contribution to the low soil carbon availability of the area. A 16% silt variation influence was observed to have added to the availability of the physical disability of the area. However, this contributory variation impact was moderate. A moderate contributory impact at a value of 31% was found for the clay content observed at Strata 2, indicating that clay particles of the soils at Strata 2 had more impact on the soil physical and chemical condition. Contributory impact on physical and chemical potential at the tone of CV = 9%, 24% and 27% for sand, silt and clay respectively was observed for the soils at Strata 3 indicating that sand particles in the soils had a low influence on the soil salinity flux of the area, while silt and clay content of the soil particles contributed towards the nature and EC of the soils. Sand and silt fraction of the soil particles at Strata 4 produce a moderate contributory effect on the soil functionality in the strata with a CV value recorded at 19% and 28% respectively.
It was observed that clay content at Strata 4 contributed the highest impact on the soil physical variability of the area with a variation contribution of 49% which stand above all other contributory impact in soils at Strata 1, 2, and 3 respectively. Results presented for the contribution of the Earth-System property of soil particle sizes indicated that the particles soils of the area has great potentials in the sustainability of the low to moderate salinity observed that exist in the soil system. Outcome of this finding agrees with the research of Chude et al. (2020) which observed soil physical properties being a contributory factor to soil sustainability. This finding outcome also aligns with the work FAO (2020) which indicated the soils of physical and chemical properties being one of the major determinant of the soil functionality potential of an area. The research of Adiaha et al. (2020 c); Francious and Maas (1994); Hayward (1954) including Hernández et. al. (2020); Landeros-Sánchez et. al. (2016);Zuniga-Meza (2016); Úbeda Rivera and Dallatorre (2018); Catari et. al. (2022);Capetillo-Burela et.al. (2021);Colon-García et. al. (2021);Capetillo-Burela et. al. (2021); Catari et. al. (2022) also agrees with the outcome of this findings where the researchers reported the soils of the area contributing to bio-availability of soil organic carbon among other soil biophysical potential. Data presented in Table 10 indicated that the soils of the area ranges from compacted, moderately compact to been very compact, with CV = 60% which indicated a high variability in the soil pores system.
| Experimental Station | Strata | Sand | Silt | Clay | USDA Textural Class |
| g kg-1 | |||||
| ST1 | 1 | 80.3 | 17.5 | 2.2 | Loamy Sand |
| ST2 | 76 | 22.6 | 1.4 | Loamy Sand | |
| ST3 | 74.5 | 22.4 | 3.2 | Loamy Sand | |
| ST4 | 60.4 | 32.4 | 7.2 | Sandy Loam | |
| ST5 | 50.5 | 42.4 | 7.2 | Loam | |
| Mean | 68 | 27 | 4 | ||
| STD | 10 | 8 | 2 | ||
| CV % | 15 | 30 | 53 | ||
| SE | 4.5 | 3.6 | 0.9 | ||
| ST6 | 2 | 68.4 | 27.4 | 4.2 | Sandy Loam |
| ST7 | 68.4 | 26.4 | 5.2 | Sandy Loam | |
| ST8 | 74.4 | 23.4 | 2.2 | Loamy Sand | |
| ST9 | 54.4 | 38.4 | 7.2 | Sandy Loam | |
| ST10 | 65.5 | 29.4 | 5.2 | Sandy Loam | |
| Mean | 66 | 29 | 5 | ||
| STD | 6 | 5 | 1 | ||
| CV % | 9 | 16 | 31 | ||
| SE | 2.7 | 2.2 | 0.4 | ||
| ST11 | 3 | 82.7 | 14 | 3.2 | Loamy Sand |
| ST2 | 74.4 | 23.4 | 2.2 | Loamy Sand | |
| ST13 | 68.4 | 26.4 | 5.2 | Sandy Loam | |
| ST14 | 69.4 | 26.4 | 4.2 | Sandy Loam | |
| ST15 | 64.4 | 31.4 | 4.2 | Sandy Loam | |
| Mean | 72 | 24 | 4 | ||
| STD | 6 | 6 | 1 | ||
| CV % | 9 | 24 | 27 | ||
| SE | 2.7 | 2.7 | 0.4 | ||
| ST16 | 4 | 68.4 | 27.4 | 4.2 | Sandy Loam |
| ST7 | 76.4 | 20.4 | 3.2 | Loamy Sand | |
| ST18 | 40.4 | 48.4 | 11.2 | Loam | |
| ST19 | 62.5 | 33.4 | 4.2 | Sandy Loam | |
| ST20 | 60.5 | 32.4 | 7.2 | Sandy Loam | |
| Mean | 62 | 32 | 6 | ||
| STD | 12 | 9 | 3 | ||
| CV % | 19 | 28 | 49 | ||
| SE | 5.4 | 4.0 | 1.3 | ||
| Strata | Porosity (%) |
| Strata 1 | |
| Station 1 | 21 |
| Station 2 | 25 |
| Station 3 | 17 |
| Station 4 | 38 |
| Station 5 | 38 |
| Strata 2 | |
| Station 6 | 14 |
| Station 7 | 9 |
| Station 8 | 18 |
| Station 9 | 22 |
| Station 10 | 15 |
| Strata 3 | |
| Station 11 | 35 |
| Station 12 | 17 |
| Station 13 | 1 |
| Station 14 | 7 |
| Station 15 | 41 |
| Strata 4 | |
| Station 16 | 18 |
| Station 17 | 2 |
| Station 18 | 13 |
| Station 19 | 12 |
| Station 20 | 14 |
| X | 18.85 |
| STD | 11.244 |
| CV (%) | 60 |
| SE | 2.51 |
Reclamation Programme Output
Strata 1
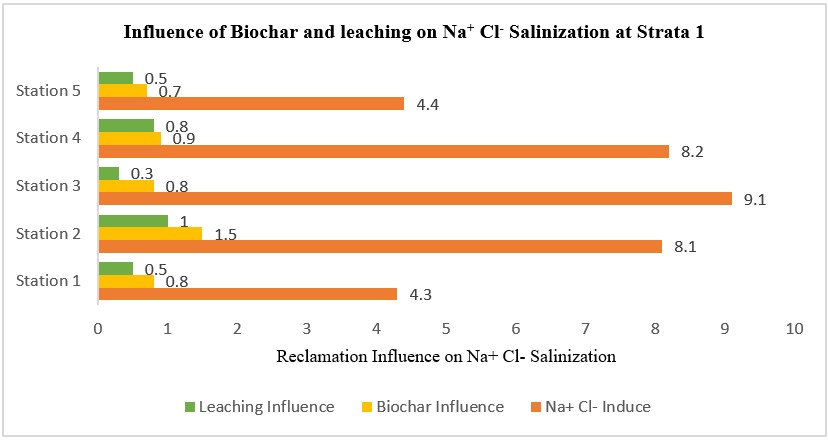
The strength of the reclamation strategies as presented in Table 11,Table 12,Figure 4, 5,6 and 7 indicated the influence of the reclamation strategy on the induced Na+. Cl-. radical. Data analysis and validation indicated a high significant influence at 5% probability level of the PPMC statistics and also at the chi-square statistics. Outcome of this findings confirms the research of FAO (2021) where her report indicated biological materials including gypsum and biochar including leaching being able to reclaim salt toxic soils.
| Strata 1 | ||||||||
| Pre-analysis | Post-analysis | |||||||
| Geographic Properties | At existing point | Na+ Cl- Induce | Biochar Influence | Leaching Influence | Mean Reclamation Programme Influence % Influence | |||
| Lat | Long | Elevation (m) | Experimental Station Point | Salinity (dS/m) | ||||
| 8.983139 | 7.180917 | 284 | Station 1 | 1.3 | 4.3 | 0.8 | 0.5 | 0.65 |
| 8.981389 | 7.177806 | 264 | Station 2 | 2.4 | 8.1 | 1.5 | 1 | 1.25 |
| 8.979833 | 7.176528 | 261 | Station 3 | 3.1 | 9.1 | 0.8 | 0.3 | 0.55 |
| 8.981889 | 7.174444 | 260 | Station 4 | 2.9 | 8.2 | 0.9 | 0.8 | 0.85 |
| 8.975417 | 7.168 | 256 | Station 5 | 2 | 4.4 | 0.7 | 0.5 | 0.6 |
| Mean | 2.34 | 6.82 | 0.94 | 0.62 | ||||
| STD | 0.65 | 2.05 | 0.29 | 0.25 | ||||
| CV % | 28 | 30 | 31 | 40 | ||||
| SE | 0.29 | 0.92 | 0.13 | 0.11 | ||||
| Na+ Cl- Induce | Biochar Influence | Leaching Influence | |
| Experimental Station Point | Salinity (dS/m) | ||
| Station 1 | 4.3 | 0.8 | 0.5 |
| Station 2 | 8.1 | 1.5 | 1 |
| Station 3 | 9.1 | 0.8 | 0.3 |
| Station 4 | 8.2 | 0.9 | 0.8 |
| Station 5 | 4.4 | 0.7 | 0.5 |
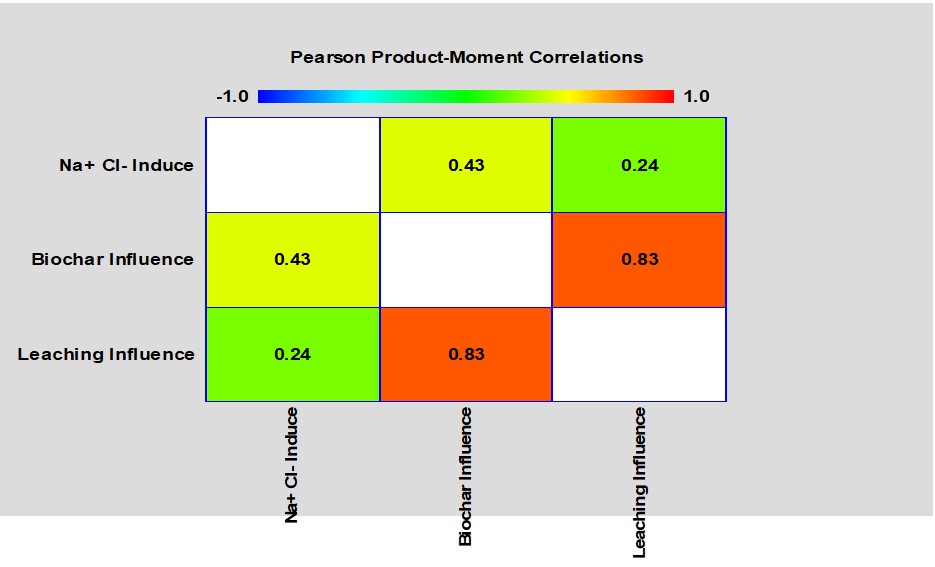
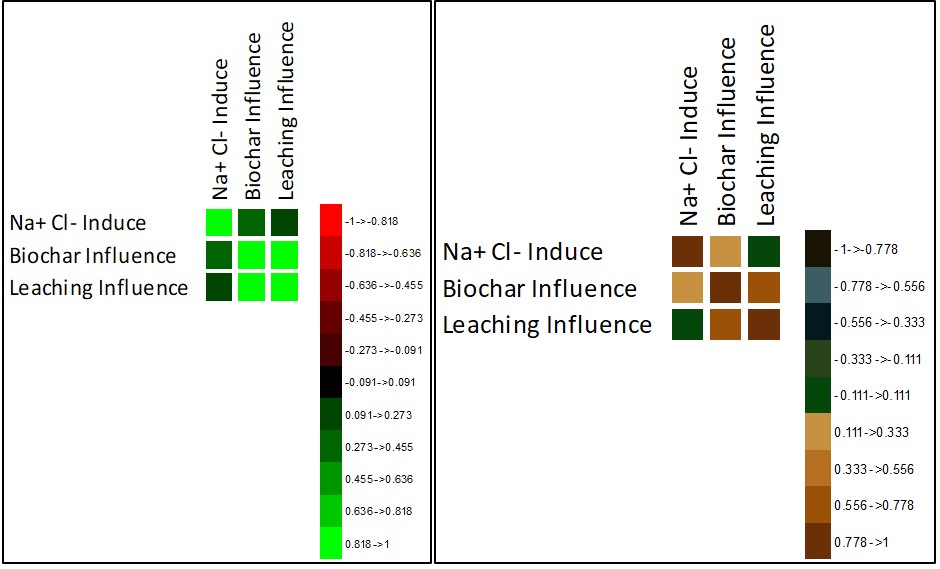
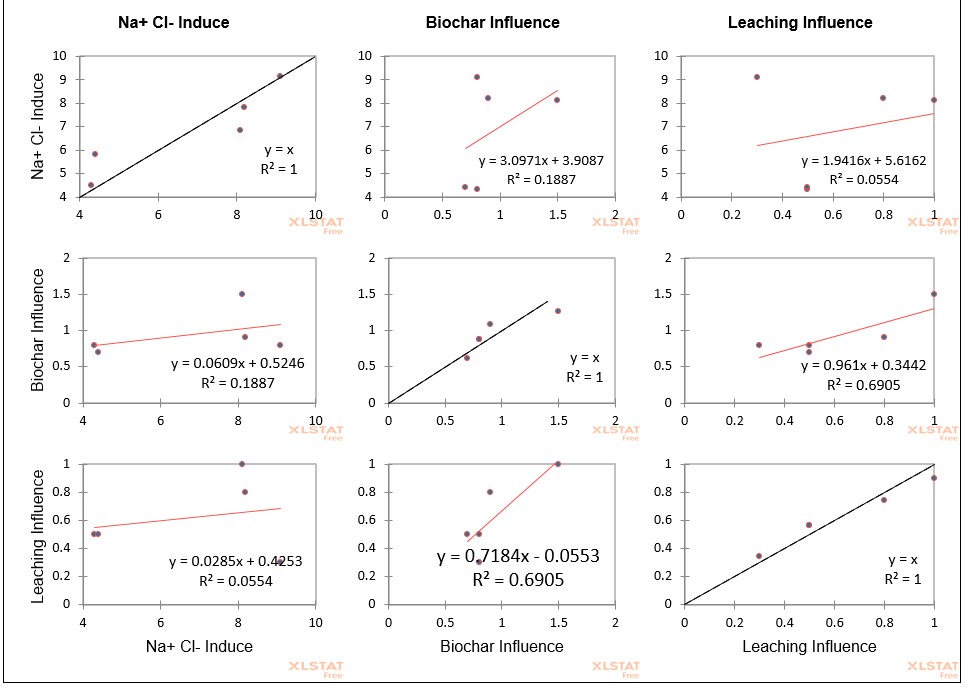
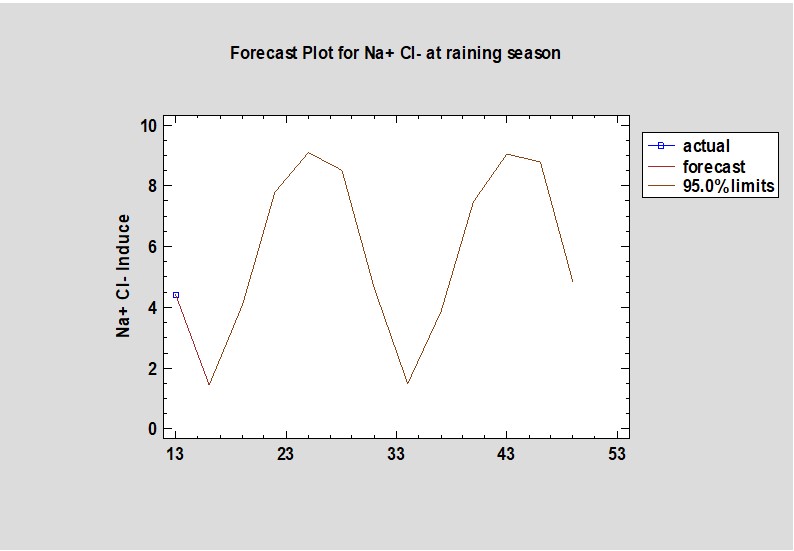
Forecasting three (3) years from today for STRATA 1
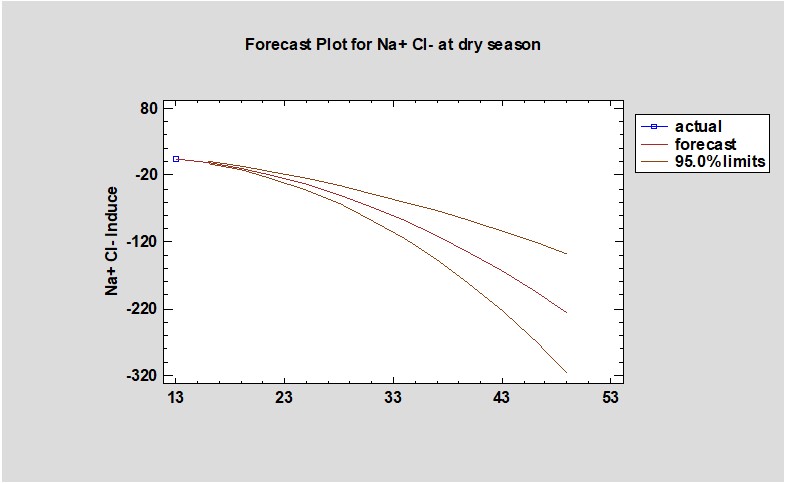
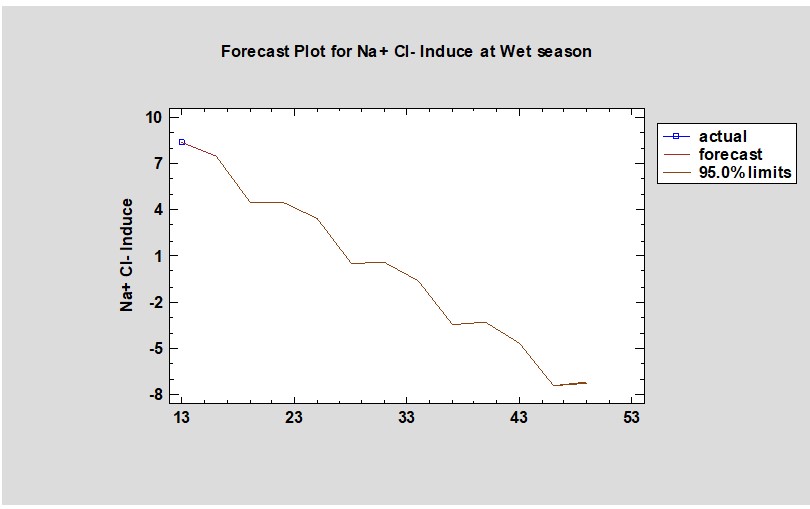
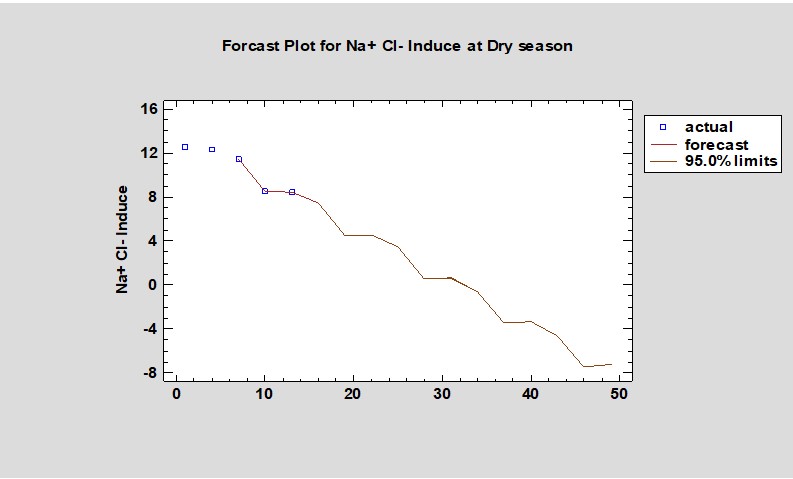
The result of the forecast indicated that the area will fluctuate in it salinity content in the raining season as presented in Figure 8a, 8b. The result also proof that there could be a build up of Na+ Cl- in the soils during the dry season as presented in Figure 9. Views presented in this findings is in accordance with the report presented by FAO (2021) which indicated climatic elements and environmental factors being among the driving forces for the buildup of soil salinity.
Strata 2
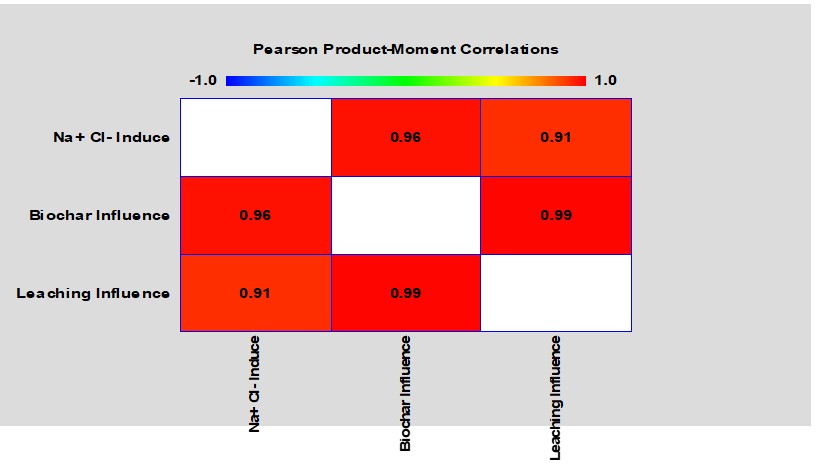
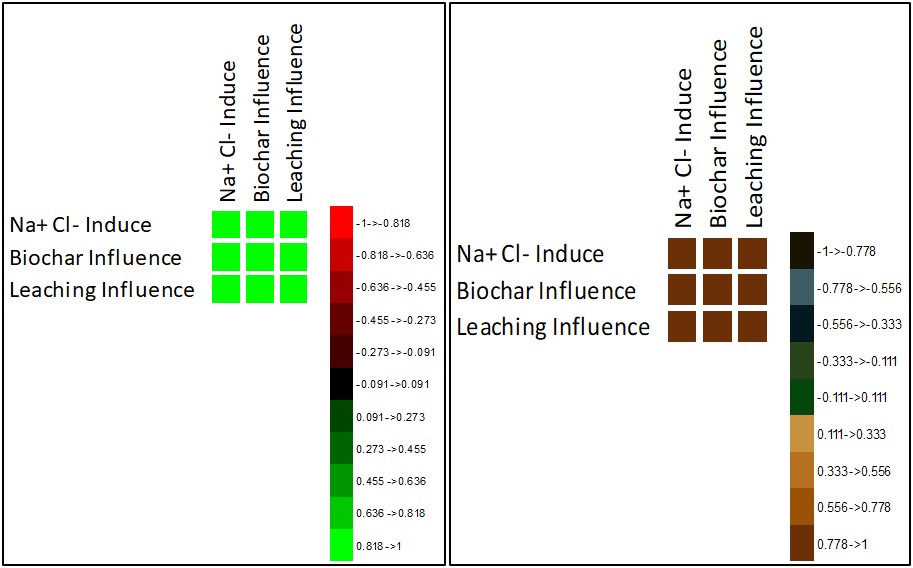
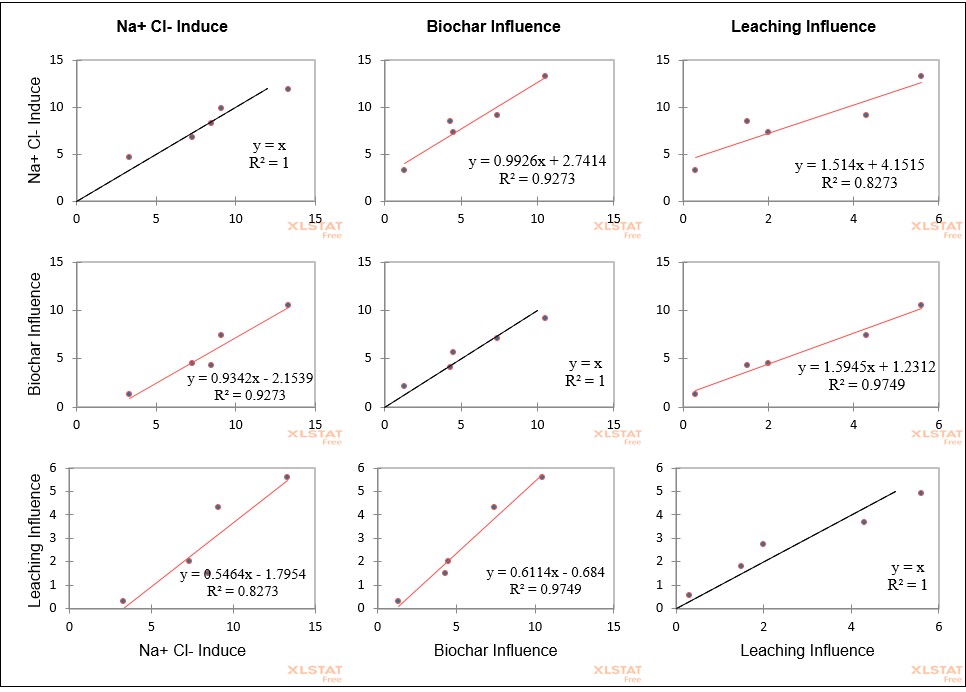
The strength of the reclamation strategies as presented in Table 13, Table 14, Figure 9,10, 11 and 12 indicated that the reclamation programme yield productive output in the reduction of the induce salinity in the soil. Data analysis and validation indicated a significant influence at 5% probability level of the PPMC statistics and also at the chi-square statistics. Outcome of this findings confirms the research of FAO (2021) where her report indicated biological materials including gypsum and biochar including leaching being able to reclaim salt toxic soils. The result of the study is also in line with the views presented by Liang et. al. (2005) which indicated organic resources ability in the reduction of soil salinity.
| Strata 2 | ||||||||
| Pre-analysis | Post-analysis | |||||||
| Geographic Properties | At existing point | Na Cl Induce | Biochar Influence | Leaching Influence | Mean Reclamation Programme Influence % Influence | |||
| Lat | Long | Elevation (m) | Experimental Station Point | Salinity (dS/m) | ||||
| 8.975778 | 7.1685 | 252 | Station 6 | 2.5 | 13.3 | 10.5 | 5.6 | 8.05 |
| 8.976694 | 7.169278 | 269 | Station 7 | 2.3 | 9.1 | 7.4 | 4.3 | 5.85 |
| 8.971639 | 7.174667 | 275 | Station 8 | 2.5 | 8.5 | 4.3 | 1.5 | 2.9 |
| 8.971028 | 7.175556 | 278 | Station 9 | 2 | 7.3 | 4.5 | 2 | 3.25 |
| 8.973778 | 7.187639 | 289 | Station 10 | 1.8 | 3.3 | 1.3 | 0.3 | 0.8 |
| Mean | 2.22 | 8.3 | 5.6 | 2.74 | ||||
| STD | 0.28 | 3.21 | 3.12 | 1.93 | ||||
| CV % | 13 | 39 | 56 | 70 | ||||
| SE | 0.13 | 1.44 | 1.40 | 0.86 | ||||
| Strata 2 | |||
| Na+ Cl- Induce | Biochar Influence | Leaching Influence | |
| Experimental Station Point | Salinity (dS/m) | ||
| Station 6 | 13.3 | 10.5 | 5.6 |
| Station 7 | 9.1 | 7.4 | 4.3 |
| Station 8 | 8.5 | 4.3 | 1.5 |
| Station 9 | 7.3 | 4.5 | 2 |
| Station 10 | 3.3 | 1.3 | 0.3 |
Forecasting three (3) years from today for STRATA 2
Forecasting output for Strata 2 indicated also that the area will fluctuate in it salinity content in the raining season as presented in Figure 12. The result also indicated that there could be a build-up of Na+. Cl-. in the soils during the dry season as presented in Figure 13. Views presented in this findings is in accordance with the report presented by FAO (2021) including the report of IPCC which indicated variation in soils and other component of the environment accounting for the variability that exist in the earth climatic system.
Strata 3
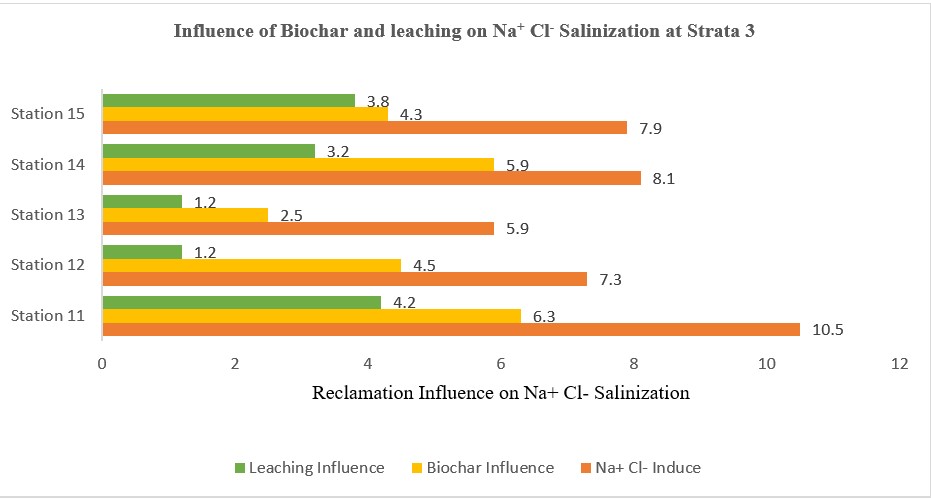
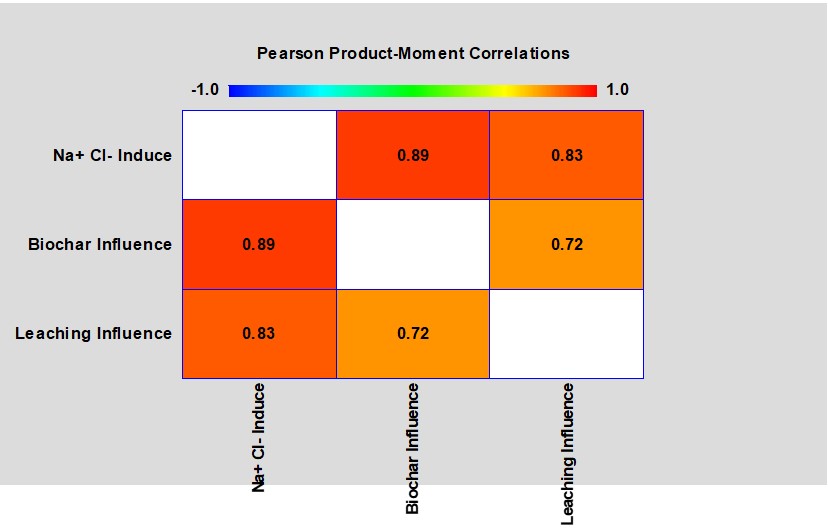
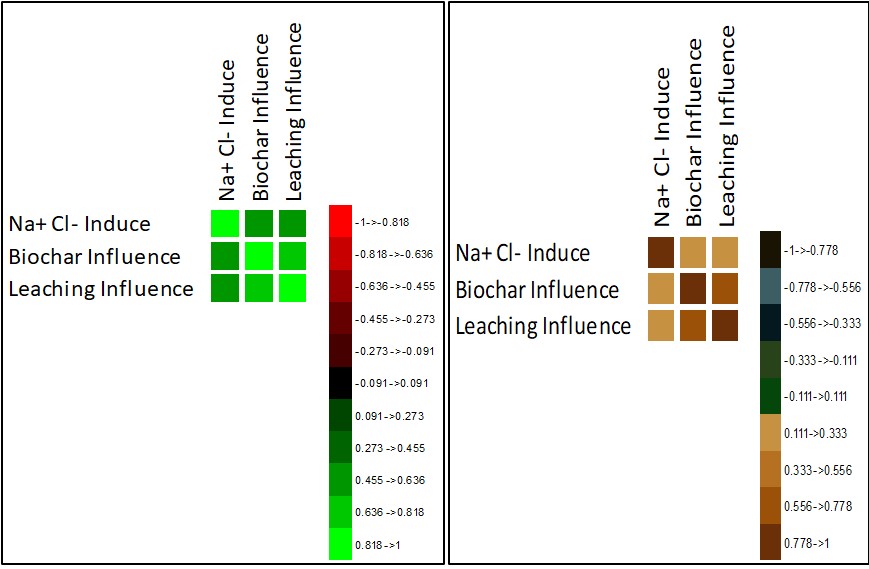
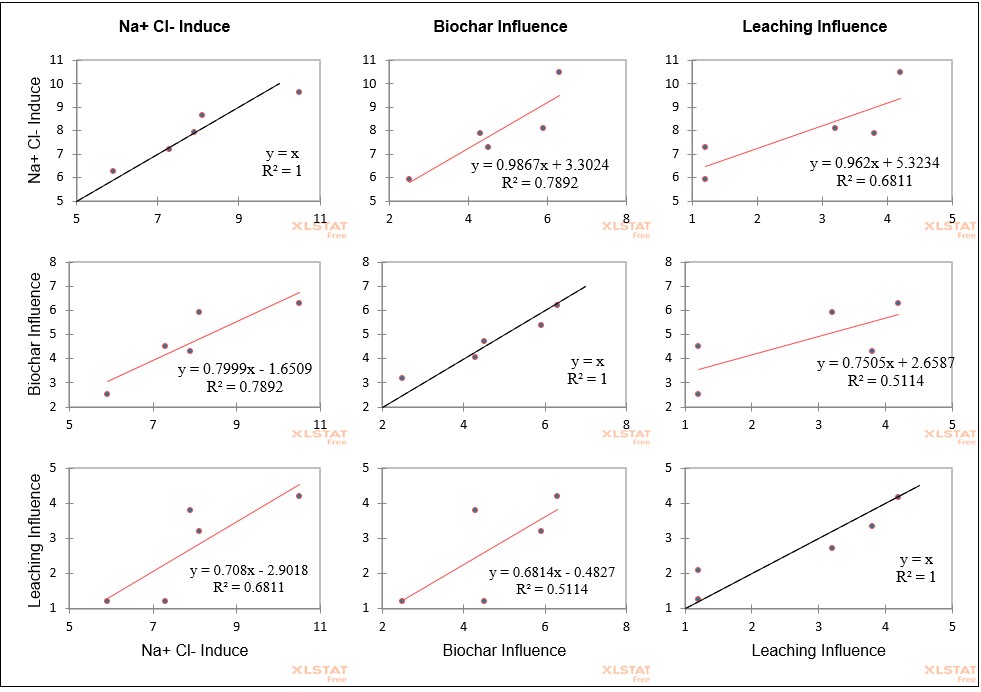
At a 5% probability level of the PPMC statistics and also at the chi-square statistics as significant point was recorded for the strength of the reclamation strategies as presented in Table 15, Table 16, Figure 14, 15, 16 and 17 indicating that the influence of the reclamation strategy on the induced Na+ Cl- radical was positive and productive. Outcome of this findings confirms the research of FAO (2021) where her report indicated biological materials including gypsum and biochar being able to reclaim saline soils of the tropics.
| Strata 3 | ||||||||
| Pre-analysis | Post-analysis | |||||||
| Geographic Properties | At existing point | Na+ Cl- Induce | Biochar Influence | Leaching Influence | Mean Reclamation Programme Influence % Influence | |||
| Lat | Long | Elevation (m) | Experimental Station Point | Salinity (dS/m) | ||||
| 8.972861 | 7.188944 | 293 | Station 11 | 2.1 | 10.5 | 6.3 | 4.2 | 5.25 |
| 8.976917 | 7.183 | 283 | Station 12 | 2 | 7.3 | 4.5 | 1.2 | 2.85 |
| 8.976972 | 7.181639 | 275 | Station 13 | 1.9 | 5.9 | 2.5 | 1.2 | 1.85 |
| 8.978722 | 7.184139 | 282 | Station 14 | 1.6 | 8.1 | 5.9 | 3.2 | 4.55 |
| 8.981833 | 7.190139 | 288 | Station 15 | 1.8 | 7.9 | 4.3 | 3.8 | 4.05 |
| Mean | 1.88 | 7.94 | 4.7 | 2.72 | ||||
| STD | 0.17 | 1.49 | 1.34 | 1.28 | ||||
| CV % | 9 | 19 | 29 | 47 | ||||
| SE | 0.08 | 0.67 | 0.60 | 0.57 | ||||
| Strata 3 | |||
| Experimental Station Point | Na+ Cl- Induce | Biochar Influence | Leaching Influence |
| Station 11 | 10.5 | 6.3 | 4.2 |
| Station 12 | 7.3 | 4.5 | 1.2 |
| Station 13 | 5.9 | 2.5 | 1.2 |
| Station 14 | 8.1 | 5.9 | 3.2 |
| Station 15 | 7.9 | 4.3 | 3.8 |
Forecasting three (3) years from today for STRATA 3
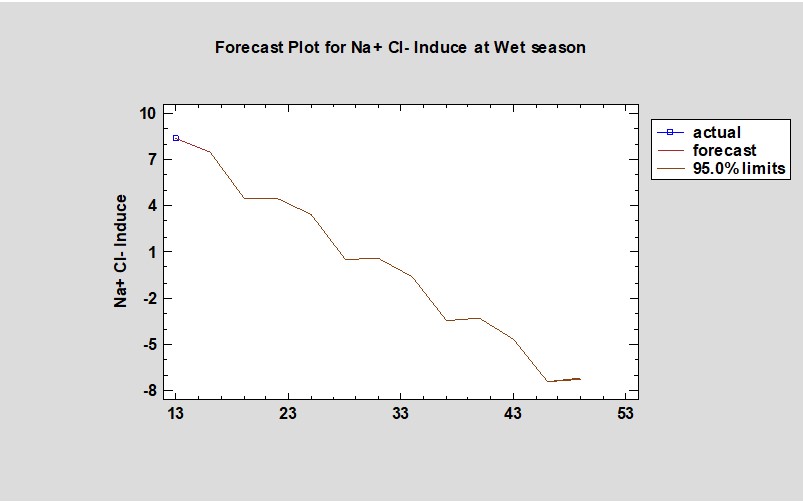
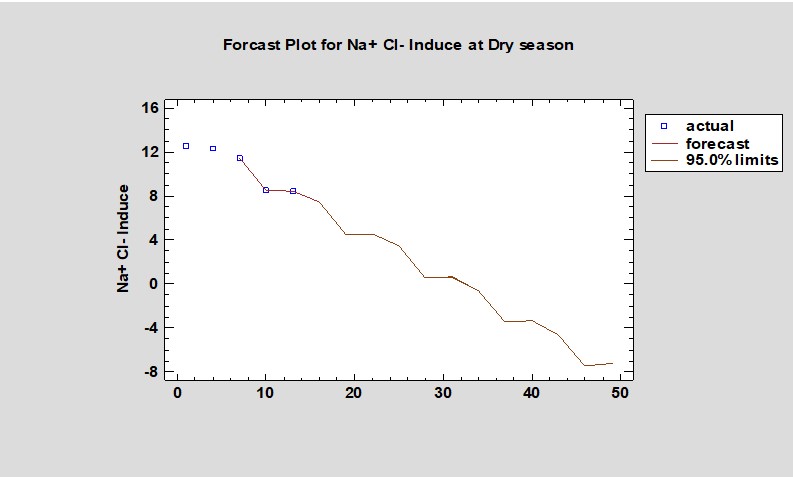
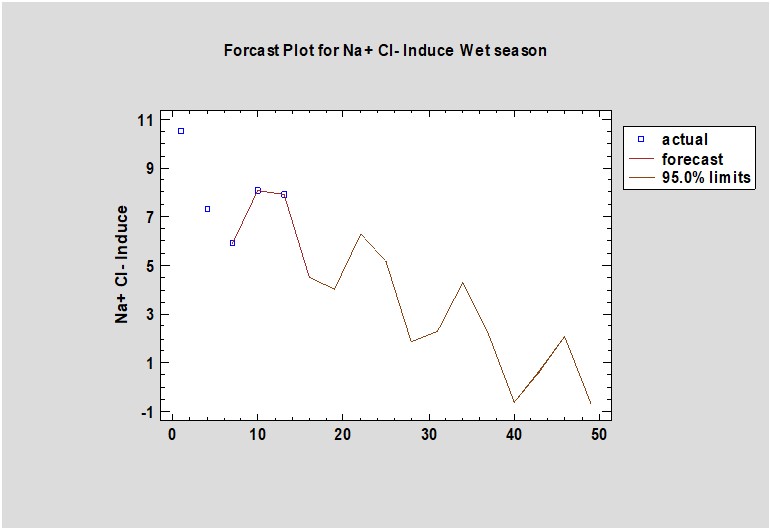
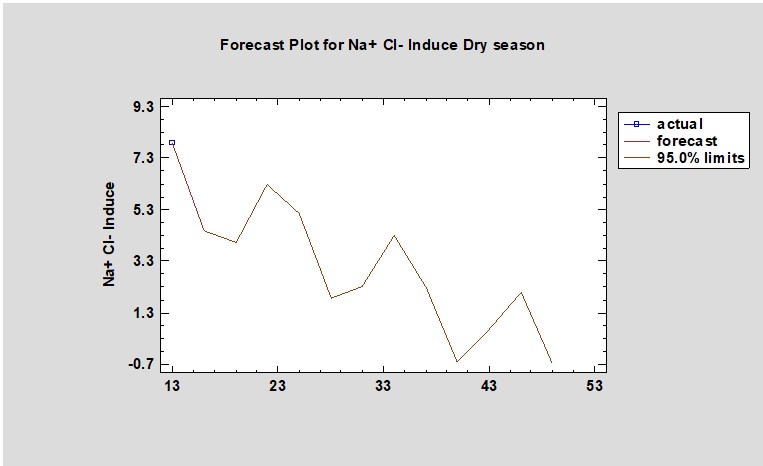
Three years forecast output for Strata 3 has revealed that the area will fluctuate in it salinity class. This fluctuation will be climate controlled alongside other natural and anthropogenic factors. It could be stated that the raining season as presented in Figure 18 will be highly variable in its ability for the leaching of the area. The result indicated in Figure 19 for Na+.Cl.-flux in three years time shows that the area could build-up salt during the dry period following anthropogenic and natural factors. Views explained in this findings is in accordance with the report presented by FAO (2021) including the report of Adiaha, et. al. (2022); IPCC (2020) which indicated variation in soils and other component of the environment with anthropogenic influence including the changes in the climate.
Strata 4
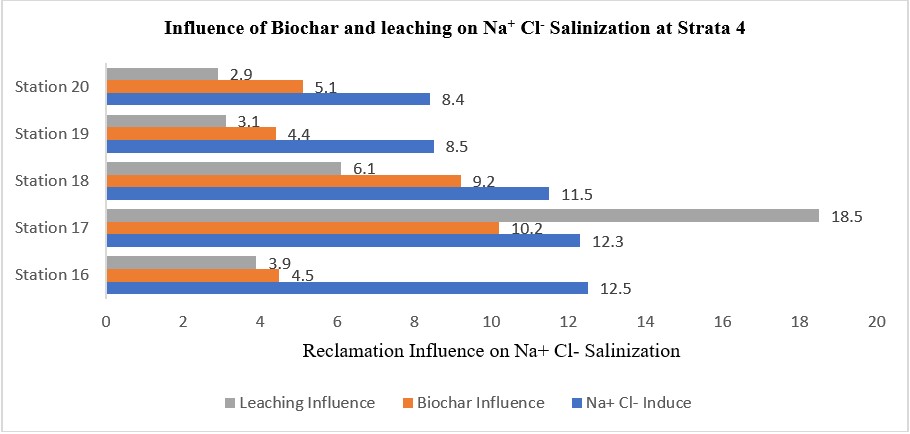
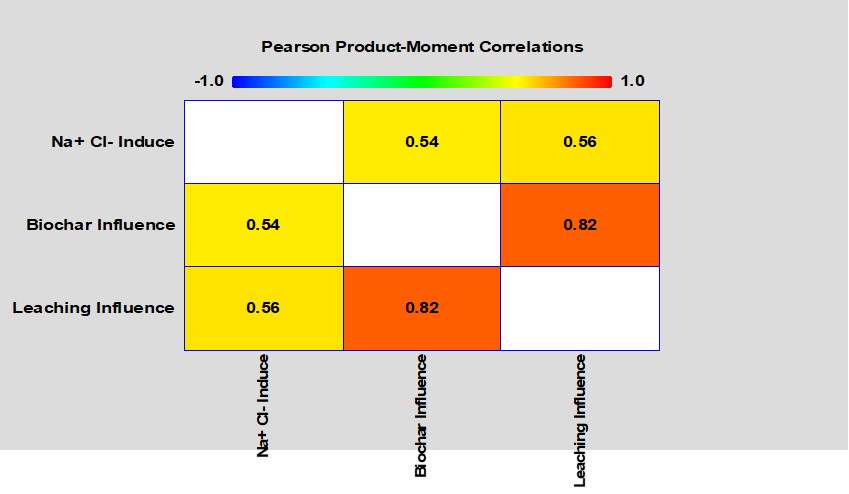
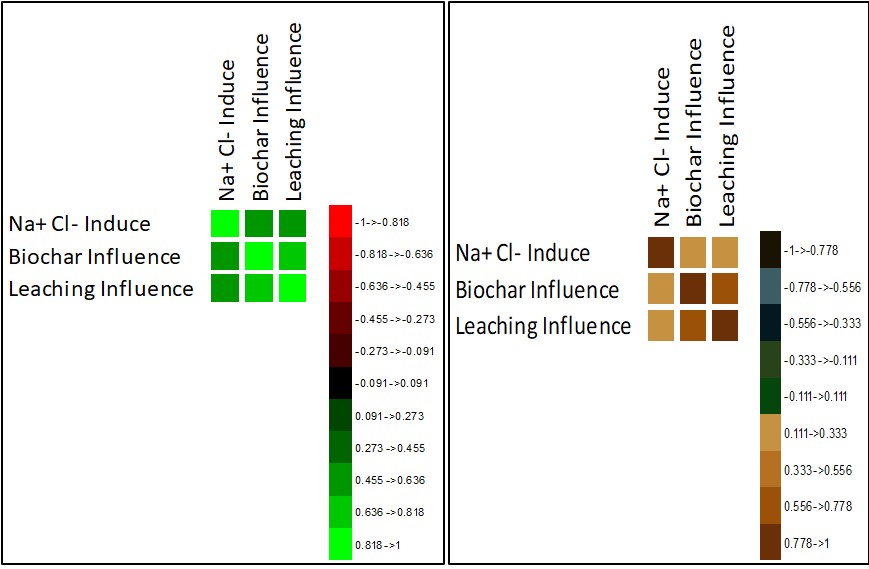
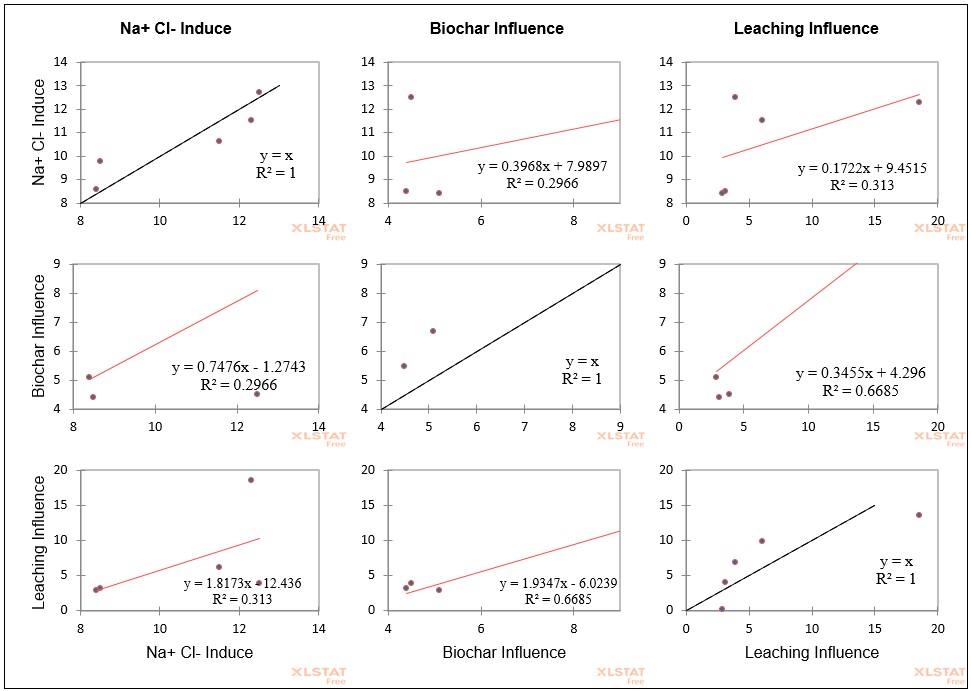
The reclamation strategies as presented in Table 17 , Table 18, Figure 20, 21, 22 and 23 yield a significate influence in the reclamation process the induced Na+. Cl-. ions. Data analysis and validation indicated a high significant influence at 5% probability of level of the PPMC statistics and the chi-square statistics. Outcome of this findings confirms the research of FAO (2021) and the work of Liang et. al. (2005) where their report indicated biological materials having great influence in the reduction of soil salinity of an area.
| Strata 4 | |||||||||
| Pre-analysis | Post-analysis | ||||||||
| Geographic Properties | At existing point | Na Cl Induce | Biochar Influence | Leaching Influence | Mean Reclamation Programme Influence % Influence | ||||
| Lat | Long | Elevation (m) | Experimental Station Point | Salinity (dS/m) | |||||
| 8.981639 | 7.193583 | 284 | Station 16 | 2 | 12.5 | 4.5 | 3.9 | 4.2 | |
| 8.983722 | 7.177444 | 272 | Station 17 | 1.9 | 12.3 | 10.2 | 18.5 | 14.35 | |
| 8.985222 | 7.175778 | 277 | Station 18 | 1.8 | 11.5 | 9.2 | 6.1 | 7.65 | |
| 8.987972 | 7.175778 | 272 | Station 19 | 1.9 | 8.5 | 4.4 | 3.1 | 3.75 | |
| 8.986889 | 7.173361 | 252 | Station 20 | 1.9 | 8.4 | 5.1 | 2.9 | 4 | |
| Mean | 1.9 | 10.64 | 6.68 | 6.9 | |||||
| STD | 0.06 | 1.82 | 2.50 | 5.91 | |||||
| CV % | 3 | 17 | 37 | 86 | |||||
| SE | 0.03 | 0.81 | 1.12 | 2.64 | |||||
| Strata 4 | |||
| Experimental Station Point | Na+ Cl- Induce | Biochar Influence | Leaching Influence |
| Station 16 | 12.5 | 4.5 | 3.9 |
| Station 17 | 12.3 | 10.2 | 18.5 |
| Station 18 | 11.5 | 9.2 | 6.1 |
| Station 19 | 8.5 | 4.4 | 3.1 |
| Station 20 | 8.4 | 5.1 | 2.9 |
Forecasting three (3) years from today for STRATA 4
Three years (3) interval forecasting output done for Strata 4 indicated also that the area will fluctuate in it salinity content in the raining season as presented in Figure 24. The result also indicated that there could be a build-up of Na+ Cl- in the soils during the dry period as presented in Figure 25. This findings is in accordance with the report presented by FAO (2021); IPCC (2016); Chude et. al. (2020) including the report of Oku et. al. (2020) which indicated variation in soil bio-physical and chemical functionality.
CONCLUSION
Outcome of this study indicated that Na+. Cl-. ions in salt affected soils can be effectively reclaimed with 70 g of biochar technology and leaching with distil water. The two reclamation strategies was able to reclaim soils induced with Na+. Cl-. radicals at a Coefficient of Variation value at (CV=62%) which indicated a high variability potential in the reclamation technology. Forecasting result indicated that the area could remain free of salt, but if unsustainable practices like application of untreated wastewater for irrigation occur, then a percentage at high dosage of salt (4.3 dS/m for Na+. Cl- ) could result as observed during the inducement stage of this experiment. Hence biotechnical tools like Biochar at 70g is recommended for reclamation at a pot-stage of salinity influence reclamation, and at a larger dosage for larger fields, as this could drive sustainable soil productivity.
Acknowledgments
Models and statistical packages were provided by the Institute of Biopaleogeography named under Charles R. Darwin, Zlocieniec, Poland. Workstation and internet supply was provided by the Nigeria Instituteof Soil Science. Experimental facilities were provided by the University of Abuja.
References
Abel G. J, Brottrager M, Crespo Cuaresma J, Muttarak R (2019). Climate, conflict and forced migration. Global Environmental Change, 12:3-5. [pure.iiasa.ac.at/15684] https://doi.org/10.1016/j.gloenvcha
Adiaha, M. S., Chude, V. O. ., Nwaka, G. I. C. ., & Oku, E. E. . (2022). Carbon auditing in tree-soil nexus: a sustainable approach towards CO2 sequestration and environmental transformation. EQA-International Journal of Environmental Quality, 48 (1), 1–9. https://doi.org/10.6092/issn.2281-4485/13838
Adiaha M.S., Chude V.O., Nwaka G.I.C., Oku E.E., Ojimiwe K.O. (2021) Carbon and man in the 21st Century: trees as a tool for climate manipulation towards a sustainable environment. Colloquia Series of the Proceedings of the 4th Conference of Soil Science Society of Nigeria (SSSN), Colloquia SSSN 44:380-387.
Adiaha, M. S., Buba, A. H., Tangban, E. E, & Okpoho, A. N. (2020) Mitigating Global Greenhouse Gas Emission: The Role of Trees as a Clean Mechanism For CO2 Sequestration, The Journal of Agricultural Sciences, 15:1, 101-115. Retrieved from: http://doi.org/10.4038/jas.v15i1.8675
Alhassan, M., E. Mesaiyete and A.M. Mustapha. (2012). Clay mineralogy of lateritic soils derived from granite basement-a case study of Minna lateritic soils. J. Geotechn. Engg. 17: 1897-1903.
Burke, W. and L.E. Sommers. (1986). Soil structure assessment. Balkema A. A. Rotterdam.
Balogun, O. (2001). The federal capital territory of Nigeria: Geography of its Development. University of Ibadan; University of Ibadan Press. Nigeria.
Bennett, A. F., & Ruben, J. A. (1979). Endothermy and activity in vertebrates. Science, 206(4419), 649-654.
Bernstein, L. (1975). Effect of Salinity and Sodicity on Plant Growth. Agricultural Research. United State of America Department of Agriculture. 295-3624.
Capetillo-Burela, A., López-Collado, C. J., Zetina-Lezama, R., Reynolds-Chávez, M. A., Matilde-Hernández, C., Cadena-Zapata, M., & López-López, J. A. (2021). Conceptual model of nitrogen fertilization for corn (Zea mays L.) in Veracruz, Mexico. Rev. Iberoam. Bioecon. Cambio Clim., 7(14), 1617–1631. https://doi.org/10.5377/ribcc.v7i14.12606
Capetillo-Burela, A., Zetina-Lezama, R., Reynolds-Chávez, M. A., Cadena-Zapata, M., López-López, J. A., Matilde-Hernández, C., & Espinoza del Carmen, A. (2021). Elaboration of paper with six varieties of pennisetum purpureum schumach in Veracruz, Mexico. Rev. Iberoam. Bioecon. Cambio Clim., 7(14), 1674–1696. https://doi.org/10.5377/ribcc.v7i14.12608
Catari Yujra, G., Guzman-Moreno, M. A., Hands, M., & Reyes-Osornio, M. (2022). Yield of Maize Alley Cropped with Inga Trees and Several Levels of Natural Fertilizers. Rev. Iberoam. Bioecon. Cambio Clim., 8(15), 1886–1897. https://doi.org/10.5377/ribcc.v8i15.14383
Colon-García, A. P., Catari-Yujra, G., & Alvarado, E. (2021). The productive paths of the bioeconomy: The case of Honduras. Rev. Iberoam. Bioecon. Cambio Clim., 7(14), 1713–1726. https://doi.org/10.5377/ribcc.v7i14.12820
Chude, V., Oku, E., Nwaka, G., & Adiaha, M. (2020). Soil compaction assessment as a manipulative strategy to improve soil biodiversity: an approach for meeting SDG two and six. Land Reclamation and Water Management, (1), 131 - 143. https://doi.org/10.31073/mivg202001-224
Danielson, R.E. and P.L. Sutherland. (1986). Methods of soil analysis. Porosity. In: Klute, A. (ed.). 2nd edition. Madison: American Society of Agronomy. 1: 443-461.
Francious, L. E and Maas, E. V. (1994). Crop response and management of salt affected soils/ Pessarakle M. (ed.) Handbook of plant and crop stress – New York, USA
FAO (2017). Saline Soils and Their Management. Https://Www.Fao.Org/3/X5871e/X5871e04.Htm (Retrieved 13/11/2021)
FA0 (2016). The State of Food and Agriculture 2016. http://www.fao.org/3/a-i6030e.pdf (Retrieved 13/11/2021).
FAO (2020). Migration, Agriculture and Climate Change: Reducing Vulnerabilities and Enhancing Resilience https://www.fao.org/emergencies/resources/documents/resources-detail/en/c/1106745/ (Retrieved 13/11/2021).
FAO (2021) State of knowledge of soil biodiversity – Status, challenges and potentialities https://www.fao.org/3/cb1928en/CB1928EN.pdf (Retrieved 13/11/2021).
FAO. (1963). High dams soil survey project. Deb. BC. Rome.
García Hernández, M., Pérez Magaña, A., Martínez Corona, B., & Gutiérrez Villalpando, V. (2020). Change of soil use and climate variability in Chiautzingo, Puebla, Mexico. Rev. Iberoam. Bioecon. Cambio Clim., 6(11), 1295–1315. https://doi.org/10.5377/ribcc.v6i11.9421
Gee, G.W. and J.W. Bauder. (1986). Particle-size Analysis. p 383-411 In A. Klute (ed.) Methods of Soil Analysis Part 1. Soil Science Society of America Book Series 5, Madison, Wisconsin, USA.
Government of New South Wales Department of Agriculture, NSW Agriculture (2003). http://www.dpi.nsw.gov.au/__data/assets/pdf_file/0008/519632/Salinity-training-manual.pdf (Retrieved 13/11/2021).
Hayward, H.E. (1954). Saline and alkali soils -- Their diagnosis and improvement. Soil Conservation. 20:75-81. U.S. Salinity Laboratory-United States Department of Agriculture, Publication ID number 188. https://www.ussl.ars.usda.gov/pubinfo.aspx?id=188
IPCC, (2016). Intergovernmental Panel on Climate Change. www.ipccglobalannualreport . (Retrieved 31/6/2019).
International Institute of Applied System Analysis (2019) New study establishes causal link between climate, conflict, and migration. https://iiasa.ac.at/web/home/about/news/190123-migration-climate.html (Rederived 28/11/2021)
Ishaya, S., (2013). Flood Vulnerability Mapping in Gwagwalada Urban Area, Abuja, Nigeria. Unpublished Master’s Thesis, Department of Geography, University of Abuja, Nigeria.
Kachinskii, N. A. (1970). Soil physics p. I Mir Publisher. In S. V. Zonn, (1986). Tropical and subtropical soil science. Mir Publisher, Moscow.
Jeffrey L.U. (2013) Strategies for Minimizing Salinity Problems and Optimizing Crop Production, Agricultural & Biological Engineering: In-Service Training, Manual, Hastings, FL. University of Florida. https://hos.ifas.ufl.edu/media/hosifasufledu/documents/IST30688---7.pdf (Rederived 28/11/2021)
Lin, Z.Q and Bañuelos G.S. (2015) Soil Salinization Indicators. In: Armon R., Hänninen O. (eds) Environmental Indicators, Springer, Dordrecht. https://doi.org/10.1007/978-94-017-9499-2_20
Landeros-Sánchez, C., Moreno-Seceña, J. C., Castañeda-Cháves, M. del R., Lango-Reynoso, F., Hernández-Pérez, J. M., Hernádez-Lara, O., & Caballero-Hernandez, A. J. (2016). Handling of nitrogen in the sugar zone center of Veracruz, México. Rev. Iberoam. Bioecon. Cambio Clim., 2(1), 43–52. https://doi.org/10.5377/ribcc.v2i1.5677
Lawal, B.A., M.K.A. Adeboye, P.A. Tsado, M. Elebiyo and C.R. Nwajoku, 2012. Properties, classification and agricultural potentials of lateritic soils of Minna in sub-humid agroecological zone, Nigeria. Int. J. Devel. Sustain. 1(3): 903-911
Liang Y, Si J, Nikolic M, Peng Y, Chen W, et al. (2005) Organic manure stimulates biological activity and barley growth in soil subject to secondary salinization. Soil Biol Biochem 37: 1185–1195.
Natural Resources Conservation Service, NRC of USDA (2015). Soil Water Characteristics.
Oku, E.E., S.A. Emmanuel, N.C. Odoh and B.I. Musa. (2020). Soil physical fertility status and management prescription for soil sustaining farms and ranches in Abuja, Nigeria. Journal of Environmental and Agricultural Sciences. 22(1):57-63.
Odeh, O. A. and Onus, A. E. (2008). Spatial Analysis of Soil Salinity and Soil Structural Stability in a Semiarid Region of New South Wales, Australia. Environmental Management (2008) 42:265–278. https://doi.org/10.1007/s00267-008-9100-z
Ojanuga, A.G. (2006) Agroecological Zones of Nigeria Manual. In: Berding, F. and Chude, V.O., Eds., National Special Programme for Food Security (NSPFS) and FAO, 124.
Pannell, D. J. and Ewing, M. A (2006) Managing secondary dryland salinity: options and challenges. Agric Water Manage 80: 41–56.
Pagliai, M. (1988). Soil Porosity and soil Hydrology Aspects. International Agrophysics, 4: 215-232.
Pla, I., (2007). Soil degradation and desertification: New approaches. p. 17-36. In A. Rodriguez and C. Arvelo (ed.). Control of soil degradation and desertification. University of La Laguna, La Laguna (Spain).
Todman1, L.C., Chhang, A., Riordan, H. J., Brooks, D., Butler, A. P., and Templeton, M. R. (2018). Soil Osmotic Potential and Its Effect on Vapor Flow from a Pervaporative Irrigation Membrane. J. Environ. Eng., 144(7): 04018048
Úbeda Rivera, J. S., & Delgado Dallatorre, Y. (2018). The infiltration of water into the soils and artificial components and organic matter that are used in them for agriculture. Rev. Iberoam. Bioecon. Cambio Clim., 4(7), 889–896. https://doi.org/10.5377/ribcc.v4i7.6299
Udo, E.J., T.O. Ibia, J.A. Ogunwale, A.O. Ano, and I. E. Esu. (2009). Manual of soil, plant and water analysis. Lagos: Sibon Books Publishers Limited., Nigeria.p: 183.
USDA-United States Department of Agriculture, (2013) Technical References on Soil Water Characteristics and SPAW. USDA, pp 34.
Vijayvargiya, S. and Kumar, A. (2011). Influence of Salinity Stress on Plant Growth and Productivity: Salinity stress influences on plant growth. Germany. Lap Lambert Academic Publishers.170 pp.
Walkley, A.J. and Black, I.A. (1934). Estimation of soil organic carbon by the chromic acid titration method. Soil Sci. 37, 29-38.
Wilding, L.P. (1985). Spatial variability: its documentation, accommodation and implication to soil surveys, pp. 166-194. In D.R. Nielsen and J. Bouma (eds.). Soil Spatial Variability: Pudoc, Wageningen, Netherlands.
Yuan BC, Li ZZ, Liu H, Gao M, Zhang YY (2007) Microbial biomass and activity in salt affected soils under arid conditions. Appl Soil Ecol., 35: 319–328.
Zuniga-Meza, F. H. (2016). Validation of five bean varieties with high contents of Fe (iron ) and Zn (zinc ) , to incorporate in school meals in municipalities of dry runner Olancho, Honduras, 2015. Rev. Iberoam. Bioecon. Cambio Clim., 2(1), 167–179. https://doi.org/10.5377/ribcc.v2i1.5692
Author notes
sundaymonday@niss.gov.ng

