

Growth Accounting in the Dominican Republic 1990-2018: new evidence
Contabilidad del crecimiento en la República Dominicana 1990-2018: nueva evidencia
Revista de Economía del Caribe
Universidad del Norte, Colombia
ISSN: 2011-2106
ISSN-e: 2145-9363
Periodicity: Semestral
no. 26, 2020
Received: 14 June 2020
Accepted: 20 November 2020
Corresponding author: martin_grandes@uca.edu.ar
Abstract: This paper uses fresh data from the Conference Board Total Economy databases to account for the Dominican Republic´s sources of long-run growth in 1990-2018. We adjust for the effects of real business cycles by calculating GDP growth between cyclical peaks and controlling for the quality of production factors and the difference between ICT and NON-ICT capital investment. We find the main factors that explain the GDP growth rate are, in the order: 1) The Non-ICT Capital, 2) The Labor Quantity, 3) The Total Factor Productivity, followed to a less extent by, the ICT Capital and Labor quality contributions. Indeed, the Total Factor Productivity explains about 24% or less of the total growth on average. This is consistent with the timing and sequencing of structural reforms implemented in Dominican Republic and the last decade investments in the most productive sectors.
Keywords: Economic Growth, Dominican Republic, Growth Accounting, ICT Capital, Total Factor Productivity.
Resumen: Este documento utiliza datos recientes de las bases de datos de Conference Board Total Economy para dar cuenta de las fuentes de crecimiento a largo plazo de la República Dominicana entre 1990 y 2018. Ajustamos los efectos de los ciclos económicos reales calculando el crecimiento del PIB entre picos cíclicos y controlando la calidad de los factores de producción y la diferencia entre la inversión de capital TIC y No TIC. Encontramos que los principales factores que explican la tasa de crecimiento del PIB son, en el orden: 1) El capital no TIC, 2) La cantidad de trabajo, 3) La productividad total de los factores, seguido en menor medida por, el Capital TIC y las contribuciones de calidad del Trabajo. De hecho, la productividad total de los factores explica aproximadamente el 24% del crecimiento total. Esto es consistente con el momento y la secuencia de las reformas estructurales implementadas en República Dominicana.
Palabras clave: Crecimiento económico, República Dominicana, Contabilidad del crecimiento, Capital TIC, Productividad total de los factores.
1. Introduction
The Dominican Republic has experienced a long and robust period of economic growth from 1990 to date, only interrupted by the Russian default in 1998, the domestic banking crisis and devaluation of the peso in 2003 and the global financial crisis 5 years later. From 1993 –2018 real GDP grew by 5.3% on average (Figure 1) raising GDP per capita from 7.5% to 13.5% of US GDP per capita. As a result, the GDP per capita grew fast and sustainably converging to a level around 15-20,000 PPP USD at 2018 constant prices, also reducing the gap with middle-income regional neighbors as Mexico or Chile or Central European countries.
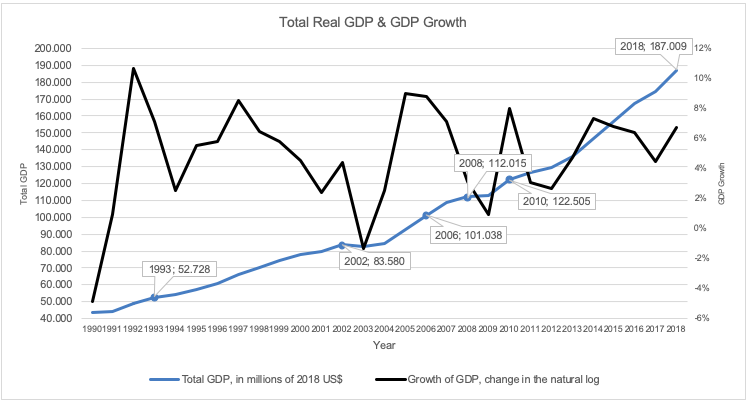
Note: The figure shows the evolution of the real GDP (in millions of USD 2018) and the annual real GDP rate of growth (in logarithms).
Source: The Conference Board Total Economy Database (April 2019). TED 1 & TED 2 Database.This strong growth performance was facilitated by some structural reforms and stabilization policies adopted during the 1990s and 2000s, which together with proximity to North American markets helped attract foreign direct investments (FDI) in manufacturing and the tourism sectors. Investment became the fastest growing component of domestic demand and increased its contribution from 16% to 24% of GDP between 1991 and 2017 (Galrao Cameiro, Iwulska, Reyes & Sánchez-Martín, 2015).
Indeed, the country embarked on a process of ambitious structural reforms since the 1990s that included reforms to trade policy, to the financial sector, to the education, and to the electricity and telecommunications supply. These were accompanied by several laws in the labor market and taxation, favoring some economic sectors and firms, and more importantly, they set the right incentives to the attraction of foreign investment.
Some of these reforms were amplified in the 2000s, for example, in the case of education the sign of the Education Pact in 2014 aimed to address the shortage of skilled labor. Initially, the first reforms consisted in changes to the financial monetary regime, and to the social security and health care systems. Later in the decade, the Dominican Republic implemented reforms associated with free trade agreements with the United States, the European Union, and public sector reforms following the FMI arrangements. All of this occurred in a context of weak governance and persistent inequality in income distribution despite higher economic growth.
A question which has not been adequately dealt with, nor accurately answered is what factors accounted for the Dominican Republic long-run growth in the light of the undergoing transformation of the country and recent structural reforms. Has human capital gained participation in the growth process? Has capital investment dominated the latter or has it yielded to other inputs or technological progress? In this regard, which is the role of innovation proxied by the Total Productivity of Factors (TFP), i.e. the share of economic growth not explained by investment, labor, education and the quality of these inputs?
How aggregate productivity changes over time may then depend on three critical aspects. First, the efficiency of each individual firm TFP is a function of several traits, such as entrepreneurial ideas, organization of the firm, the ability to innovate and use better technologies; and higher efficiency means being able to produce more from the current level of capital and from workers’ skills (Cavallo & Powell, 2018). An economy with firms that can extract more output from the same amount of inputs will have higher investment, labor, and human capital efficiencies.
The growth accounting exercise in this paper is performed avoiding the effects of cyclical recoveries and recessions (van Ark, O'Mahony & Timmer, 2008; Coremberg, 2014, 2017; Vu & Jorgenson, 2009), as well as adjusting for the quality of factors and dividing capital investment into ICT (Information and Communication Technologies) and Non-ICT (Jorgenson, 2005).
This methodology differs from previous growth accounting exercises for Dominican Republic precisely because the latter do not control for either input quality and the composition of fixed capital investment or the cyclical adjustment of GDP growth. The standard Solow approach tends to overestimate the TFP contribution to GDP growth, because the method does not consider the productivity components gains of the productive factors over time, or its composition (for example, the types of investment capital assets). So, quality factor adjustments are necessary to prevent biased conclusions of the pattern of technical change.
One example of the literature who use the standard Solow (1957) approach is Johnson (2013) who finds that TFP growth and fixed capital investment account for more than 50% of real GDP per capita growth in 2001-2018, while Johnson (2013) reports that TFP growth and fixed capital investment contribute 41,5% to GDP growth each, for a total of 83,02% of GDP growth in Dominican Republic during a shorter period, 2001-2011.
Other authors use some adjusted versions of the standard growth accounting methodology (Guzmán & Lizardo, 2013; Agosin, Machado & Nazal, 2003; Aravena, Escobar & Hofman, 2015). Guzmán & Lizardo (2013) estimate two growth accounting models depending on the approach to labor quality accounting: a) Mankiw, Romer and Weil, 1992; and b) Hall and Jones, 1999. Covering 1950-2000, they find that, on average, TFP growth was slightly negative over the whole period and it had a marginal contribution to GDP growth. On the contrary, GDP growth was mainly driven by fixed capital accumulation which explained 82.6% of total growth on average, and to a lesser extent by human capital contribution which accounted for 9,6%, on average, when adopting the Mankiw, Romer and Weil approach to measuring labor quality.
Agosin et al. (2013) use a growth accounting methodology that adjust the productive factors for productivity gains, i.e. they adjust the investment in machine and equipment by an estimated capital goods productivity growth annual rate, and the labor force by a component reflecting productivity gains attributed to years of education of the population older than fifteen years. They find that, in the period 1991-1999, the capital and labor contribution to growth were 39.65% and 37.93% respectively and the TFP growth represented a 20.68% of the GDP growth, on average. The authors argue that the TFP contribution to economic growth is consistent with the process of structural reforms in the nineties and with the emergence of new export sectors. Nevertheless, this annual measure of the TFP includes a cyclical factor utilization component (like changes in labor intensity or in the utilization of capital goods) which they left uncontrolled.
Finally, Aravena et al. (2015) study the sources of growth in Dominican Republic from 1990 until 2013, dividing the sample in four subperiods: 1990-1997, 1998-2003, 2004-2008 y 2009-2013. They adjust the productive factors for their quality, e.g. the quality of the labor force (hours worked weighted by the educational attainment level) applying a similar methodology of this paper, but with three important differences: 1) fixed capital services: the authors aggregate the capital services with an index of capital (composed with machineries and equipment, buildings, telecommunications, and information technology), while in this paper we separate out the contribution of fixed capital to growth stemming from the services of ICT assets and Non- ICT assets, 2) criteria to period studied: they do not divide the chosen period (1990-2013) to control for the effect of business cycles on TFP; and 3) sample period: it ranges from 1990 until 2013, while in this paper we extend the coverage until 2018. The authors find that fixed capital had the largest contribution to GDP growth (77.55%, in average), that labor had, on average, the second largest contribution to GDP growth (42.86%) and the TFP growth was negative for the whole period, representing -20.41% of GDP growth.
Our paper presents fresh data from the US Conference Board Total Economy (TED) databases and uses the WorldKlems methodology (Jorgenson, 2005; van Ark et al, 2008; Coremberg, 2008, 2014 and 2017) to account for the Dominican Republic sources of long-run growth in 1990-2018, adjusting for the effects of real output cycles, the quality of production factors and the distinction between ICTs and NON-ICTs investment. To our knowledge, this is the first attempt to apply this methodology to Dominican Republic and could be further extended to other small, open Caribbean economies.
Section 2 presents the dataset and methodology to perform the growth accounting. Section 3 shows the results and discusses their implications for long-run growth analysis and economic policy, and Section 4 concludes.
2. Data and Methodology
2.1. Data
Our main data source is The Conference Board Total Economy Database (TED). It provides a comprehensive database with annual data covering Gross Domestic Product (GDP), population, employment, hours, labor quality, capital services, labor productivity, and total factor productivity (TFP) for 123 countries in the world.
Beginning with the November 2016 interim release, TED is released in two versions. The original version uses official price deflators to deflate nominal GDP and (whenever available) ICT investment (which include computer hardware and equipment, telecommunication equipment and computer software and services), while the adjusted version uses alternative ICT investment goods deflators developed by Byrne, Fernald & Reinsdorf (2016); Byrne & Corrado (2017a, 2017b) to deflate ICT investment. In the adjusted version, GDP deflators in three countries – United States, China and Japan – with a high share of ICT production and exports, are modified with this new ICT deflator. Consequently, real GDP growth rates are adjusted for these countries and will not match the official data.
We select the two following databases[1] in their adjusted versions:
· TED1: This file contains time series data on Gross Domestic Product (GDP), Population, Employment, Total Hours Worked, Per Capita Income and Labor Productivity (measured as GDP per Person Employed and GDP per Hour Worked). Data is available for 123 countries, plus a second version of Chinese data based on alternative data, covering the period 1950-2019.
· TED2: file contains time series data on the contributions of factor inputs - labor (Labor Quantity and Labor Quality), capital (Non-ICT Capital Services and ICT Capital Services) and Total Factor Productivity Growth (TFPG) - to GDP growth, obtained using a growth accounting method. The file also contains data on the Share of Labor Compensation in GDP which is used to assign weights to the factor inputs in deriving their contributions to GDP growth. Data is available for 123 countries, plus a second version of Chinese data based on alternative data, covering the period 1990-2018.
2.2. Methodology
In the standard Solow's growth accounting framework, GDP growth is decomposed into contributions from capital, labor, and total factor productivity growth. The WorldKlems project (Jorgenson, 2005; van Ark et al 2008; Coremberg 2008,2017) improves the standard framework arguing that the contribution of factor inputs labor and capital can be disaggregated into quantities (hours worked or employment and capital stock) and quality or composition, i.e. the composition of workers in terms of educational attainment and the composition of capital in terms of various asset types or asset groups such as ICT and non-ICT assets). The contribution of these factors to GDP growth are obtained from multiplying the share of factor compensation in the GDP and its rate of growth in a period. Total factor productivity (TFP) growth accounts for the changes in output not caused directly by changes in labor and capital inputs. It represents the effect of technological change, efficiency improvements, innovation, and our inability to measure the contribution of all other inputs. It is estimated as the residual once the contributions of labor and capital quantities and qualities, and the disaggregation of capital into ICT and non-ICT are deducted from GDP growth.
Equations 1, 2 and 3, present this formally,
Where the main variables represent:
: Output growth
: The share of factor inputs in GDP
: The total factor productivity growth
where the labor contribution to GDP growth is defined as the sum of the effects: quantity of employment, either obtained from total hours worked or total persons engaged () and the quality effect ().
where total capital services contribution to GDP growth can be decomposed into ICT capital assets growth () and non-ICT capital assets growth ().
We divide the Dominican Republic Real GDP Growth rate into their components (already described) over the period 1990-2018, in two different ways. First, we split the sample period into six, five-year sub-periods like in OECD (2001a, 2001b) and the convergence literature which points out that the average of growth rates over a five-year period removes the cyclical effects on economic growth. Second, we split the sampled period based on GDP peaks we identify along the overall GDP trajectory.
Figure 1 above depicts the evolution of real GDP and its rate of growth during 1990-2018 over which we are able to pin down several economic cycles and their peaks between them. These are: 1993, 2002, 2006, 2008, 2010 and 2018 (omitting 1990-1992 because of lack of data for previous years).
Under this methodology we are able to obtain a more accurate estimation of the contributions of inputs and the TFP to long-run economic growth because, as explained in Jorgenson (2005), van Ark et al (2008), Coremberg (2008) and Coremberg (2017), this eliminates the overestimation of the TFP whether an economy is recovering from a recession and moving on into a growth acceleration process. This is the case because the GDP growth between cyclical peaks is lower than during a recovery phase as the former is based on productivity gains derived from innovation and other effects that shift the production possibilities frontier instead of the latter which measure changes in production capacity utilization. Also, this allows separating out the strict TFP from cyclical changes in input utilization because of the business cycle.
3. Results
Below are the results of our growth accounting exercise for the Dominican Republic in 1990-2018.
As to the Worldklem's methodology, we find that, on the one side Non-ICT capital and employment were the most relevant factors which explained economic growth, representing on average a 39.13 percent and a 27.70 percent of the GDP growth rate. Total factor productivity growth contributed a non-negligible 24.43 percent of output growth on average over the whole period. On the other side, the ICT Capital contribution was at a 4.92 percent while the Labor quality contribution was the slightest (3.82 percent), on average (Figure 2).
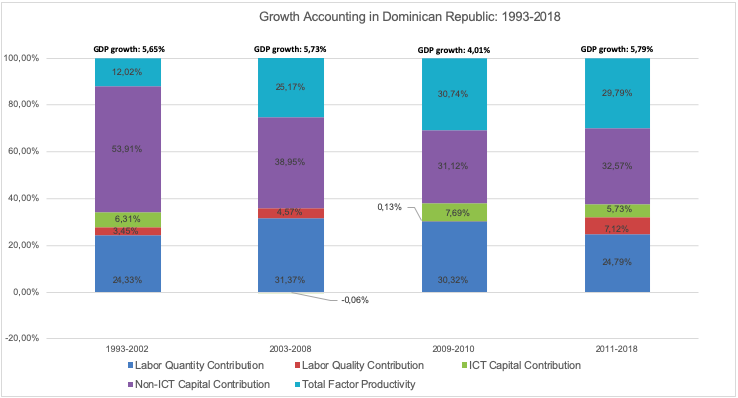
Note: The figure shows the decomposition of real GDP growth into its components (TFP, Capital Contribution TIC and non-TIC, Labor contribution quality and quantity) as percentage of GDP for five sub-periods. The figure shows average annual growth rates between peaks of economic cycles, based on the next periodicity: 1993-2002; 2003-2008; 2009-2010; 2011-2018.
Source: The Conference Board Total Economy Database (April 2019). TED 2 Database.For the sake of comparison, we also perform an accounting exercise dividing the sample in five-year average sub-samples (Figure 3) we find that the Non-ICT capital was the main contributor to GDP growth in all six sub-periods, except for 1990-1994, explaining a total of 2.2 points of to GDP growth on average, for the entire period. The labor quantity or employment had the second larger contribution to GDP growth, averaging a total of 1.6 percent. In contrast to the findings of the OECD (2019), the Total Factor Productivity contribution was less important (0.6 percentage points on average). Considering that GDP growth over 1990-2018 reached an annual average rate of 4.9 percent the TFP only accounted for an 11.6 percent of it on average. although the TFP growth contribution was more important than the ICT capital and labor quality contributions (between 5 and 10% of the total growth rate, respectively).
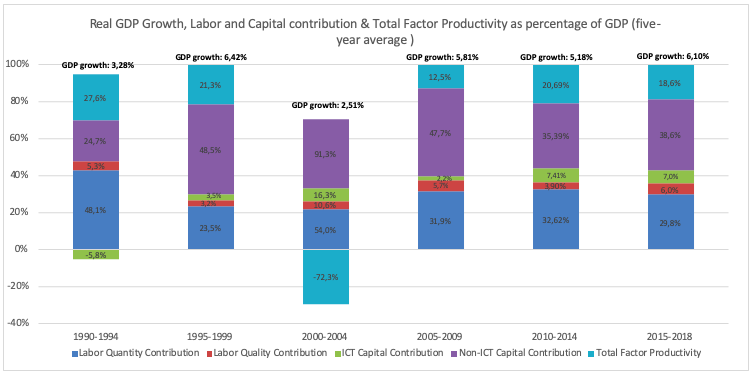
Note: The figure shows the decomposition of real GDP growth into its components (TFP, Capital Contribution TIC and non-TIC, Labor contribution quality and quantity) as percentage of the GDP growth for six different sub-periods. The figure shows average annual growth rates for five-year periods
Source: The Conference Board Total Economy Database (April 2019). TED 2 Database.To summarize, the main factors that explain the GDP rate of growth in the Dominican Republic from 1990 to 2018 are, in the order: 1) Non-ICT Capital, 2) Labor Quantity, 3) The Total Factor Productivity, followed to a less extent by, the ICT Capital and Labor quality (human capital). This is consistent with the timing and sequencing of structural reforms and the investments in the most productive sectors of the economy, as mentioned above.
4. Conclusions
The Dominican Republic enjoyed one of the strongest growth rates in Latin America and the Caribbean over the past 20 years to 2018. Between 1992 and the year 2002, the Dominican Republic economy grew at an average rate of 6 percent per annum, being the top performer in the region. Despite the banking crisis of 2003, which had a strong impact on the country's main macroeconomic and social indicators, the Dominican Republic economy could maintain a high average growth rate of 5.2 percent per annum until 2018. What was the contribution of inputs and the TPF to these growth rates according to our growth accounting exercises?
In this paper we answered that question using the WorldKlem's methodology over the period 1990-2018. That methodology adjusts for the influence of changes in relative prices of production factors (quality and composition effects) and cyclical changes in factor utilization. Our general result was that GDP growth in was mainly driven by Non-ICT capital services, the quantity of employment, and the total factor productivity growth in that order.
Despite the different methodologies and sample periods of previous growth accounting exercises performed for Dominican Republic, we found like Guzmán & Lizardo (2003), Agosin et al. (2003) and Aravena et. al (2015)- in their adjusted growth accounting applications- that, in the long term, fixed capital investment was the main factor that explained the GDP growth in Dominican Republic, followed by the labor contribution to GDP. However, our findings as to the role of TFP differ from the literature. Except for Agosin et al (2003) who found an average TFP growth contribution of 20.68% and Johnson (2013) of about 40% though using a shorter sample and without adjusting for business cycles or input qualities, all other authors found an extremely low or negative contribution of TFP growth to GDP on average. In this paper, we a came up with positive TFP growth contribution to GDP growth in the range of 11.6% to 24.43% on average.
The main implications of our findings are that for Dominican Republic to increase and sustain its per capita long-run growth rate around 3% a year, it should continue enhancing production diversification towards tradable goods, increase exports, strengthen and continue education policies to increase the future stock of human capital and promote innovation policies addressed to augment productivity in the services sector alongside an increase in formal employment.
References
Agosin, M., Machado, R., & Nazal, P. (2003). Pequeñas economías, grandes desafíos: Políticas económicas para el desarrollo en Centroamérica. Washington, D.C.: Inter-American Development Bank.
Aravena, C., Escobar, L. E., & Hofman, A. (2015). Fuentes del crecimiento económico y la productividad en América Latina y el Caribe, 1990-2013. CEPAL, Serie Macroeconomía del Desarrollo No. 164
Byrne, D. M., Fernald, J. G., & Reinsdorf, M. B. (2016). Does the United States have a productivity slowdown or a measurement problem?. Brookings Papers on Economic Activity, 2016(1), 109-182.
Byrne, D., & Corrado, C. (2017a). ICT Prices and ICT Services: What do they tell us about Productivity and Technology? Board of Governors of the Federal Reserve System, Finance and Economics Discussion Series, 2017(015). doi:10.17016/feds.2017.015
Byrne, D., & Corrado, C. (2017b). ICT Asset Prices: marshaling evidence into new measures. Board of Governors of the Federal Reserve System, Finance and Economics Discussion Series, 2017(016r1). doi:10.17016/feds.2017.016r1
Cavallo, E. & Powell, A. (2018). A mandate to grow: 2018 Latin American and Caribbean Macroeconomic Report. Washington D.C.: Inter-American Development Bank.
Coremberg, A. (2008), The measurement of TFP in Argentina, 1990-2004: Another case of the tyranny of numbers, economic cycles and methodology. International Productivity Monitor,17, 52-74.
Coremberg, A. (2014). Measuring Argentina’s GDP Growth. World Economics, 15(1), 1-32
Coremberg, A. A. (2017). Argentina was not the productivity and economic growth champion of Latin America. International Productivity Monitor, 33. 77-90.
Jorgenson, D. (2005) Accounting for growth in the information age. En P. Aghion y S. Durlauf (eds), Handbook of Economic Growth vol. 1A (pp. 743–815). Amsterdam: Elsevier
Guzmán, R. & Lizardo, M. (2003). Crecimiento económico, acumulación de factores y productividad en la República Dominicana. Washington D.C.: Inter-American Development Bank.
Vu, K. & Jorgenson, D. (2009). Growth accounting within the International Comparison Program. ICP Bulletin, 6(1), 3-19.
Johnson, C. A. (2013). Potential output and the output gap in Central America, Panama and Dominican Republic. International Monetary Fund. IMF Working Paper, No. 13/145. Retrieved from: https://www.imf.org/en/Publications/WP/Issues/2016/12/31/Potential-Output-and-Output-Gap-in-Central-America-Panama-and-Dominican-Republic-40667
OECD (2001a) Measuring Productivity: OECD Manual on Measurement of Aggregate and Industry-Level Productivity Growth. Paris: OECD Publications.
OECD (2001b) Measuring Capital: OECD Manual on Measurement of Capital Stocks, Consumption of Fixed Capital and Capital Services. Paris: OECD Publications.
Solow, R. (1957). Technical Change and the Aggregate Production Function. The Review of Economics and Statistics, 39(3), 312-320.
Van Ark, B., O’Mahony, M., & Timmer, M. P. (2008). The Productivity Gap between Europe and the United States: Trends and Causes. Journal of Economic Perspectives, 22(1), 25–44. doi:10.1257/jep.22.1.25
Galrão Carneiro, F., Iwulska, A., Reyes, J. D., & Sánchez-Martín, M. E. (2015). Resilient growth, persisting inequality: identifying potential factors limiting shared prosperity in the Dominican Republic. World Bank. Caribbean Knowledge Series, No. 1/15. Retrieved from: http://documents1.worldbank.org/curated/en/963381468023945128/pdf/939520WP0Box380ANCHEZ0201500PUBLIC0.pdf
Notes
Author notes
martin_grandes@uca.edu.ar
Additional information
JEL Codes:: O47, O54, E22.

