Servicios
Servicios
Buscar
Idiomas
P. Completa
Uruguayan honey from different regions, characterization and origin markers
Cracco, P.; Cabrera, C.; Cadenazzi, M.;
Cracco, P.; Cabrera, C.; Cadenazzi, M.; Galietta, G.; Moreni, A.; Santos, E.; Zaccari, F.
Uruguayan honey from different regions, characterization and origin markers
Caracterización de mieles de diferentes regiones de Uruguay, marcadores de origen
Caracterização de méis de diferentes regiões do Uruguai, marcadores de origem
Agrociencia Uruguay, vol. 26, no. 1, 2022
Universidad de la República
resúmenes
secciones
referencias
imágenes

Abstract: 
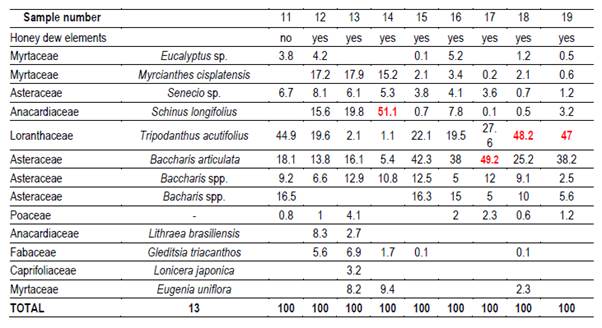
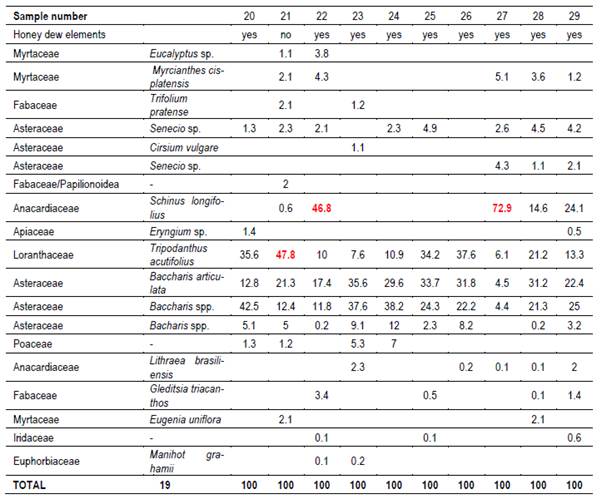
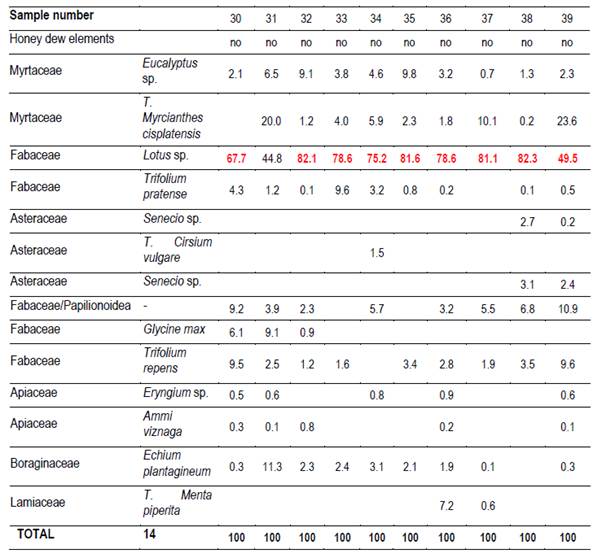
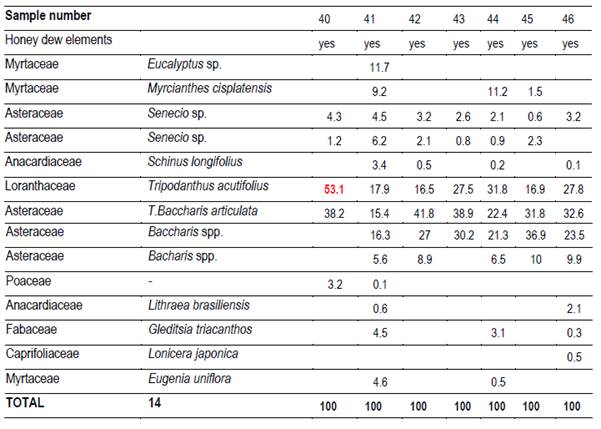
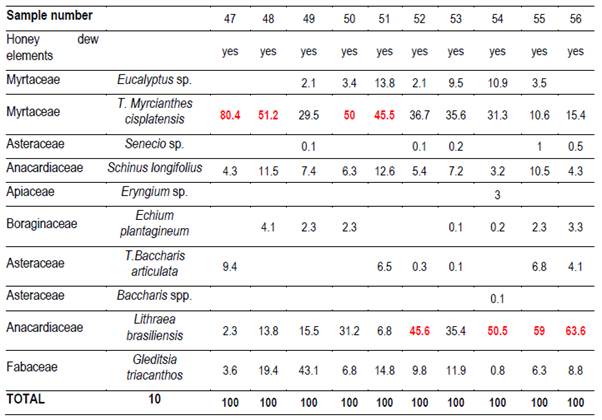
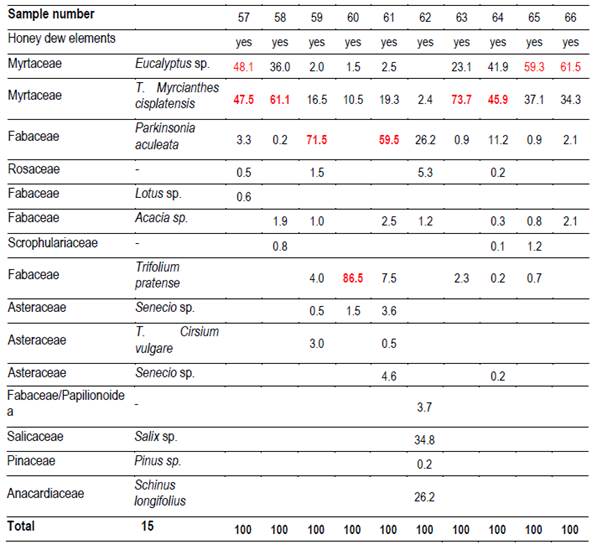
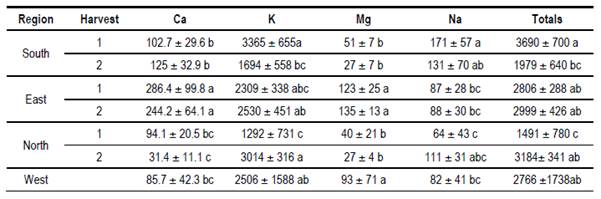
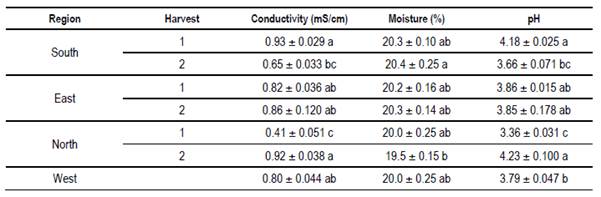
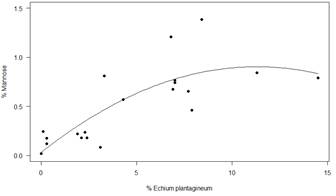
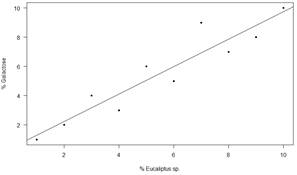
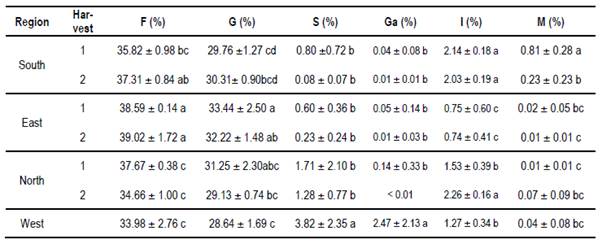
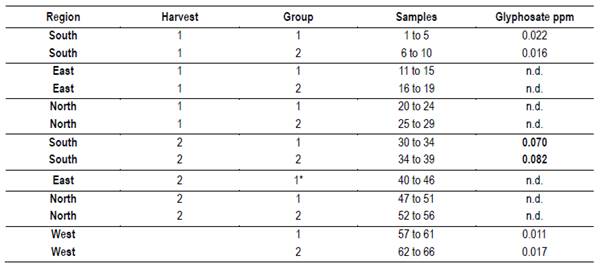
Uruguay produces and exports honey. Honey is appreciated worldwide and has been well studied in terms of its chemical composition. These studies help determine botanical origin and prevent fraud. However, Uruguay exports honey without differentiating; the diversity of soils and vegetation in the country allows different types of honey production. Therefore, the aim of this work was to characterize honey from four regions of the country including three protected areas. The samples were collected during one year in two stations and electrical conductivity, humidity, sugar profile, macrominerals (K, Ca, Na and Mg) and pollen content were analyzed. The quality of the studied environments was evaluated by determining the presence of glyphosate. Results from this study confirm significant differences among the analyzed honeys from the different regions (Tukey-Kramer, p <0.05). Most of the measured values ​​were within world ranges. However, some samples with high conductivity (> 0.8 mS / cm) associated with high mineral content were found. 37 different pollen taxa (family, genus or species) were detected. Some samples are monofloral (main pollen> 45%) of cultivated species (Lotus sp and Trifolium repens) or native species (Parkinsonia aculeata, Lithraea brasiliensis, Myrcianthes sp and Tripodanthus acutifolius). Calcium and sodium are suggested as markers of geographic origin. Mannose is suggested as a marker of botanical origin. The detection of glyphosate appears associated with agricultural activities even in protected areas. Uruguay produces different honeys that can be marketed indicating origin. More regions should be studied and for longer periods.

Keywords: protected areas, honey, sugar profile, mineral profile.

Resumen: Uruguay produce y exporta miel, alimento mundialmente apreciado y estudiado en términos de su composición química. Estos estudios ayudan a determinar el origen geográfico y botánico y a prevenir fraudes. Sin embargo, Uruguay exporta miel sin diferenciar. La diversidad de suelos y vegetación del país permite diferentes tipos de producción de miel. El objetivo de este trabajo fue caracterizar la miel de cuatro regiones del país, de las que tres son áreas protegidas. Las muestras se recolectaron durante un año en dos estaciones. Se analizó conductividad eléctrica, humedad, perfil de azúcar, macrominerales (K, Ca, Na y Mg) y contenido de polen. Se evaluó la calidad de los ambientes estudiados determinando la presencia de glifosato. Se encontraron diferencias entre las mieles analizadas (Tukey-Kramer, p <0.05). La mayoría de los valores medidos estaban dentro de los rangos mundiales. Sin embargo, se encontraron algunas muestras con alta conductividad (> 0.8 mS / cm) asociadas a altos contenidos minerales. Se detectaron 37 taxas de pólenes diferentes (familia, género o especie). Algunas muestras son monoflorales (polen principal> 45%) de especies cultivadas (Lotus sp y Trifolium repens) o especies nativas (Parkinsonia aculeata, Lithraea brasiliensis, Myrcianthes sp y Tripodanthus acutifolius). Se sugieren calcio y sodio como marcadores de origen geográfico. Se sugiere la manosa como marcador de origen botánico. La detección de glifosato aparece asociada con las actividades agrícolas incluso en áreas protegidas. Uruguay produce diferentes mieles que se pueden comercializar indicando origen, se deberían estudiar más regiones y durante más tiempo.

Palabras clave: áreas protegidas, miel, perfil de azúcares, perfil de minerales.

Resumo: O Uruguai produz e exporta mel. Um alimento apreciado em todo o mundo e estudado quanto à sua composição química. Esses estudos ajudam a determinar a origem geográfica e botânica e a prevenir fraudes. No entanto, o Uruguai exporta mel sem se diferenciar. A diversidade de solos e vegetação do país permite diferentes tipos de produção de mel. O objetivo deste trabalho foi caracterizar mel de quatro regiões do país. Três são áreas protegidas. As amostras foram coletadas durante um ano em duas estações. Condutividade elétrica, umidade, perfil de açúcar, macrominerais (K, Ca, Na e Mg) e conteúdo de pólen foram analisados. A qualidade dos ambientes estudados foi avaliada pela determinação da presença de glifosato. Foram encontradas diferenças entre os méis analisados ​​(Tukey-Kramer, p <0,05). A maioria dos valores medidos estava dentro de faixas mundiais. No entanto, algumas amostras com alta condutividade (> 0,8 mS / cm) associadas a alto teor de minerais foram encontradas. 37 taxa de pólen diferentes (família, gênero ou espécie) foram detectados. Algumas amostras são monoflorais (pólen principal> 45%) de espécies cultivadas (Lotus sp e Trifolium repens) ou espécies nativas, Parkinsonia aculeata, Lithraea brasiliensis, Myrcianthes sp e Tripodanthus acutifolius). O cálcio e o sódio são sugeridos como marcadores de origem geográfica. A manose é sugerida como um marcador de origem botânica. A detecção do glifosato aparece associada às atividades agrícolas mesmo em áreas protegidas. O Uruguai produz diferentes méis que podem ser comercializados com indicação de origem. Mais regiões devem ser estudadas e por mais tempo.

Palavras-chave: áreas protegidas, mel, perfil de açúcar, perfil mineral.

Carátula del artículo

Animal production and pastures

Uruguayan honey from different regions, characterization and origin markers

Caracterización de mieles de diferentes regiones de Uruguay, marcadores de origen

Caracterização de méis de diferentes regiões do Uruguai, marcadores de origem

Cracco, P.
Universidad de la República, Uruguay
Cabrera, C.
Universidad de la República, Uruguay
Cadenazzi, M.
Universidad de la República, Uruguay
Galietta, G.
Universidad de la República, Uruguay
Moreni, A.
Universidad de la República, Uruguay
Santos, E.
Universidad de la República, Uruguay
Zaccari, F.
Universidad de la República, Uruguay
Agrociencia Uruguay
Universidad de la República, Uruguay
ISSN-e: 2730-5066
Periodicity: Bianual
vol. 26, no. 1, e947, 2022

Received: 27 July 2021

Accepted: 21 September 2021

Published: 10 February 2022


Corresponding author: pcracco@gmail.com

1. Introduction

Despite its size, Uruguay has variations in climate(1), geology(2), soil(3) and vegetation(4). These variations would allow the production of different honeys. In addition, the country has a national system of protected areas (SNAP) where native vegetation occurs without competition from crops and their associated weeds, and where agrotoxic contamination is not expected. However, honey produced in Uruguay is exported without differentiating as a commodity. Nevertheless, honey is a food product that many countries want to regulate and also differentiate in its botanical or geographical origin. Honey is valorized by its phenolic compounds(5), mineral content(6), its content of particular sugars(7) and also by the positive effect of its intestinal absorption(8), and to prevent gastric affections(9). Concerning the origin, honey is characterized by the botanical origin, searching to differentiate between floral or extra floral and among the floral, mono or multiflorals(10)(11). Some honey such as Manuka honey has an added-value because it came from a native New Zealand myrtaceae (Leptospermum scoparium) and it is associated with medicinal properties(12). Geographical origin(13) enables to avoid honey coming from contaminated regions as much as to ensure consumers that honey comes from natural or protected areas(5). To determine the honey origin many analytical procedures were developed concerning flavonoids or sugars profile, or trace element and mineral content(14)(15)(16). Geographical origin was not specified in previous works about honey quality in Uruguay(17)(18(19). The importance of honey as an exportable product and the opportunity to enhance protected areas for this production make it necessary to investigate honey from these areas. In these areas the risk of appearance of contaminants such as glyphosate is minimized. In the last years glyphosate was detected and stopped honey exportation. In this sense, the objective of this work was to characterize Uruguayan honey from three protected areas and one not protected area throughout the year by physicochemical parameters, nutritional compounds and palynology, looking for possible markers of geographical or botanical origin. Also, glyphosate presence was evaluated.

2. Materials and methods
2.1 Location of apiaries

The locations of the apiaries chosen allowed to show both a latitude effect (higher temperature and rainfall in the north) and a longitude effect (similarity to Argentinean flora in the west or similarity to Brazilian flora in the east). Three of the selected sites (north, west and east) are Protected Areas belonging to the Uruguayan National System of Protected Areas (SNAP in Spanish), while one of them is not (south). The georeferentiation, soil types and location names are presented in Table 1. Local bees characterized by the predominance of hybrids were used(20). The rainfall and temperature data of each production season are presented in Table 2. Oxalic acid was used against Varroa destructor control, except in the East.

Table 1
Geographical location of apiaries and names of protected areas (East, North and West) and non-protected area (South) with information about soils and date of harvest, group honey names and number of samples

(*)SNAP: Sistema Nacional de Áreas protegidas. (**) Soil names according United States Department of Agriculture (USDA). (1) Hives lost by Varroa destructor (2) Only a harvest was obtained due to Climatic adverse conditions.

Table 2
Climate data during honey production by region and season

In bold values above the national means

Data from Instituto Uruguayo de Meteorologia (INUMET) (unreferenced)


2.2 Extraction of samples of honey

In each region 10 hives (Langstroth) were used, and unstretched commercial wax was placed in the center (frames 4 and 5) of the first box on the brood chamber. Two samples were taken from each hive. One hundred percent capped pieces of honeycomb were cut with disposable plastic knives. These combs were placed in labeled sterile jars and stored at -20°C. Honey was extracted from these combs into the laboratory. For this reason, hydroxymethyl furfural (HMF) was not measured(21). Combs were extracted in two harvests, at spring-summer (December-February; harvest 1) and at summer-autumn (March-May; harvest 2). 66 samples were obtained (Table 1).

2.3 Palynological analysis

Twenty g of honey were dissolved with distilled water, according to Louveaux(22). After centrifugation residual extract was observed with a microscope at 400x magnification. Six hundred pollen grains were counted to determine the relative abundance of each taxa(23). Moreover, the presence of honeydew elements (HDE) was determined (e.g. algae, spores or hyphae fungi and microcrystals), as present or not.

2.4 Electrical conductivity (EC), pH and moisture

The EC and pH of 20% (w/v) honey solution was measured at 20ºC using a conductivity meter CON 10 (Oakton, USA) and a pHmeter JENWAY 3305 (U.K.). The honey solution was prepared in milli-Q® water (conductivity < 10 μS/cm). The results of conductivity were expressed as milli Siemens per centimeter (mS/cm). Moisture content was measured by refractometry according to the AOAC method(24) with a manual refractometer ATAGO-MASTER 3 M (58° to 90° Brix), using a drop of honey of each hive. Data are expressed as moisture percentage (%).

2.5 Ca, Mg, Na and K content

The total Ca, Mg, Na and K were determined according to Paul(25), using a flame atomic absorption spectrophotometer (PinAAcleTM 500, Perkin Elmer, USA). Briefly, 2 grams of honey were dissolved on a hot plate with a solution of HNO3 1M (Merck 65% p.p.a., distilled by sub boiling) and HCl 6 M (Merck, p.p.a.) in a Erlenmeyer under trap of steam during an hour at sub boiling (< 75°C), and were taken to volume of 25 ml with Milli-Q® water (18 MΩ.cm). Determinations were carried up with air-acetylene flame, (10-2.5, l/min). A multielement lamp, Lumina (Perkin Elmer, USA) was used for Ca (422.7 wavelength) and Mg (285.2), whereas Na and K were measured with emission (589 and 404.4 wavelength, respectively). For each analyte a standard curve was prepared from stock solutions of Ca, Mg, Na y K of 1000 mg/l (CertipurR, Merck, Germany). A blank (only the acids) was run with the samples. LQ was 1.386, 0.176, 0.110 and 7.826 mg/l for Ca, Mg, Na and k, respectively. Data were expressed in milligrams of each mineral by kilogram of honey (mg/kg).

2.6 Sugars content

Sugars were determined by high performance liquid chromatography (HPLC). One gram of honey of each sample was dissolved with 20 ml of deionized H2O and vortexed to homogenize. Solution was filtered previously to inject in the HPLC, with PVDF filters of 13 mm of diameter and 0.45µm of porous (Merck Millipore). A HPLC Prominence, LC-20A series, Shimadzu Corporation (Japan) was used, equipped with IR differential detector (RID-20A), a low-pressure gradient valve (LC-20AT), enabling 4-solvent gradient elution, auto sampler (SIL-20AC HT), oven (CTO-10AS VP) and degassing unit (DGU-20A 5R). Data was processed using LabSolutions software. A column Luna Omega SUGAR 100 Å, 3 µm, 250 x 4.6 mm (Phenomenex, USA) thermostatized at 40ºC was used. Mobile phase was Acetonitrile: H2O (80:20) with a flux of a 1ml.min-1. RID detector was thermostatized at 40ºC. Total time of each run was 30 min. To quantify sugars the following external standards from Sigma-Aldrich, USA, were used: D(-)-Fructose, D(+/-)- Sucrose (99.5%), D(+/-)-Galactose (≥99%), D(+/-)-Mannose (≥99%). For Glucose and isomaltulose, D(+/-) -Glucose anhydride AR® ACS (97-102%, Macron Fine Chemicals, USA) and Isomaltulose (94.5%, USP Reference Standard, USA) were utilized. Calibration curves were made for each sugar. Data were expressed as g of sugar by 100 g of honey (%). Limit of Quantification (LOQ) ≥ 0.01%.

2.7 Glyphosate content

Glyphosate determination was carried up with HPLC coupled with a mass spectrometer (LC-MS/MS), in the QSI Laboratory (Bremen Deutschland/Germany). For each region and harvest date samples were grouped to obtain 50 grams of honey. All regions and harvest dates had two groups, except for East 2 due to having only 7 hives to sample. Data were expressed as mg/kg. Limit of Detection was 0.005 mg/kg.

2.8 Statistical analysis

Data were analyzed by analysis of variance (ANOVA), comparing seven groups of honey (East 1 and 2, North 1 and 2, South 1 and 2, and West), and post hoc Tukey-Kramer test. The normality of residuals was adjusted by graphic methods (QQplot) and the Levene's test was used to test the homogeneity of the variance. Principal Component Analysis (PCA) was used to search the associations between physicochemical variables of the different honey and regions. The data was standardized. Electric conductivity, pH, sugar and minerals content were analyzed to group the different types of honey and the region considering two harvests. The relation between pollen content, Galactose and Mannose was determined by linear regression. Software R was used(26).

2.9 Transparency of data

The entire data set that support the results of this article appear in the article itself, or as a supplementary material section.

3. Results
3.1 Palynology

It was possible to determine the family, genus or species of 37 types of pollen. Results are shown by region and harvest date in Tables 3,4,5,6,7,8 and 9. The 66 honeys underwent a principal component analysis that is represented in Figure 1. West honeys show a great variation and are distributed in 3 quadrants. On the other hand, the other honeys are associated with one of the quadrants, varying with the harvest date. Eastern honeys are associated with a single quadrant regardless of the harvest date. Some regions present similar honeys despite the distance (South 1 and 2 and North 2). North has different honeys in different seasons.


Figure 1
PCA of 7 groups of Honeys, number samples are: red (east), green (north), blue (south) and black (west)

Table 3
Name and number of taxa, honey dew element presence and percentage of pollen in South 1

Table 4
Name and number of taxa, honey dew element presence and percentage of pollen in East 1

In red bold, monofloral samples (> 45 %)

Table 5
Name and number of taxa, honey dew element presence and percentage of pollen in North 1

monofloral samples (> 45 %)

Table 6
Name and number of taxa, honey dew element presence and percentage of pollen in South 2

In red bold, monofloral samples (> 45 %)

Table 7
Name and number of taxa, honey dew element presence and percentage of pollen in East 2

In red bold, monofloral samples (> 45 %)

Table 8
Name and number of taxa, honey dew element presence and percentage of pollen in North 2

In red bold, monofloral samples (> 45 %)

Table 9
Name and number of taxa, honey dew element presence and percentage of pollen in West

In red bold, monofloral samples (> 45 %)

3.2 Mineral content, conductivity, pH and moisture

In Table 10 mean values of calcium, potassium, magnesium, sodium and the sum of them are presented. All samples analyzed had a higher mineral content than previously reported by others(27)(28)(29). In Table 11 mean values of conductivity, moisture and pH are presented. Despite floral origin, some honey samples showed high conductivity. The moisture values are within what is accepted(30). The pH values are similar to other values found for Uruguayan honey(17).

3.3 Sugar content

In Table 12 mean values of Glucose (G), Fructose (F), Sucrose (S), Isomaltulose (I), Mannose (M) and Galactose are presented. A quadratic relation (Figure 2) was obtained between the content of Mannose and the percentage of pollen from Echium plantagineum in the first harvest of the south (R2= 0.64, y = 0.029 + 0.155x+ 0.0068x²). A linear relation (Figure 3) was detected between Galactose content and percentage of pollen from Eucalyptus sp. in the west region (R2=0.81 y = 0.351 + 0.077 x).

Table 10
Calcium (Ca), potassium (K), magnesium (Mg), sodium (Na) and totals (Ca+K+Mg+Na) content (mg/kg) from different regions and harvest date

Values are means ± SD; values within a column not sharing a common letter are significantly different (Tukey-Kramer < 0.05).

Table 11
Conductivity (mS/cm), moisture (%) and pH from different regions and harvest date

Values are means ± SD; values within a column not sharing a common letter are significantly different (Tukey-Kramer < 0.05.


Figure 2
Mannose content (%) and average pollen content of Echium plantagineum (%)


Figure 3
Galactose content (%) and average pollen content of Eucalyptus sp. (%)

3.4 Glyphosate content

Glyphosate was detected in south and west regions (Table 13). In the South, above the maximum limit of residual admissible by the European Union (0.05 mg/kg).

Table 12
Fructose (F), glucose (G), sucrose (S), galactose (Ga), isomaltulose (I) and mannose (M) content (%) from different regions and harvest date

Values are means ± SD; values within a column not sharing a common letter are significantly different (Tukey-Kramer < 0.05)

Table 13
Values of glyphosate by region, harvest and group

I bold values higher than those established by European standards; n.d. Not detected; * Only 7 hive for sample

4. Discussion
4.1 Palynology and PCA

The great dispersion in different quadrants of western honeys can be botanically explained. In the west we found 4 monofloral samples of Myrcianthes, 2 of Parkinsonia aculeata, 1 of Trifolium pratense. The remaining 3 are multifloral with different percentages of different pollen. The differences in vegetation and the soils where these plant species are found originate both groups of north honeys that could explain the differences between North 1 and 2; Baccharis is found in shallow soils (North 1) while Lithraea, Myrcianthes and Gleditsia in deep soils (North 2).

The two southern honeys are close in the PCA and present minor differences. The vegetation that originates is in the same soils but one is multifloral honey (South 1), while the other is monofloral Lotus honey (South 2). Some of the analyzed variables have a great impact on the results (e.g., Ca and Mg in East, Na in South 1). Species not previously cited from Uruguay honeys were found, like Parkinsonia aculeata, Tripodanthus acutifolius and Lithraea brasiliensis(18)(31). This would be explained by the fact that samples were taken from different regions of the country in different seasons. Unlike other works(17)(18)(19)(31), this one collected honey from different parts of the country for a year and directly from the hives. In addition, direct extraction from the honeycomb ensures that different or lesser pollen appears and is not diluted. These species generate monofloral honeys, which marks the preference of bees for them.

4.2 Moisture, pH and minerals

Values within world ranges were found for humidity, pH and sugars. High conductivity values (> 0.8 milliS / cm) were found for some honeys. These values could indicate an extrafloral origin. However, although some samples have HDE, the HDE/pollen ratio is less than 3(23). In addition, the sum of fructose plus glucose is greater than 60%, complying with the European standard for floral honeys. In the region (Argentina) other works report honeys with high conductivity, although they relate it to honeydews(32). The reported values correspond to other studies from Uruguay(17)(19). Also, high mineral content was found in the sum of the four minerals analyzed. Potassium is the dominant mineral as in other honeys from Apis(6)(27)(28) or from Meliponas(33).This mineral exceeds the average of 742 mg / kg cited(28). The soils of Uruguay present variable potassium contents associated with the content of clays and minerals that originate the soil(34). Differences in Ca values were found in the east more than in other regions, higher than the average calcium found in Brazil(6), and in other countries of the world(29). In Europe, only 4 values higher than the average for the eastern region are reported(28). Also in the east are high values of Mg, although Mg is reported as a mineral with greater variation in its values(29). The soils and waters of this region have high Ca and Mg contents explained by geology(35). In the south, a higher sodium content was observed on both dates, without statistical differences. In contrast to the Ca, Na would not be a mineral that allows discrimination origin(16), but in Uruguay, proximity to the sea and the absence of barriers to the sea winds could explain the values found in the south apiary. Sodium could be considered a “pollutant”, which comes through the air as heavy metals or pesticide molecules(36). This could be valid for the entire coastal region of the Río de la Plata and the Atlantic Ocean.

4.3 Sugars

Sugar values are among the range reported in many studies around the world(37)(38)(39). In all honeys the sum of F+G is more than 60%. This supports the floral origin of the honeys despite the presence of HDE. Eastern region shows higher fructose values than the other regions, but within the world ranges(40)(41). The relationship found between Mannose and Equium R2 = 0.64 in the south was not found in the other group, where there is Equium pollen (North 2). This could be explained by the different behavior of the species on different soils(10). In the case of the relationship between Galactose and Eucalyptus R2 = 0.81, the Eucalyptus species level should be reached to propose its use as a marker of botanical origin. Both of them are introduced species, Echium associated with crops and Eucalyptus in commercial forestry. Indeed, both species could not be associated with a specific region.

4.4 Glyphosate

The presence of glyphosate, even in protected areas, is explained by human activities. Agriculture in the south and west appears to be responsible for the pollution levels. Honey samples with Glycine max, Lotus, Trifolium pratense and Trifolium repens pollen are evidence of this intensive production of forage and crops in the south. Also, the presence of pollen from weeds associated with crops such as Senecio, Cirsium, Echium and Ammi, that are controlled with glyphosate. The levels found in South 2 would be explained by the accumulation of applications during the summer in soybeans, and by the killing of old pastures to implant winter crops. Low levels below the maximum admissible were also detected in the west protected area. Honey samples with Lotus and Trifolium pratense pollen are evidence of this intensive production of forage and crops in the west. There were soybean crops in the western region, the absence of pollen in the samples is due to the harvest date prior to flowering. A later harvest of summer honey could have a higher accumulation of glyphosate. The protected areas, with a limited surface, do not prevent bees from going out of bounds and work in agricultural areas. To avoid this problem, the location of the apiaries inside the protected area is crucial. A right management is necessary in this sense. It is interesting to note that in east and north protected areas, located near fields of pastoral animal production (cattle and sheep) and forest activities, this contaminant was not detected.

5. Conclusions

Different honeys were found in different regions and at different seasons. Values variables are between the ranges reported in the world. However, the high value of conductivity (> 0.8 mS/cm) is not explained by the presence of honey dew. The high mineral content of honeys must continue to be investigated since it can be an element of the soils of Uruguay. Different monofloral honeys of unreported species were found. Calcium could be used as a marker for the east region associated with soil type. In the same way sodium could be a marker for the region of the maritime coast but more honeys should be studied. Mannose was associated with Echium plantagineum in southern samples and could be suggested as a botanic marker in this region. More studies should be carried out to determine the species of eucalyptus that correlates with galactose. Further investigations are necessary in order to relate other sugars in honey with native species. Honey production in protected areas is not enough to ensure the absence of glyphosate.

Supplementary material
Additional information

Author contribution statement: Cracco conceived and designed the collected samples, collected samples, contributed to data or analysis tools, performed the analysis, wrote the article. Cabrera conceived and designed the analysis, performed the mineral analysis. Cadenazzi contributed to analysis tools. Galietta conceived and designed the analysis, performed the sugars, pH and EC analysis and wrote the article. Moreni contributed to data and analysis tools. Santos performed the palynological analysis. Zaccari contributed to data and analysis tools.

Editor: The following editor approved this article. Valentina Mujica (https://orcid.org/0000-0002-9820-2879) Instituto Nacional de Investigación Agropecuaria (INIA), Montevideo, Uruguay.

References
1. Inumet. Clasificación climática [Internet]. Montevideo: Inumet; [cited 2021 Set 25]. Available from: https://bit.ly/3udyyCs.
2. Ministerio de Industria, Energía y Minería (UY). Carta Geológica del Uruguay 1:500.000 [Internet]. Montevideo: MIEM; 2001 [cited 2021 Sep 25]. Available from: https://bit.ly/39D5YkA.
3. Altamirano A. Carta de reconocimientos de suelos del Uruguay: 1:1.000.000 [Internet]. Montevideo: MAP; 1976 [cited 2021 Sep 25]. Available from: https://bit.ly/3AGBcmM.
4. Grela I. Geografía florística de las especies arbóreas del Uruguay: propuesta para la delimitación de dendrofloras [master’s thesis]. Montevideo (UY): Universidad de la República, Facultad de Agronomía; 2004. 97p.
5. Canini A, Pichichero E, Alasian D, Canuti L, Leonardi D. Nutritional and botanical interest of honey collected from protected natural areas. Plant Biosyst. 2009;143(1):62-70.
6. Liberato MC, de Morais SM, de Carvalho CM, Lima I, Bomfim D, de Oliveira M. Physicochemical properties and mineral and protein content of honey samples from Ceará state, Northeastern Brazil Propriedades físico-químicas, minerais e teor de proteínas em amostras de méis do estado do Ceará, nordeste do Brasil. J Food Sci Technol. 2013;33(1):38-46.
7. Sawale PD, Shendurse AM, Mohan MS, Patil GR. Isomaltulose (Palatinose): an emerging carbohydrate. Food Biosci. 2017;18:46-52.
8. Jaafar MHM, Hamid KA, Anuar N, Zohdi M, Effendi TJB. Physicochemical Properties and pharmacokinetic profiles of selected Malaysian honey. In: ISBEIA 2012: IEEE Symposium on Business, Engineering and Industrial Applications [Internet]. Danvers (MA): IEEE; 2012 [cited 2021 Sep 25]. p. 140-5. Available from: https://bit.ly/3AGUuZ7.
9. Taha MME, Abdelwahab SI, Elsanousi R, Babiker SE, Elraih H, Mohamed E, Sheikh BY, Abdulla MA. Effectiveness of Sidr Honey on the prevention of ethanol-induced gatroulcerogenesis: role of antioxidant and antiapoptotic mechanism. Pharmacogn J. 2015;7(3):157-64.
10. Persano Oddo L, Piazza MG, Sabatini AG, Accorti M. Characterization of unifloral honeys. Apidologie. 1995;26:453-65.
11. Karabagias IK, Badeka AV, Kontominas MG, Kontakos S, Karabournioti S. Botanical discrimination of Greek unifloral honeys with physico-chemical and chemometric analyses. Food Chem. 2019;165:181-90.
12. El-Senduny FF, Hegazi NM, Abd Elghani GE, Farag MF. Manuka honey, a unique mono-floral honey: a comprehensive review of its bioactives, metabolism, action mechanisms, and therapeutic merits. Food Biosci [Internet]. 2021 [cited 2021 Sep 25];42:101038. Available from: https://bit.ly/3kFjDxW.
13. Palinić D, Bijeljac S. The content of some chemical elements in floral honeys depending on the region of production. Radovi Poljoprivrednog Fakulteta Univerziteta Sarajevu. 2014;59(64):69-83.
14. Anklam E. A review of the analytical methods to determine the geographical and botanical origin of honey. Food Chem. 1998;63:549-62.
15. Santos-Buelga C, González-Paramás AM. Chemical composition of honey. In: Alvarez-Suarez JM, editor. Bee Products: chemical and biological properties. New York: Springer; 2017. p. 43-82.
16. Di Bella G, Lo Turco V, Potortì AG, Bua G, Fede MR, Dugo G. Geographical discrimination of Italian honey by multi-element analysis with a chemometric approach. J Food Compos Anal. 2015;44:25-35.
17. Corbella E, Cozzolino D. Classification of the floral origin of Uruguayan honeys by chemical and physical characteristics combined with chemometrics. LWT Food Sci Technol. 2006;39(5):534-9.
18. Gámbaro A, Ares G, Giménez A, Pahor S. Preference mapping of color of Uruguayan honeys. J Sens Stud. 2007;22(5):507-19.
19. Santos EI, Meerhoff E, Da Rosa EG, Ferreira J, Raucher M, Quintana W, Mancebo Y. Color and electrical conductivity of honey produced by Apis mellifera in Uruguay. Innotec [Internet]. 2018 [cited 2021 Sep 25];16:51-5. Available from: https://bit.ly/3ud7eV3.
20. Branchiccela B, Zunino P, Antúnez K, Aguirre C, Parra G, Estay P. Genetic changes in Apis mellifera after 40 years of Africanization. Apidologie. 2014;45(6):752-6.
21. Bogdanov S, Ruoff K, Persanno-Oddo L. Physico-chemical methods for the characterisation of unifloral honeys: a review. Apidologie. 2004;35:4-17.
22. Louveaux J, Maurizio A, Vorwohl G. Methods of melissopalynology (republished and updated). Bee World. 1978;59:139-57.
23. Von Der Ohe W, Persano-Oddo L, Piana ML, Morlot M, Martin P. Harmonized methods of melissopalynology. Apidologie. 2004;35(1):18-25.
24. AOAC. Moisture in Honey: Method 969:38. In: Helrich K, editor. Official Method of Analysis. 15th ed. Arlington: AOAC; 1990. p. 189-93.
25. Paul BN, Chanda S, Das S, Singh P, Padey BK, Giri SS. Mineral Assay in Atomic Absorption Spectroscopy. The beats nat sci. 2014;4(1):1-17.
26. RStudio Team. RStudio: Integrated Development for R [Internet]. Boston (MA): RStudio; 2015 [cited 2021 Sep 25]. Available from: https://bit.ly/3zLyICd.
27. Alqarni A, Owayss A, Mahmoud A, Mohammed A, Hannan M. Mineral content and physical properties of local and imported honey in Saudi Arabia. J Saudi Chem Soc. 2014;18:618-25.
28. Lazarević K, Jovetić M, Tešić Ž. Physicochemical parameters as a tool for the assessment of origin of honey. J AOAC Int. 2017;100(4):840-51.
29. Solayman M, Asiful I, Sudip P, Yousuf A, Ibrahim K, Nadia A, Siew HG. Physicochemical properties, minerals, trace elements, and heavy metals in honey of different origins: a comprehensive review. Compr Rev Food Sci Food Saf. 2019;15(1):219-33.
30. FAO; WHO. Standard for honey: CXS 12-19811. In: Codex Alimentarius [Internet]. Rome: FAO; 2019 [cited 2021 Sep 25]. Available from: https://bit.ly/3zAVJba.
31. Daners G, Telleria MC. Native vs introduced bee flora: a palynological survey of honeys from Uruguay. J Apic Res. 1998;37(4):221-9.
32. Fechner DC, Moresi AL, Ruiz Díaz JD, Pellerano RG, Vázquez FA. Multivariate classification of honeys from Corrientes (Argentina), according to geographical origin based on physicochemical properties. Food Biosci. 2014;15:49-54.
33. Biluca FC, Santos de Gois J, Schulz M, Braghini F, Gonzaga LV, Maltez HF, Rodrigues E, Vitali L, Micke GA, Borges DLG, Oliveira Costa AC, Fett R. Phenolic compounds, antioxidant capacity and bioaccessibility of minerals of stingless bee honey (Meliponinae). J Food Compos Anal. 2017;63:89-97.
34. Hernández J. Capacidad de suministro de potasio en suelos del Uruguay [grade’s thesis]. Montevideo (UY): Universidad de la República, Facultad de Agronomía; 1983. 2v.
35. Gaucher C. Grupo Arroyo del Soldado. In: Bossi J. Geología del Uruguay. Montevideo: Polo; 2014. p. 313-39.
36. Bogdanov S. Contaminants of bee products. Apidologie. 2006;37:1-8.
37. Ouchemoukh S, Schweitzer P, Bachir Bey M, Djoudad-Kadji H, Louaileche H. HPLC sugar profiles of Algerian honeys. Food Chem. 2009;121:561-8.
38. Nayik GA, Dar BN, Nanda V. Physico-chemical, rheological and sugar profile of different unifloral honeys from Kashmir valley of India. Arab J Chem. 2019;12(8):3151-62.
39. Pascual-Maté A, Osés SM, Marcazzan GL, Fernández Muiño MA, Gardini S, Sancho MT. Sugar composition and sugar-related parameters of honeys from the northern Iberian Plateau. J Food Compos Anal. 2019;74:34-43.
40. Zielińska S, Wesołowska M, Bilek M, Kaniuczak J, Dżugan M. The saccharide profile of Polish honeys depending on their botanical origin. J microbiol biotechnol food sci. 2014;(3):387-90.
41. Tomás A, Russo-Almeida P, Vilas-Boas M. Avaliação do perfil de açúcares do mel de rosmaninho português. Rev Ciênc Agrár (Lisboa Online) [Internet]. 2017 [cited 2021 Sep 25];40:195-202. Available from: https://bit.ly/3CJRLyT.
Notes
Author notes

pcracco@gmail.com

Table 1
Geographical location of apiaries and names of protected areas (East, North and West) and non-protected area (South) with information about soils and date of harvest, group honey names and number of samples

(*)SNAP: Sistema Nacional de Áreas protegidas. (**) Soil names according United States Department of Agriculture (USDA). (1) Hives lost by Varroa destructor (2) Only a harvest was obtained due to Climatic adverse conditions.
Table 2
Climate data during honey production by region and season

In bold values above the national means

Data from Instituto Uruguayo de Meteorologia (INUMET) (unreferenced)


Figure 1
PCA of 7 groups of Honeys, number samples are: red (east), green (north), blue (south) and black (west)
Table 3
Name and number of taxa, honey dew element presence and percentage of pollen in South 1

Table 4
Name and number of taxa, honey dew element presence and percentage of pollen in East 1

In red bold, monofloral samples (> 45 %)
Table 5
Name and number of taxa, honey dew element presence and percentage of pollen in North 1

monofloral samples (> 45 %)
Table 6
Name and number of taxa, honey dew element presence and percentage of pollen in South 2

In red bold, monofloral samples (> 45 %)
Table 7
Name and number of taxa, honey dew element presence and percentage of pollen in East 2

In red bold, monofloral samples (> 45 %)
Table 8
Name and number of taxa, honey dew element presence and percentage of pollen in North 2

In red bold, monofloral samples (> 45 %)
Table 9
Name and number of taxa, honey dew element presence and percentage of pollen in West

In red bold, monofloral samples (> 45 %)
Table 10
Calcium (Ca), potassium (K), magnesium (Mg), sodium (Na) and totals (Ca+K+Mg+Na) content (mg/kg) from different regions and harvest date

Values are means ± SD; values within a column not sharing a common letter are significantly different (Tukey-Kramer < 0.05).
Table 11
Conductivity (mS/cm), moisture (%) and pH from different regions and harvest date

Values are means ± SD; values within a column not sharing a common letter are significantly different (Tukey-Kramer < 0.05.

Figure 2
Mannose content (%) and average pollen content of Echium plantagineum (%)

Figure 3
Galactose content (%) and average pollen content of Eucalyptus sp. (%)
Table 12
Fructose (F), glucose (G), sucrose (S), galactose (Ga), isomaltulose (I) and mannose (M) content (%) from different regions and harvest date

Values are means ± SD; values within a column not sharing a common letter are significantly different (Tukey-Kramer < 0.05)
Table 13
Values of glyphosate by region, harvest and group

I bold values higher than those established by European standards; n.d. Not detected; * Only 7 hive for sample
Buscar:
Contexto
Descargar
Todas
Imágenes
Non-profit publishing model to preserve the academic and open nature of scientific communication
Mobile reader generated through XML-JATS4R