2021
251
20082020
20122020
 Hayashi, R. rhayashi@fagro.edu.uy
Universidad de la
Republica, Uruguay
Dogliotti, S.
Universidad de la
República, Uruguay
Abstract: In regions with temperate and humid climate such as Uruguay, irrigation stabilizes and increases the yields of summer crops by supplementing rainfall. Irrigation on demand generates higher water consumption, it affects production system sustainability due to inefficient use of resources and it is environmentally negative (excessive fresh water use and energy for its extraction). It is necessary to evaluate deficit irrigation alternatives that increase the productivity of irrigation water. Therefore, three maximum irrigation depths were evaluated: (T2) 3 mm day-1, (T3) 6 mm day-1, (T4) 9 mm day-1, and (T1) control without irrigation (only receives rainfall), on corn production, in order to define more efficient irrigation strategies. Results indicate responses to different levels of deficit irrigation. When rainfall was higher than average, its poor distribution during the crop cycle generated water deficit at specific times, affecting yield. T1 and T2 did not cover etc during the Critical Period and grain filling, which caused lower yields. The yields in T3 and T4 were higher and on the three-year average they were significantly different. T3 did not always cover etc, but the soil reserve and rainfall contributed to cover it, saving almost 20% of irrigation water compared to T4. However, the water productivity indicators (wue, iwue) show that T4 is the best irrigation strategy, although it uses less rainfall and soil water reserve.
Keywords: temperate climate, water use efficiency, deficit irrigation, zea mays.
Resumen: En regiones de clima templado y húmedo como Uruguay el riego estabiliza y aumenta los rendimientos de los cultivos estivales, suplementando las precipitaciones. El riego a demanda tiene mayor consumo de agua, afectando la sostenibilidad del sistema de producción por el uso ineficiente de los recursos, y es ambientalmente negativo (uso excesivo de agua dulce y energía para su extracción). Es necesario evaluar alternativas de riego deficitario que aumenten la productividad del agua riego. Para ello se evaluaron tres láminas máximas de reposición: (T2) 3 mm día-1, (T3) 6 mm día-1, (T4) 9 mm día-1, y (T1) testigo sin riego, (solo agua de lluvia), sobre la producción de maíz, para definir estrategias de riego más eficientes. Los resultados indican que existe respuesta a diferentes niveles de riego deficitario. Cuando las precipitaciones fueron superiores al promedio, su mala distribución durante el ciclo del cultivo generó déficit hídrico en momentos puntuales, afectando el rendimiento. El T1 y T2 no cubrieron la etc durante el Periodo Crítico y llenado de grano, causando menores rendimientos. El T3 y T4 dieron rendimientos mayores y en el promedio de tres años fueron diferentes significativamente. El T3 no siempre cubrió la etc, pero la reserva del suelo y las precipitaciones contribuyeron para cubrirlo, ahorrando casi 20 % de agua de riego respecto a T4. Sin embargo, los indicadores de productividad del agua (eua, euar) muestran que T4 es mejor estrategia de riego, aunque realice menor aprovechamiento de las precipitaciones y del agua del suelo.
Palabras clave: clima templado, eficiencia uso del agua, riego deficitario, zea mays.
Resumo: Em regiões climáticas temperadas e úmidas, como o Uruguai, a irrigação estabiliza e aumenta a produtividade nas culturas de verão, suplementando as chuvas. A irrigação sob demanda gera maior consumo de água, afeta a sustentabilidade dos sistemas de produção devido ao uso ineficiente dos recursos e é ambientalmente negativa (uso excessivo de água doce e energia para sua extração). É necessário avaliar alternativas de irrigação deficitária que aumentem a produtividade da água utilizada na irrigação. Para isso, três lâminas de irrigação máximas foram avaliadas: (T2) 3 mm dia-1, (T3) 6 mm dia-1, (T4) 9 mm dia-1 e (T1) controle sem irrigação, (apenas água da chuva), na produção de milho, para definir estratégias de irrigação mais eficientes. Os resultados indicam que há uma resposta a diferentes níveis de déficit de irrigação. Quando as chuvas eram superiores à média, sua má distribuição durante o ciclo da cultura gerava déficit hídrico em momentos específicos, afetando a produtividade. T1 e T2 não cobriram a ETc durante o período crítico e enchimento de grãos, causando menores rendimentos. T3 e T4 deram rendimentos mais elevados e na média de três anos foram significativamente diferentes. Nem sempre o T3 cobriu a ETc, mas a reserva de solo e a chuva contribuíram para cobri-la, economizando quase 20% da água de irrigação em relação ao T4. No entanto, os indicadores de produtividade da água (EUA, EUAR) mostram que o T4 é a melhor estratégia de irrigação, embora faça menos uso da chuva e da água do solo.
Palavras-chave: clima temperado, eficiência uso de água, irrigação deficitária, zea mays.
Soil and Water
Water productivity in maize, at different levels of deficit irrigation in humid climate
Productividad del agua en maíz, con diferentes niveles de riego deficitario en clima húmedo
Produtividade da água no milho, com diferentes níveis de irrigação deficitária, em clima úmido
Hayashi, R. rhayashi@fagro.edu.uy
Dogliotti, S.
Received: 20 August 2020
Accepted: 20 December 2020
Published: 07 April 2021
Corresponding author: rhayashi@fagro.edu.uy

Different studies estimate a 70% increase in the demand for food in the next 30 years(1)(2)(3). One of the strategies to meet this demand is to increase productivity and yield stability in current agricultural areas, avoiding their expansion(4). Increasing the irrigated area and water use efficiency could increase and stabilize yields in many parts of the world(5).
The complete crop irrigation achieves yields close to the potential, in the absence of limiting factors. However, this practice is questioned due to the volume of water required, the negative effects on the environment(6) and the high irrigation costs. Deficit irrigation arises, worldwide, from the need to save water in the face of current and future scenarios of scarcity and competition for this resource(7), apart from reducing investment and operation costs of irrigation equipment(8)(9). Deficit irrigation improves the sustainability of the production system by increasing the water use efficiency, profiting from rainfall and reducing the water extracted for irrigation, without significantly affecting crop yields and increasing the producer's income(10)(11).
The design of an irrigation equipment starts when defining the daily irrigation depth to replace, determining the pumping flow rate, the hydraulic design and its operation costs(8). It is the main decision of the equipment design that the producer must consider when investing. Irrigation with Central Pivot is one of the most extended in the region and the initial investment and operation costs depend on the maximum depth they apply. Low maximum depths significantly reduce the investment and the operation costs, but they increase the risk of not covering the hydric demand of the crop, especially in the critical period, causing significant yield losses.
In Uruguay, maize (Zea mays L.) is one of the main summer crops due to the export and internal market volumes(12). It presents high potential for biomass production and grain yield, although it is limited by environmental requirements, mainly water availability(1). Uruguay's agroecological conditions, temperate and humid climate, with erratic rainfall throughout the year and soils with low water storage capacity, determine a great breach between rainfed yields compared to those achieved with irrigation(13)(14), with great variability between years. Irrigation must supplement rainfall to regulate yields and reduce the interannual variability, avoiding this deficit.
In this study, three maximum irrigation depths were evaluated on the productive behavior of corn for grain and on the productivity of the applied water. This way of applying irrigation means that at the beginning of the crop cycle all treatments provide the same amount of water, covering the evapotranspiration of the crop (etc). As the crop grows and the demand increases, treatments with lower maximum depth cannot meet the total crop demand any longer. The water deficiencies accumulated in the soil make the treatments differ in the maximum uptake stage of the crop.
This study evaluated the response of maize to rainfed and different irrigation regimes. The specific objectives were to quantify maize yield in response to irrigation and actual evapotranspiration, quantify the effect of limited irrigation on grain yield, biomass production, harvest index, and determine the level of irrigation that results in maximum water productivity for maize in humid climate conditions in southern Uruguay.
The experiments were installed in the experimental field of the Agronomy School, South Regional Center, Canelones, Uruguay (34°37' S and 56°13' W), in 2014-15, 2015-16 and 2016-17 seasons.
According to the Koppen and Geiger classification, the climate is temperate/mesothermic, with no dry season and hot summer (Cfa). Average annual rainfall is 1200 mm with high interannual variability and annual irregularity, determining water deficit events mainly in the summer, in several years. The average summer temperature varies between 18 and 23 °C, while the average radiation varies between 400 and 580 cal cm-2 day-1, with an average humidity of 72%.
Typic Eutric Brunosol Lac. soil is predominant from the Tala Rodríguez Soil Unit, corresponding to Typic Argiudol according to the usda taxonomic classification. Table 1 presents information of its hydric properties.
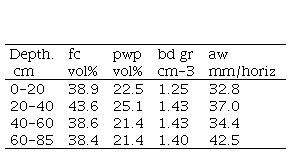
The soil infiltration rate was 8.8 mm h-1, measured with the double ring method with humidity corresponding to the 50% of aw depletion (threshold).
A complete block design with randomized plots was used for the experiment, with 4 treatments and 4 replications. Plots measured 12x6 m, with 12 rows separated by 0.50 m, with no space between plots, to avoid edge effects that could alter the microclimatic conditions within the experiment (oasis effect). The total experimental area was of 1152 m2.
The treatments were: T1: rainfed, only rainfall; T2: maximum depth 3 mm day-1; T3: maximum depth 6 mm day-1, and T4: maximum depth 9 mm day-1; hereinafter, rainfed, 3 mm, 6 mm and 9 mm.
Each treatment indicates the maximum daily irrigation replacement capacity. If the hydric demand of the crop is greater than these depths, irrigation will begin to be deficient, generating different levels of deficit irrigation in different phenological stages of the crop.
A high potential maize hybrid was selected based on the national cultivar evaluation carried out by the National Seed Institute (inase by its Spanish acronym). The sowing dates were November 6, 2014, October 30, 2015 and November 9, 2016. Direct sowing was carried out, with rows 0.50 m apart and approximately 0.15 m between plants, the target population was 100 thousand plants ha-1. Herbicide was applied before and after sowing to avoid weed appearance. To avoid nutritional restrictions, the sowing was fertilized with 78 kg ha-1 of N and 200 kg ha-1 of P2O5, using Diammonium Phosphate (18-46-0) as fertilizer, and V6 was refertilized with 150 kg ha-1 of N using Urea as source.
Drip irrigation was used, with independent management of each treatment (irrigation time) and with pressure limiters to achieve great uniformity. A drip irrigation pipe per row was used, with drippers of 4 l h-1 separated by 1.0 m, in a triangular pattern for better water distribution. The application rate was of 8 mm h-1, according to the soil infiltration rate. The uniformity coefficient (uc) of the equipment(15) was measured and it was higher than 90% in all seasons. Irrigations were carried out two or three times per week, applying the water corresponding to the total needs of the previous days, until the maximum allowed in each treatment.
The wb began with the soil at field capacity (fc), condition obtained by considering precipitations (pp) previous to sowing or with irrigations by portable sprinklers. In addition, this guaranteed the emergence of the crop.
The fao 56(16) methodology was followed, considering the irrigation and the effective precipitation (ppef.) as inputs, and the adjusted etc (etc adj.) as output and considering the storage capacity of available water of the soil. Climatic data were taken from the meteorological station of the inia Las Brujas Experimental Station, located 12 km from the trial. The pp were measured locally with a rain gauge in the trial, placed in compliance with standardization norms.
The etc adj. was calculated daily (equation 1), being the crop coefficients (Kc) those recommended by fao 56(16) since local information is not available.
 [Eq.
1]
[Eq.
1]Where etc adj. is etc adjusted (mm day-1), eto is the evapotranspiration of the reference crop(16) and Ks is the stress coefficient(16)
 [ Eq.
2]
[ Eq.
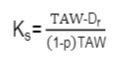
2]Where taw is the Total Available Water in the root zone (mm), Dr is the humidity depletion in the root zone (mm) and “p” is the fraction of the taw that the crop can extract without suffering water stress (threshold).
The Dr is the water deficit generated by the extraction of the crop, equivalent to the accumulated etc adj, not covered by irrigation or pp, when both are scarce. taw is the water that the crop can extract based on the soil, root depth and growth. For the soil of the experimental site and the crop, a depth of 0.60 m was defined.
The p values of fao 56(16) were adjusted by etc, according to the equation, p = ptable + 0.04 x (5 - etc). For corn, p is 0.55, and it was adjusted when etc exceeded 5 mm day-1. The taw adjusted by p determines the Readily Available Water in the root zone (raw), water in the soil that the crop can easily extract without undergoing water stress.
ppef. was estimated by considering the Dr when the pp occurs, and the necessary mm to cover the Dr were effective. The water content between fc and saturation in the first 20 cm of the soil was of 28 mm. When the pp exceeded the water deficit by 28 mm, the top horizon was considered saturated, and 48 to 72 h of natural drainage were allowed so as to of soil moisture return to fc. To corroborate the soil moisture, a field control with a drill was carried out. pp lower than 20% of the eto were discarded(16).
Irrigation needs were estimated by adjusting the value of etc adj. by the uc of the equipment and the Application Efficiency (ae) of the irrigation method, obtaining the total irrigation needs. An ae of 100% was considered due to the fact that reduced depths were managed with an application intensity according to the soil infiltration rate, without losses due to surface runoff or deep percolation, with the applied water retained in the root depth.
Soil moisture was measured two to three times a week during the crop cycle, with neutron probe (cpn 503-dr Hydrprobe), the first two seasons, and capacitance probe (fdr, Delta T Devices, pr2) in the last season. Access tubes for the probes were installed up to one meter deep and were calibrated for each experimental soil horizon.
Crop phenology was carried out based on plant observation, using the scale of Ritchie and Hanway(17).
One of the key stages in the definition of the corn yield is the Critical Period (cp), between 15 days before the beginning of female flowering (R1) and 15 days after it.
In the second and third season of the experiment the evolution of the biomass and the crop growth rate (cgr) were evaluated. Approximately every 30 days, a linear meter of plants was cut from the central part of each plot and dried in a stove at 60 °C until constant weight.
The grain yield was evaluated by manually harvesting three subsamples of 2 m2 each, in the five central rows of each plot. Grain yield, total dry matter and weight of 1000 grains were measured. The harvest index (hi) was estimated as: dry grain weight/total dry matter.
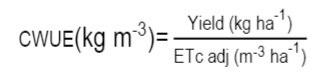
The performance or productivity of a crop is difficult to determine with a single parameter, a combination of indices can inform about more suitable management strategies(18). Consumed water use efficiency (cwue) and irrigation water use efficiency (iwue) are two variables commonly used to evaluate management strategies and are calculated as:
 [ Eq. 3]
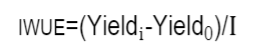
This equation does not consider the role of irrigation. There are other expressions that can discriminate the role of irrigation in the wue(19). Those expressions are the following:
 [Eq.
4]
[Eq.
4]
 [Eq.
5]
[Eq.
5]Where:
cwue: Use efficiency of consumed water the crop related to etc adj. (Kg m-3)
Yieldi: Yield irrigation (Kg ha-1)
Yield0: Yield rainfed (Kg ha-1)
etci: etcadj irrigation (m3)
etc0: etc rainfed (m3)
iwue: Irrigation Water Use efficiency (Kg m-3)
I: Irrigation (mm)
To evaluate the effect of deficit irrigation on yield, a deficit irrigation stress index (disi) was calculated(20).
 [Eq.
6]
[Eq.
6]Data were analyzed using the statistical package Infostat(21). Means were separated using Fisher's test (p≤0.05 between means) to detect differences between treatments for grain yield, biomass and harvest index.
Available data: The entire data set that supports the results of this study was published in the article itself.
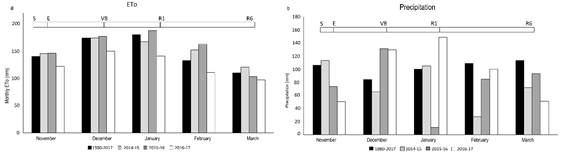
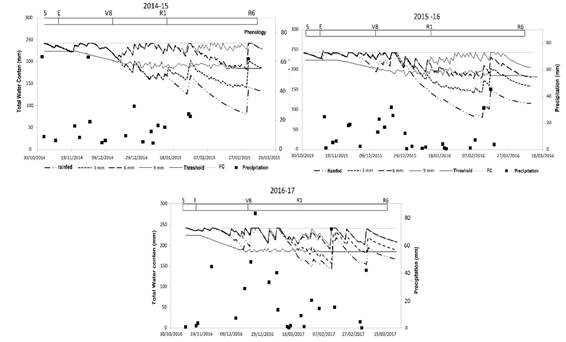
The atmospheric demand in all the cycle was superior to the average in the two first seasons. The biggest difference was in February, coinciding with the grain filling stage. The third season was below the average throughout the cycle and the eto of each month were the lowest in the last 38 years (Figure 1a). The pp accumulated in the cycle were 327, 295 and 483 mm in the 2014-15, 2015-16 and 2016-17 seasons, respectively, with a strong concentration in December and January, in the last season (Figure 1b).
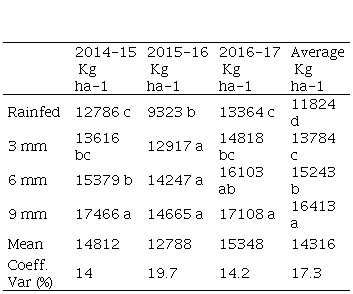
A significant effect of the treatments was observed in the yield (Table 2). Treatments 6 and 9 mm did not show significant differences between them in two of the three years, same as the treatments 3 and 6 mm in the three years of evaluation. However, there was a difference between the most irrigated treatments (6 and 9 mm) and the rainfed in the three years evaluated, and between 3 and 9 mm in two of the years. The joint analysis of the three years of evaluation showed significant differences between all the treatments. If we compare the yield of 6 and 9 mm, the difference was 7%, while this difference was almost 20% when comparing 3 and 9 mm.
The 2015-16 season, with fewer pp in the cp and different stress levels in the treatments, determined by the water content in the soil, presented no significant differences between the yields, as expected.
During the 2015-16 and 2016-17 seasons, biomass production was evaluated. The high variability of data did not allow to differentiate the treatments; however, it is worth highlighting the high yields obtained, around 30 t ha-1 in the irrigated treatments and 18 t ha-1 in the rainfed.
In the last season, pp determined a high biomass production between 26 and 31 t ha-1, in all the treatments, including the rainfed.
A hi of 0.50 in the rainfed treatment did not vary between years. Moreover, the year with more pp (2016-17) presented higher index values in the irrigated treatments, 0.52 for the 3- and 6-mm treatments and 0.56 for the 9-mm treatment.
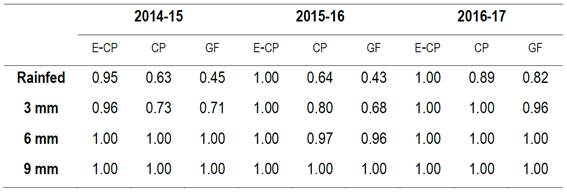
The average Ks from emergence to the beginning of the cp was close to 1 in all treatments and all seasons, indicating that water availability was not limiting in this stage. During the cp and grain filling the Ks was lower than 1 in the rainfed in all seasons, and only in the 2014-15 and 2015-16 seasons in the 3 mm treatment. For the 6- and 9-mm treatments the average Ks was close to 1 in all phenological stages, in the three crop seasons (Table 3).
All the treatments received in the vegetative stage almost the totality of the water needs, and the differences started as of the cp with a low to moderate level (0.5≤ Ks ≤ 0.75) in the rainfed and 3 mm. Later, in grain filling, stress was severe (Ks < 0.5) in rainfed and moderate in 3 mm. The 6 mm and 9 mm treatments were not affected.
The total water consumption of the crop, from irrigation, ppef. and variation in the soil water content, agreed with the etc adj. estimated through the fao 56(16) method, in the three seasons and the four treatments, indicating that the wb with the method applied in this study was adequate for the irrigation management, both in conditions of full irrigation and deficit irrigation (Table 4).
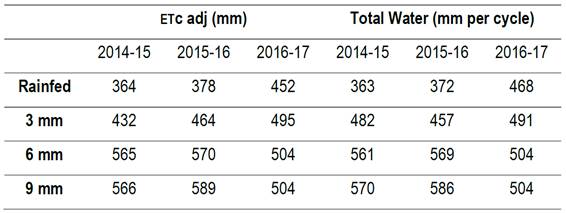
Irrigation for the maximum yields (6 and 9 mm) varied between 173 mm and 422 mm depending on the pp and the etc of the year, corresponding to 36 and 72% of the etc, respectively (Table 5).
The ppef. was higher in rainfed and 3 mm, with a usage between 62 and 83% of the ppt. In 6 and 9 mm, the effectiveness of rainfall was lower, between 43 and 72%. These were less effective in the year with more pp, of 66% on average and the difference between treatments was smaller.
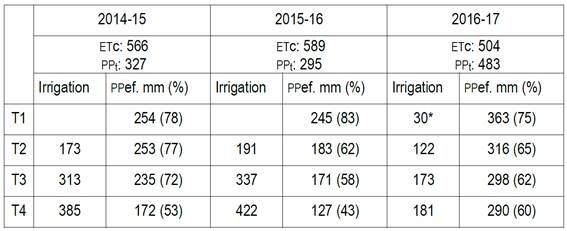
*Irrigation to ensure the crop's implantation
In rainfed and 3 mm, the total water in the root depth decreased below the threshold during the cp, indicating that the maximum daily dose of 3 mm was insufficient to keep the crop in hydric comfort, even in the 2016-17 season with pp above the average.
The evolution of the total water in 6 and 9 mm were similar to each other in the first and last season. Nevertheless, in the second season, there were few pp in January (11 mm total) and the water content in the soil, in 6 mm, dropped to the threshold and remained unchanged for approximately 20 days, coinciding with the cp and the grain filling. However, 9 mm was in hydric comfort throughout the cycle (Figure 2).
In 2014-15 and 2015-16, the rainfed and 3 mm, maintained the soil water content below the threshold during the grain filling stage, until R4-R5. In this moment the pp recharged the soil up to the threshold level in 3 mm, but were not sufficient for the rainfed (Figure 2).
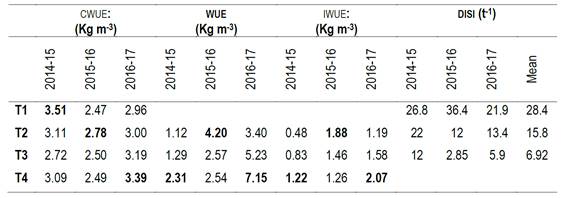
The wue that indicates the productivity of the marginal water with respect to the rainfed was greater in 9 mm, in the years with average pp or more. However, all the indicators were greater in 3 mm in the year with fewer pp, possibly associated to a greater effectiveness of that year's pp (Table 6).
The cwue in 2014-15 was greater in the rainfed, indicating the importance of the pp contribution, that was 78% effective in this treatment. In 2016-17, the pp effectiveness was also high, nevertheless, its distribution was not adequate and water deficit situations occurred during the cp in the rainfed and 3 mm, affecting cwue.
iwue indicates the yield increase over the rainfed by irrigation volume applied. It shows that the 3 mm was more efficient in the use of irrigation in the driest year, whereas in the other years the 9 mm treatment was more efficient.
The disi increased with the stress level, being higher every year in rainfed, followed by 3 mm and 6 mm.
The average eto in January was of 5.4, 6.1 and 4.6 mm day-1 for 2015, 2016 and 2017, respectively, and it was of 5.8 mm day-1 with a maximum of 7.0 mm day-1 for the historical series from 1980 to 2017. Considering the average eto, the etc for the equipment design will be 6.96 mm day-1. If considering a global efficiency of the irrigation method around 85% for irrigation with central pivot(22), the value amounts to 8.19 mm day-1.
The contribution of pp determined an average yield of almost 12 t ha-1 in rainfed, significantly higher than the local commercial yields, that reached the historical record in the 2018-19 harvest of 7.6 t ha-1(12). Maximum yields in 6 and 9 mm agree with those mentioned by several researchers(18)(23)(24)(25), who report yields of 19 t ha-1. At regional level, in competitions of rainfed maize yields, maximums of 17.5 t ha-1(26) were obtained; in addition, Rivetti A.(27) indicates rainfed yields between 10 and 13.4 t ha-1 with average rainfall of 550 mm. The trial yields are consistent with those obtained in regional research, in similar climatic conditions.
The treatments effect was associated to the moment and intensity of the water deficit. The rainfed and 3 mm depended on pp, both in terms of quantity and moment of occurrence. The rainfed treatment significantly differed from the 9 mm in every evaluation year, even in the season with pp of 483 mm during the crop cycle. In this year, the rainfed yielded significantly lower than 9 mm due to pp of great volume and badly distributed in the growth season, generating water stress conditions in the cp and grain filling.
Considering the scenarios elaborated by the Intergovernmental Panel on Climatic Change (ipcc), the main consequences of climatic change in Uruguay will be a greater frequency and intensity of extreme events(28). Some projections indicate that pp will increase in the months of summer-autumn and decrease in winter-spring in the region where Uruguay is located, with an increase in the interannual variability(29). This indicates that the rainfall volumes would be sufficient to cover the water needs of the crops, but its bad distribution will generate occasional deficits in the crop phenological cycle, similarly to the third season of this experiment. These climatic scenarios add complexity to the irrigation management and the decision-making at the time of designing the equipment. The interannual rainfall variability will continue generating yield instability(3) and irrigation is the only tool to stabilize them. Therefore the use of supplementary irrigation is recommendable in crop conditions in humid climates to avoid the significant impact of water stress on yield decrease and to stabilize interannual yields(24)(30).
The average of the three seasons showed significant differences regarding the level of deficit irrigation as the applied water increased. Nevertheless, 6- and 9-mm treatments profited less from the pp (Table 6) and raw, since there were still 20 to 40 mm in the root zone at the end of the crop cycle. In production systems that make a more efficient use of the resources, increasing the water productivity implies profiting more from the pp and the ground water. According to Etter(31), sustainable agriculture is capable of producing by using the minimum inputs, but at the same time guaranteeing long-term stable production levels, having positive socio-economic and biophysical results.
The 6-mm treatment did not have significant differences with 9 mm in the second dry summer season and in the third wet summer season, however, it used the total raw and made better use of the pp, with 20% less irrigation water. Although 3 mm did not differ from 6 mm, in two of three seasons it was statistically different from 9 mm. It stands out that there were no differences between the irrigated treatments in the dry year. The evolution of the total soil water content indicated different stress levels, nevertheless, this was not reflected in the yields, as expected.
In temperate climates(24), it is necessary to irrigate with 100% of the demand to obtain elevated corn yields, nevertheless a 25% deficit would be a good irrigation strategy to increase the water use efficiency when full irrigation is not possible. In the second season of this study, there was a 20% water saving while 6 and 9 mm did not differ in yield. In this same season with 3 mm the saving was of 55%, however, the yield of this treatment was significantly lower than the 9 mm, in two of three seasons.
The 3 mm treatment used the raw of the soil to compensate for the limited irrigation and cover the water needs in early stages, in years with pp close to average. However, this was depleted at the end of the vegetative stage and the 3 mm per day were not enough, the soil moisture level decreased below the threshold (Ks<1) during the cp and grain filling. This determined lower yields in 3 mm compared to 9 mm (20% less). The bibliography cites a higher percentage of yield reduction, according to Comas and others(7), plants that received all or almost all the water during the vegetative period followed by moderate stress in the cp and severe in grain filling have significant yield reduction, higher than the etc saved. Trout(25) reported that corn crops that received between 40 and 55% of their water requirement reduced their yield by around 30%.
The production of aerial biomass was coincident with the obtained by Kresovic and others(24), who obtained yields of 31 t ha-1 with complete irrigation and 20 t ha-1 in rainfed, working in similar climatic conditions.
The harvest index agrees with the obtained by Yazar and others(32), that reported values between 0.51 and 0.57 in different irrigation regimes, but did not affect them significantly. Djaman and others(30) report, in trials in subhumid to semi-arid climates, hi between 0.49 in rainfed to 0.57 in deficit treatment (60% of full irrigation), with a trial average of 0.54, without significant differences between treatments. In addition, they indicate that more than 60% of the total transpiration from irrigation treatments contributes to the production of plant biomass. Along the same line, Trout and others(25) indicate that the hi decreases both due to high deficits or maximum etc. In addition, maximum etc conditions could result in excessive plant growth and reduce hi. The relationship between hi and etc depends on the moment of water stress, which decreases the yield and hi in the cp. The reduction of etc in noncritical periods could increase hi by reducing the plant biomass without equivalently reducing the yield(25)(30).
Regarding the irrigation performance indicators, the wue estimated from the incremental yield by the irrigation aggregate is greater to the range reported by Doorembos and others(33), which was between 0.80 and 1.6 kg m-3. Nevertheless, González and others(34) reported values between 0.86 and 2.9 kg m-3 in Cuba. These last researchers also indicate that the use efficiency of irrigation water, estimated as the crop yield in relation to the irrigation water applied, would not be a good indicator of the efficient use of water, since the pp make an important contribution to the needs of the crop and in some cases, they cover more than 50% of the etc in wet years. They recommend to consider the use efficiency of the total consumed water (cwue) as indicator, that include the effective precipitations.
In this trial, the cwue was higher in the most irrigated treatments in the third season (3.39 kg m-3), while in the second season (dry year) the cwue was higher for 3 mm followed by 6 and 9 mm (2.78, 2.50 and 2.49 kg m-3 respectively). Regarding the first year, the cwue was greater in the rainfed (3.51 kg m-3), followed by 3mm and 9mm (3.11 and 3.09 kg m-3). Bibliography cited similar results, from 2.14 to 3.99 kg m-3(35), from 2.37 to 3.90 kg m-3 under irrigation conditions and from 2.42 to 3.35 kg m-3 in rainfed, in humid climate(24). These last authors indicate greater cwue in full irrigation than in deficit irrigations when the year was drier and conversely in more humid years, similar to this trial's behavior. Other authors indicate lower cwue values, between 1.6 to 2.2 kg m-3 for irrigated crops and 1.2 to 1.4 kg m-3 in rainfed crops in a regional study in Nebraska(36), values of 1.16 to 2.34 kg m-3 being higher in the irrigated treatments(18).
The cwue does not consider the role of irrigation(19), however wue and iwue discriminate the effect of irrigation when considering the yields obtained over the rainfed yield, divided by the difference of net et of the irrigated crop. The iwue results, which ranged from 0.48 to 2.07 kg m-3, were inferior to those of Kresovic and others(24) (1.89 to 3.61 kg m-3) and within the range indicated by Rudnick and others(18), between 0.94 and 4.58 kg m-3, in treatments with 60% of the etc of the well irrigated. Although in the wet year iwue increased with the increase of applied water, in the dry year the behavior was inverse. This indicates that in the dry year there was a smaller percentage increase of the yield with respect to the increase of the irrigation level. Thus, the applied mm of irrigation were less productive as the amount of applied irrigation increased, in that year.
The deficit irrigation stress index (disi) increased with the stress level, the average of the three years indicates greater disi in rainfed that in 3 mm and 6 mm (28.4, 15.8 and 6.92 t-1, respectively), similar to the ones shown by Kresović and others(24), with a 32.3 t-1 average in rainfed conditions, 16.8 and 10.06 t-1 in treatments with 50 and 75% of complete irrigation, respectively. The rainfed had a higher value of this index in the dry year, and lower in the wet year. Nevertheless, 3 and 6 mm had higher indices in the first year, with precipitations close to the average, and lower disi in the dry year and not in the wet year. Kresović and others(24) present the same situation, without detailing the cause of these results, which at first glance are difficult to explain, since a higher index is expected when the deficit is greater, a situation that occurs in rainfed, but not in 3 and 6 mm. The fact that in the dry year there were no significant differences between the irrigated treatments results in lower disi values. Furthermore, in the wettest year the differences in yield were significant and that meant greater differences between the treatments and greater disi values. What is the reason for the lack of response to the irrigated treatments in the dry year, in which a greater differentiation between treatments was expected, but did not occur? Possibly, a greater root exploration of the crop in 3 and 6 mm, added to the precipitations that occurred before the cp which were higher than the historical average (130 and 84 mm respectively), allowing the recharge of the soil beyond of the estimated root depth. These two facts could have allowed the normal development of the crop in its critical stage, or with mild stress levels, where 3 and 6 mm extracted water to greater depth, while the 9 mm used irrigation and raw water with no need to deepen.
The 9 mm treatment achieved higher wue and iwue in two out of three seasons, indicating this is a water-use-efficient alternative. Nevertheless, it did not profit from precipitations as much, which must be considered when managing irrigation in wet climates.
Based on the obtained results, although the average of the evaluated years indicates a better performance of the 9 mm treatment, an economic analysis that allows to define the most profitable option is necessary. The best option for the crop is 9 mm day-1, nevertheless, the investment and operation costs of an irrigation equipment of these characteristics are higher than those of an equipment that applies 6 mm day-1. On the other hand, the 6 mm day-1 treatment is more efficient in profiting from the pp and the water reserve of the soil, as previously mentioned. The 3 mm day-1 treatment would not be recommendable because it puts the crop under water stress from the beginning of the flowering to the grain filling. Although this was not reflected significantly in this trial's yields, numerous research studies show yields decrease when this situation occurs(7)(18)(24)(30).
Given the climatic variability between years, these results should be modeled by using climatic databases that allow to support the decision when defining the design volume of the irrigation equipment. Also, future climatic databases based on climatic change models can be generated and would be very useful for the designer.
An economic analysis that considers the interannual precipitations variability in terms of amount and moment of occurrence, should be carried out in order to identify the most economically convenient treatment.
Results suggest that there is response to different levels of deficit irrigation under Uruguay's climatic conditions. When the average rainfall is higher than the historical average, the poor temporal distribution generates a water deficit at specific times, affecting the yield. The rainfed and 3-mm treatments did not cover the etc during the cp and grain filling in the three evaluated seasons and determined significant differences in the average yield of the three years. The 6- and 9-mm treatments were adequate, with greater yields, and in the average of the three years they were significantly different. In years with more rainfall than average, 9 mm presented higher wue and iwue, indicating that by each mm added, the yield increase was higher compared to the other treatments. However, 6 mm was more efficient in the use of soil water and pp, saving on average 20% of irrigation water. This saving implies fewer pumping hours of a smaller equipment, in terms of power, than the used in the 9-mm treatment.
Author contribution statement: RH: experiment design, writing, analysis of
results, statistical processing, interpretation of results; SD: contribution in
writing and in the interpretation of results.
Editor: The following editor approved this article.
José A. Terra (ORCID: https://orcid.org/0000-0003-0713-9788) Instituto Nacional de Investigación
Agropecuaria (INIA), Treinta y Tres, Uruguay.
http://agrocienciauruguay.uy/ojs/index.php/agrociencia/article/view/390/707 (pdf)
The study was funded by the FSA_1_2013_1_12590 project of anii (National Agency for Research and Innovation).
rhayashi@fagro.edu.uy
*Irrigation to ensure the crop's implantation