Abstract:
The objective of this study was to
analyze the effect of the quantity and quality of the feed offered on the
performance of male beef cattle, >6 months old, on intensive grazing systems
in Uruguay. Two hundred and fifty-four results from different experimental
trials (nexp=68) performed between 1991
and 2020 by different research institutions in Uruguay were compiled and
analyzed. The experiments included feeding studies with cultivated pastures as
a single nutritional source (nexp=61), as
well as supplementation studies on the same type of pastures (nexp=49). Simple, quadratic, multiple linear
regressions and recursive partitions were performed to synthesize the
information. Quadratic relationships between forage allowance (fa) and average daily gain (adg) were
observed for the different animal categories and seasons of the year. Including
other parameters such as initial body weight and supplementation with energy
concentrates or silages allowed to predict the adg of animals under a wide
range of feeding alternatives. Briefly, low fa
levels (≤1.75 %bw)
limit animal performance to maintenance gain conditions (0.2 kg/day). To
achieve adequate levels of adg
(0.6-0.7 kg/day), with a low to moderate fa
(between 1.75 to 3.5 %bw),
the nutritional value of pasture needs to reach at least level 3 of quality
(>58 %odm,
>13 %cp, <50 %ndf, >21
%Leg and <19 %dr).
These daily gains can be exceeded if the fa
is >3.5 %bw
(adg in
the range of 0.7 to 1.0 kg/day). The increased response in additional adg (0.4-0.5
kg/day) by the effect of supplementation with energy concentrate was achieved
with low fa levels (≤2.25 %bw). The
prediction of additional adg
using a multiple linear regression parameter allows evaluating whether
supplementation is appropriate.
Keywords: review, rearing, fattening, supplementation, cultivated pasture.
Resumen:
El objetivo del presente trabajo fue analizar el efecto de la cantidad y la calidad de alimento ofrecido sobre el desempeño de bovinos para carne machos, de más de 6 meses de vida, en sistemas pastoriles intensivos de Uruguay. Se compilaron y analizaron 254 resultados de diferentes trabajos experimentales (nexp=68) realizados por distintas instituciones de investigación de Uruguay entre los años 1991 y 2020. Los estudios incluyen trabajos de alimentación con pasturas cultivadas como única fuente nutricional (nexp=61), así como trabajos de suplementación sobre ese mismo tipo de pasturas (nexp=49). Se realizaron regresiones lineales simples, cuadráticas, lineales múltiples y particiones recursivas de modo de sintetizar la información. Se observaron relaciones cuadráticas entre la asignación de forraje (af) y la ganancia media diaria (gmd) para las diferentes categorías y estaciones del año. La inclusión de otros parámetros como peso vivo inicial y suplementación con concentrados energéticos o ensilajes permitió predecir la gmd de los animales bajo un amplio rango de alternativas de alimentación. Brevemente, niveles bajos de af (≤1,75 %pv) limitan el desempeño animal a condiciones de mantenimiento (0,2 kg/día). Para lograr niveles de gmd adecuados (0,6-0,7 kg/día), con af bajas a moderadas (entre 1,75 a 3,5 %pv), se necesita que el valor nutritivo de la pastura alcance al menos el nivel 3 de calidad (>58 %dmo, >13 %pc, <50 %fdn, >21 %Leg y <19 %rs). Esas ganancias pueden superarse si la af es >3,5 %pv (gmd en el rango de 0,7 a 1,0 kg/día). La mayor respuesta en gmd adicional (0,4-0,5 kg/día) por efecto de la suplementación con concentrados energéticos se logra con niveles de af bajos (≤2,25 %pv). La predicción de gmd adicional utilizando los parámetros de la regresión lineal múltiple permite evaluar la conveniencia de la suplementación.
Palabras clave: revisión, recría, engorde, suplementación, pasturas cultivadas.
Resumo:
O objetivo do presente trabalho foi analisar o efeito da quantidade e qualidade do alimento oferecido sobre o crescimento de bovinos de corte, machos e de mais de 6 meses de idade em sistemas pastoris intensivos do Uruguai. Foram analisados 254 resultados de vários trabalhos experimentais (nexp=68) desenvolvidos por diferentes instituições de pesquisa de Uruguai no período compreendido entre os anos 1991 e 2020. Os estudos incluem trabalhos de alimentação com pastagens cultivadas como única fonte nutricional (nexp=61) e trabalhos de suplementação sobre o mesmo tipo de pastagens (nexp=49). Para compendiar a informação foram implementadas regressões lineais simples, quadráticas, lineais múltiplas e partições recursivas. Foi observada uma relação quadrática entre a forragem oferecida (FO) e o ganho médio diário (GMD) para diferentes categorias e estacoes do ano. A inclusão de outros parâmetros como peso vivo inicial e suplementação com concentrados energéticos ou silagem permitem predizer a GMD dos animais num amplo intervalo de opções de alimentação. Baixos níveis de FO (≤1,75 %PV) limitam o desempenho animal em situação de mantença (0,2 kg/dia). Para lograr níveis de GMD adequados (0,6-0,7 kg/dia), com FO baixas a moderadas (1,75 a 3,5 %PV), e necessário que o valor nutricional da pastagem alcance pelo menos o nível 3 de qualidade (>58 %DMO, >13 %PB, <50 %FDN, >21 % Leg e <19 %RS). Esses GMD podem ser superados se FO e >3,5 %PV (GMD no intervalo de 0,7 a 1,0 kg/dia). A maior resposta no GMD adicional (0,4-0,5 kg/dia) por efeito da suplementação com concentrados energéticos é obtida com níveis de FO baixos (≤2,25 %PV). A previsão de GMD adicional usando os parâmetros de regressão linear múltipla permite avaliar a adequação da suplementação.
Palavras-chave: revisão, crescimento, terminação, suplementação, pastagens cultivadas.
Carátula del artículo
Animal production and pastures
Estimated beef cattle performance under intensive grazing systems in Uruguay
Estimación del desempeño de bovinos
para carne en sistemas pastoriles intensivos de Uruguay
Estimativa
do desempenho de bovinos de corte em sistemas pastoris intensivos do Uruguai
 Clariget
,
J. M. jclariget@inia.org.uy
Instituto Nacional de
Investigación Agropecuaria (INIA), Uruguay
Lema,
O. M.
Instituto Nacional de
Investigación Agropecuaria (INIA), Uruguay
La Manna,
A.
Instituto Nacional de
Investigación Agropecuaria (INIA), Uruguay
E. Perez
Instituto Nacional de
Investigación Agropecuaria (INIA), Uruguay
Banchero,
G.
Instituto Nacional de
Investigación Agropecuaria (INIA), Uruguay
Fernández,
E.
Instituto Nacional de
Investigación Agropecuaria (INIA), Uruguay
Agrociencia Uruguay
Universidad de la República, Uruguay
ISSN-e: 2730-5066
Periodicity: Bianual
vol. 25, no. 1, e107, 2021
Received: 24 July 2019
Accepted: 25 February 2021
Published: 23 April 2021
Corresponding author: jclariget@inia.org.uy
1. Introduction
In Uruguay, 89% of cattle fattening is carried out on grazing systems(1), with cultivated pastures being of utmost importance in their feeding. An estimate of 30% of these animals are directly fattened with cultivated pastures(2), and 50% had access to improved pastures at some stage of their life (rearing and/or fattening) so as to have the age and weight demanded by the meat processing industry at slaughter(3). These rearing and/or fattening systems on cultivated pastures are identified as intensive livestock systems and are characterized by being productive systems where high animal stocking rates are managed (generally: 1.0-1.6 lu/ha(4)) with a rearing and fattening period of no more than two years(5). In these systems, the type of grazing acquires particular relevance, especially rotational grazing, since it is more productive than continuous grazing only under high stocking rate conditions(6)(7). The concept of forage allowance (fa), defined as the daily amount of dry matter (kg dm) of offered forage per 100 kg of animal body weight (bw), then acquires more relevance than animal stocking rates. Fractioning forage through the use of daily belts allows managing the forage resource better (greater control of the fa), to regulate the nutritional value of pastures more efficiently, and to balance the diet, as it has greater control of animal intake(6). To estimate the belt size, the dm availability, the fa, and the number of animals(8) should be considered. The number of days that animals will remain in each belt for longer occupations should also be taken into account.
On the other hand, in our country, pasture supplementation has increased as a result of the growth of the agricultural area with greater availability of grains and by-products. Supplementation with hay, silage or grain improves the nutritional condition of the animal(9), which may result in better finishing and carcass and meat quality(10). However, the most important role of supplementation in intensive systems is the increase in animal stocking rate and consequently the overall productivity of the farm. This is due to more rational use of pasture, as well as better use of crops and harvest residues within the system(11).
There are reviews at international level on how the forage offered, and the type and level of supplementation affect animal performance, as well as programs that allow predicting the average daily gain (adg). Nevertheless, these present limitations, since they: 1) do not predict the animal response for a range of feed supply(12)(13)(14); 2) evaluate fa in terms of kg dm of forage/kg of animal bw(15)(16) without considering the time factor (commonly used in continuous grazing); 3) only evaluate the effect of the level and type of supplementation on incremental adg(9)(17); 4) only predict animal performance for tropical pastures(18), or 5) estimate adg, but the user must establish the dm intake(19).
For these reasons, and as a way of generating national coefficients for Uruguayan technicians and farmers, this study aimed to analyze the effect of the quantity and quality of feed offered on the performance of male beef cattle over 6 months old, in intensive grazing systems in Uruguay. These arise from a bibliographic review and an analysis of experimental work carried out in Uruguay which studied how the quantity and quality of the offered feed affect animal performance.
2. Materials and methods
For this research, 68 experimental studies (nexp) on feeding with cultivated pastures (prairie or winter forage crops) as the only nutritional source were used and synthesized, as well as supplementation studies on the same type of pastures, carried out and published by the Agronomy College (Udelar) and inia in Uruguay between 1991 and 2020. Only the tests carried out with meat-breed castrated males over 6 months of age were included.
Trials that presented results of animal performance under different levels of forage allowance and in different seasons of the year were identified among the experimental studies. These (n=125, nexp=61) were analyzed by simple and quadratic linear regressions using the statistical package sas. The seasons of the year were defined as: summer (December, January and February), autumn (March, April and May), winter (June, July and August) and spring (September, October and November).
The correlation was estimated between fa and adg of animal weight in the different seasons of the year for each category (calves and steers). Subsequently, a multiple linear regression analysis was performed using the stepwise sas function where parameters were included to estimate the adg of beef cattle. The parameters were: fa (% bw), category (calves and steers), initial bw (kg), season of the year (summer, autumn, winter and spring), type of supplement (hay, silage and energy concentrates), and type of cultivated pasture (prairie and winter forage crops). A significance ≤0.15 was considered to include the parameters in the model. In total, 254 results were used (nexp=68).
Subsequently, a multivariate analysis was performed with the statistical package InfoStat using the recursive partition methodology, including fa and an index of the nutritional quality of pastures (1=lowest nutritional value, 5=highest nutritional value; table 1). It was estimated based on real laboratory values (organic matter digestibility (omd), crude protein content (cp) and percentage of neutral detergent fiber (ndf)), and when it was not reported it was estimated based on pasture characteristics (percentage of legumes and dry remains), used in the different trials (n=125, nexp=68).
Table 1
Index of pasture nutritional value estimated based
on the main parameters of its chemical composition or by visual appreciation of
pasture characteristics
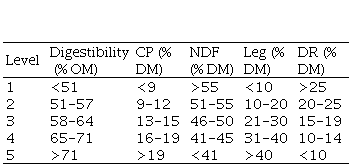 OM = organic matter; CP= crude protein; DM = dry matter; NDF =
neutral detergent fiber; Leg = legumes; DR = dry remains
OM = organic matter; CP= crude protein; DM = dry matter; NDF =
neutral detergent fiber; Leg = legumes; DR = dry remains
The methodology used allowed to group and characterize the animal response (adg) based on the aforementioned criteria (fa and pasture nutritional value). This methodology is used in human medicine(20)(21)(22) and allows building decision trees that model the influence of a set of explanatory variables on the target variable. Minimum data size of 25% (n=31) was considered to continue partitioning each node. The main results are presented grouped into nodes sharing similar values for some of the evaluated characteristics.
The experimental results of supplementation with energy concentrates carried out in all seasons of the year (n=90, nexp=35) were also analyzed by a multivariate analysis using the recursive partition methodology to evaluate how the fa and the level of supplementation affect the “additional” adg (adga). The adga was calculated as the difference of adg between the supplemented group and the control group (without supplementation).
Additionally, the studies that evaluated the use of forage (percentage of disappeared forage in relation to offered forage) under different levels of fa (n=71, nexp=28) were identified and analyzed using simple and quadratic linear regressions, as well as the level of forage dry matter intake (fdmi) estimated as a percentage of bw (n = 50, nexp = 18). Also, the experimental studies that presented results of supplementation with energy concentrates on cultivated pastures were identified (n=90, nexp=35). For this case, adga was used as a result of supplementation with energy concentrates.
Finally, for the variables fdmi and adga, multiline linear regressions were performed using the stepwise function of sas, considering the following parameters: fa (% bw), animal category (calves or steers), initial bw (kg), season of the year (summer, autumn, winter or spring), and type of pasture (winter forage crop or prairie), and the level of supplementation (% bw) was considered for adga. A significance ≤0.15 was considered to include the parameters in the model.
3. Results and discussion
3.1
Estimation of adg
during rearing and fattening on cultivated pastures without supplementation
(Model 1 - Simple and quadratic linear regressions)
Table 2 shows the simple and quadratic linear
regression parameters by season of the year to estimate the adg of calves and steers. It is
observed that the estimated adg has a better fit (higher R2) in
quadratic regressions than in simple linear regressions.
Table 2
Simple and
quadratic linear regression parameters by season of the year and animal
category to estimate adg of beef
cattle
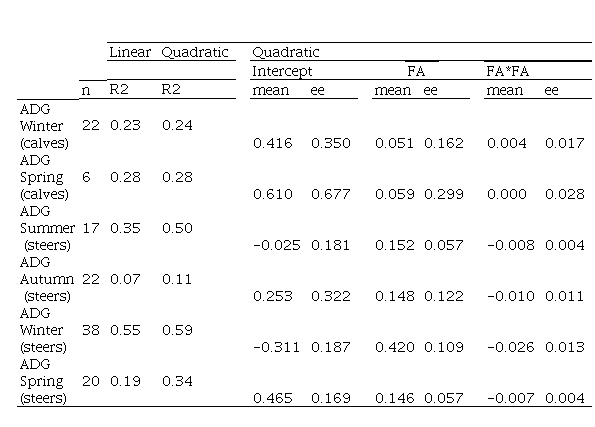 ADG: average daily gain (kg/day) // FA: forage allowance (kg DM/100kg body weight/day)
Figure 1 shows the synthesis of the 61 local
studies (n=125) using the parameters described in Table 2, where it can be
observed that as the forage allowance in cultivate pastures increases, the adg of animal
increases but with decreasing rates. In turn, it can be observed that the adg potential
for steers at the same fa level
is greater for winter and spring than for summer and autumn. In this way, what Carámbula(23) mentions regarding the influence
of the advanced phenological state of the pastures in summer (reproductive
state) on their quality becomes evident; as well as the reported by Rearte and Pieroni(24)
regarding the great proportion of water, low effective fiber level and high
soluble proteins/soluble carbohydrates rate in pastures in autumn, determining
that the achievable potential based only on cultivated pastures is lower in
summer and autumn than in winter or spring. Additionally, during the summer,
caloric stress can be another factor that determines the lower productive
performance due to a lower dmi(25)(26)
and/or a greater maintenance effort to dissipate heat(27)(28).
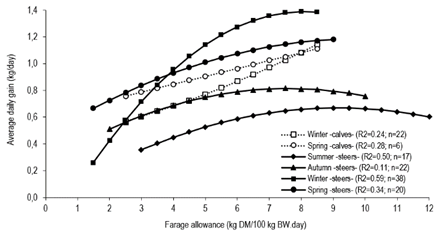 Figure 1
Average daily gain
of calves and steers by season of the year according to level of forage
allowance
Figure 1
Average daily gain
of calves and steers by season of the year according to level of forage
allowance
On
the other hand, in winter and spring, the adg potential is greater for
steers than for calves. This has been published widely by international literature(29)(30)(31)(32) and is due
to a greater ruminal digestibility(33), among other things, as a
compensatory effect of steers due to some previous restriction(34).
3.2
adg
estimation during rearing and fattening on cultivated pastures with and without
supplementation (Model 2 - Multiple linear regressions)
The parameters included in the model of multiple
linear regression are shown in table 3. The parameters that affect the
estimation of adg
the most are supplementation with energy concentrates, fa, and summer (greater R2). Including other
parameters such as spring and winter, initial body weight and supplementation
with silages allow improving the fit in the estimation of adg. The inclusion of the type
of pastures (winter forage crops or prairie) or supplementation with hay were
not significant (P-value>0.15) for the developed model.
Table 3
Multiple linear regression parameters to estimate adg (kg/day)
of beef cattle
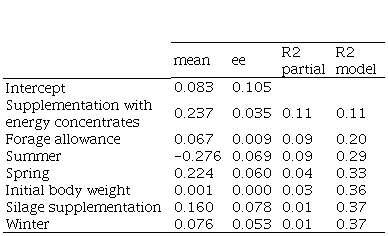 ADG: average daily gain (kg/day) // Supplementation
with energy concentrates: 0 (no), 1 (yes) // Forage allowance (kg DM/100kg body
weight/day): 1 to 12% BW // Summer: 0 (no), 1 (yes) // Spring: 0 (no), 1 (yes)
// Initial body weight (kg): 130 to 390 kg BW // Silage supplementation: 0 (no),
1 (yes) // Winter: 0 (no), 1 (yes)
ADG: average daily gain (kg/day) // Supplementation
with energy concentrates: 0 (no), 1 (yes) // Forage allowance (kg DM/100kg body
weight/day): 1 to 12% BW // Summer: 0 (no), 1 (yes) // Spring: 0 (no), 1 (yes)
// Initial body weight (kg): 130 to 390 kg BW // Silage supplementation: 0 (no),
1 (yes) // Winter: 0 (no), 1 (yes)
To ratify the use of this model, the results
obtained experimentally were compared to the prediction of the model from three
studies chosen at random:
1) Risso and others(35), working in winter with steers of 260 kg of bw, supplemented ad libitum with silage from prairie or crops and managed at a fa of 1% bw, reported adg of 0.72a and 0.64a, respectively, while the model estimated an adg of 0.67 kg/day.
2) Beretta and others(36), working in winter with steers of 360 kg bw, managed with a fa of 5 % bw and supplemented at 1% of bw with ground sorghum grain, reported an adg of 1.47 kg/day, while the model estimated an adg of 1.13 kg/day.
3) Beretta and others(37), working in summer with steers of 280 kg bw, managed with a fa of 6% bw reported an adg of 0.48 kg/day, while the model estimated an adg of 0.52 kg/day.
Based on these examples, the model will allow technicians and farmers to predict the expected adg considering the abovementioned parameters (fa, season of the year, initial body weight and supplementation with energy concentrates or silages). In this way, they can model feeding alternatives for animals and evaluate the most suitable for their livestock production system.
3.3 adg estimation
during rearing and fattening on cultivated pastures with and without
supplementation with energy concentrates (Model 3 – Classification and
regression trees)
The multivariate analysis allowed to generate six
nodes or terminal associated groups of adg based on the fa and the nutritional value of pasture
(Figure 2). As can be observed, low levels of fa
(≤1.75% bw)
limit animal performance (0.2 kg/day; Node 1). To achieve adequate levels of adg of weight
(0.6-0.7 kg/day), working with low to moderate fa (between 1.75 and 3.5% bw), it is necessary for the
nutritional value of pasture to reach at least level 3 (>58% of omd, >13%
of cp, <50% of ndf, >21%
Leg, and <19% of dr;
Node 3). With moderate to high levels of fa
(>3.5% bw)
weight gains in the range of 0.7 to 1.0 kg/day can be obtained (Nodes 4, 5 and
6). Under moderate to high fa
conditions, the nutritional level of forage has a lower impact on adg, possibly
associated with the increased selection capacity of animals in those grazing conditions(38)(39).
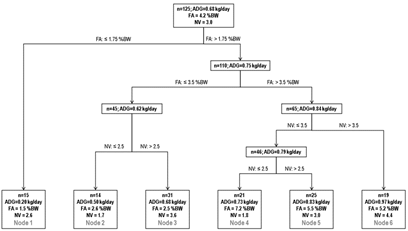 Figure 2
Results of recursive partition
analysis applied to adg
of beef cattle on cultivated pastures
Figure 2
Results of recursive partition
analysis applied to adg
of beef cattle on cultivated pastures
n = number of observations; ADG = average daily gain (kg/day);
FA = forage allowance (kg of DM/100kg body weight/day); BW = body weight; NV =
nutritional value (scale 1 – 5; described in Table 1).
The adga of energy concentrate supplementation generated
five terminal nodes, as shown in Figure 3. The highest response in adga (0.4-0.5
kg/day; Node 1) was at low fa
levels (≤2.25% bw),
emphasizing what was reported by Moore and others(9),
who found that when the fdmi
is lower than 1.75% bw, the supplement has an additive
effect. As fa increases
(>2.25% bw),
the adga
decreases (Nodes 3, 4 and 5), highlighting that at higher fa levels the substitute effect of the
supplement is greater(9)(40).
Under similar fa conditions, the adga due to
supplementation increased (0.2 vs. 0.4 kg/day; Node 2 vs. Node 3), with higher
levels (0.6 vs. 1.0% bw).
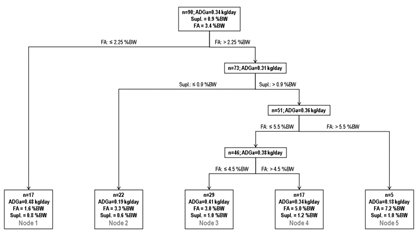 Figure 3
Results of recursive partition
analysis applied to “additional” adg of beef cattle
Figure 3
Results of recursive partition
analysis applied to “additional” adg of beef cattle
n = number of observations; ADGa =
“additional” average daily gain (kg/day); BW = body weight; FA = forage
allowance (kg of DM/100kg body weight/day); Suppl. = supplementation.
Figure
4 combined the two recursive partitions previously discussed (Figure 2 and 3).
The analysis of adg
based on different forage allowances and nutritional values of pastures is
shown at the top. The analysis of adga due to supplementation based on different forage
allowances and energy concentrates offers is presented at the bottom of the
figure. The association of both partitions will allow technicians and farmers
to predict the expected adg
based on pasture characteristics (quantity and quality) and supplementation
level. As an example, we can see that it is possible to achieve adg in
animals of around 0.7 kg/day by working with low fa values (1.5-1.6% bw), average nutritional values
of forage (2.6; scale 1 to 5), and supplementing with levels of 0.8% bw. However, adg of around
1.2 kg/day can be achieved if we give the steers greater fa (5.0-5.5% bw) with similar nutritional
values (3.0; scale 1 to 5) and higher levels of supplementation (1.2% bw).
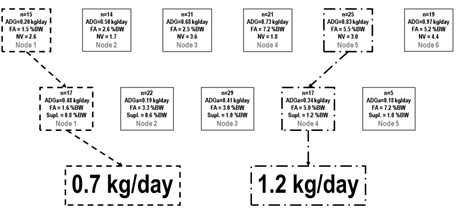 Figure 4
Estimation of animal performance by
combining the two recursive partitions in Figures 2 and 3
Figure 4
Estimation of animal performance by
combining the two recursive partitions in Figures 2 and 3
n = number of observations; ADG =
average daily gain (kg/day); ADGa = “additional”
average daily gain (kg/day); FA = forage allowance (kg of DM/100kg body
weight/day); BW = body weight; NV = nutritional value (scale 1 – 5; described
in Table 1); Suppl. = supplementation.
3.4 Estimation of the use and intake of forage dry
matter (Model 4 – Simple, quadratic and multiple linear regressions)
Table 4 and Figure 5 summarize the local studies
where the allowance, the forage utilization (n=71, nexp=28)
and the fdmi
estimate (n=50, nexp=18) were recorded. It
is observed that forage use has a better fit (greater R2) in
quadratic regression, while fdmi has a moderate fit (R2 = 0.39) and not
different than the model used. As the fa
increases, pasture utilization decreases, reaching values below 40% with fa levels greater than 6.5% of bw. On the
other hand, when the fa is lower
than 4% of bw,
forage use exceeds 60%, being able to reach values of 85% with very low fa (1.5% bw). As for the fdmi
estimate, it can be seen that to reach levels above 2% of bw it is necessary to work with fa above 3.5% bw, while it is necessary to
work with fa over 6% bw to reach
levels greater than 2.5% of bw.
Table 4
Simple and
quadratic linear regression parameters for forage utilization and fdmi
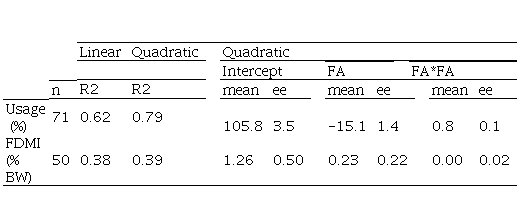 FDMI: forage dry matter intake (kg DM/100 kg body weight/day) // BW: body weight (kg) // FA: forage allowance (kg of DM/100kg body weight/day)
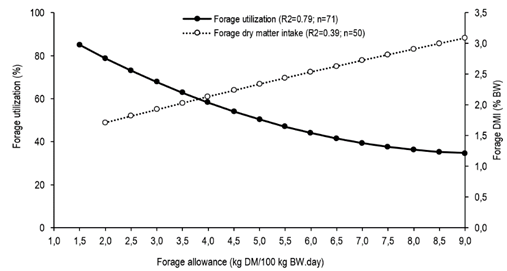 Figure 5
Utilization and
estimation of forage intake of beef cattle according to forage allowance level
Figure 5
Utilization and
estimation of forage intake of beef cattle according to forage allowance level
The multiple linear regression using the function
stepwise of sas
allowed to improve (R2 = 0.66) the estimation of fdmi in relation to the simple
linear and quadratic regression (Table 5). It is observed that fa is the most related parameter to fdmi (greater
R2), but the inclusion of the season, initial body weight and type
of cultivated pasture allows to improve this estimation. The lower fdmi at the
same level of fa during autumn
and winter could be due to the low content of dm
in forage(41). Concentrations of
dm below 24% have been reported
to increase the number of bites(42).
Concentrations below 22% of dm decrease
the intake rate (grams of dm/min)(43), while concentrations below
18-20% of dm limit animal intake
(kg dm/day)(44)(45).
Table 5
Parameters of multiple linear
regression to estimate dry matter intake (% bw) of forage
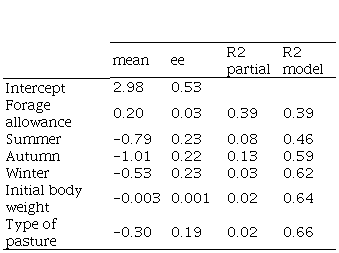 Forage allowance (kg of DM/100kg body weight/day): 2 to 9 %
BW// Summer: 0 (no), 1 (yes) // Autumn: 0 (no), 1 (yes) // Winter: 0 (no), 1
(yes) // Initial body weight (kg): 150 to 390 kg BW // Type of pasture: 0
(winter forage crop), 1 (prairie)
Forage allowance (kg of DM/100kg body weight/day): 2 to 9 %
BW// Summer: 0 (no), 1 (yes) // Autumn: 0 (no), 1 (yes) // Winter: 0 (no), 1
(yes) // Initial body weight (kg): 150 to 390 kg BW // Type of pasture: 0
(winter forage crop), 1 (prairie)
The
lower fdmi
during the summer may be due to the lower nutritional value of forage. During
the summer, the cultivated pastures present the highest values of ndf(23)(46), which is inversely related
to the capacity of fdmi(47).
Similarly, the lower fdmi
when using prairie relative to winter forage crops can be attributed to the
higher values of ndf
of the first(46). In fact, Mertens(47) reports that values
greater than 40% ndf
in the diet begin to lower the fdmi. Finally, the lowest fdmi in relative terms (% bw) to
greater animal bw
has been reported in the literature(32)(48),
where it obeys a smaller relative size of the gastrointestinal tract compared
to the rest of the body(49).
3.5 Estimation of the additional adg by the
effect of supplementation with energy concentrates (Model 5 – Simple, quadratic
and multiple linear regressions)
The
fittings for simple linear and quadratic regressions to determine the adga were low
(R2=0.10 and R2=0.11, respectively). Using the multiple
linear regression allowed improving this fit (R2=0.34) when animals
were supplemented with energy concentrates. Table 6 shows that for each
increase in the level of supplementation (% bw) the generated adga is 0.224
kg/day. In turn, for each increase in fa
(% bw)
the adga
is lower (0.060 kg/day). This is due to a higher replacement rate of
forage with concentrates(50).
Finally, at the same level of supplementation and fa (in relative terms —%bw—), 0.13 kg/day of additional adg are
obtained for every 100 kg of bw.
Table 6
Parameters of multiple linear regression to estimate
additional adg
(kg/day) by supplementation with energy concentrates
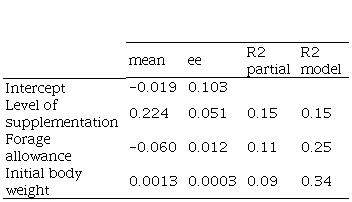 Additional ADG: additional average daily gain (kg/day) // Supplementation level: 0.5 to 2% BW// Forage allowance (DM/100kg body weight.day): 1.5 to 9% BW// Initial body weight (kg): 130 to 390 kg BW
The
multiple linear regression model allows us to predict the adga considering the
abovementioned parameters. It is possible to evaluate whether or not
supplementation is appropriate with this estimate and knowing the price of the
concentrate and the produced animal bw. As an example, calves of 160 kg of bw, in
winter, managed with a fa of 2.5%
bw and
supplemented with energy concentrates at 1% of bw would achieve an agda of 0.26
kg/day. This value is similar (0.25 kg/day) to that reported by Simeone and Beretta(51) under these management and
feeding conditions. With this value, assuming a price of usd 1.8 per kg of bw produced,
a daily intake of 2 kg of supplement (fresh base) at a price of usd 190 a
ton, supplementation would be convenient since the result is positive (usd 0.092/calf.day = 0.26 kg /day * usd 1.8/kg of bw produced –
2.0 kg supplement * usd
0.190/kg supplement). In 100 days of supplementation, a feeding margin of usd 9.2/calf
would be achieved.
4.
Considerations
In the studies evaluated in this research, the relationship that exists between fa and adg for the different categories and seasons of the year is, in general, quadratic, whereas the fa increases in cultivated pastures, the adg of beef cattle increases, but with decreasing rates. The inclusion of additional parameters such as initial body weight and supplementation with energy concentrates or silages at fa and season of the year allows predicting the expected adg of the animals under a wide range of feeding alternatives, evaluating the most convenient for the production system.
Considering parameters such as fa, season of the year, initial body weight and type of cultivated pasture allows estimating the fdmi with greater precision, a key variable to determine the production efficiency (fdmi/adg) in grazing systems. Finally, the prediction of the adga using the parameters of the multiple linear regression allows evaluating the convenience of supplementation, considering the price of the concentrate and the produced bw.
Additional information
Author contribution statement: JM Clariget:
Conceived and designed the analysis, collected the data, performed the
analysis, and wrote the paper.
OM Lema:
Contributed to data or analysis tools, and performed the analysis.
A La Manna: Conceived and designed
the analysis, and contributed to data or analysis tools.
E Perez: Collected the data.
G Banchero:
Conceived and designed the analysis, contributed to data or analysis tools, and
wrote the paper.
E Fernández: Contributed to data or
analysis tools, and wrote the paper.
Editors: The
following editors approved this article.
Gabriel
Ciappesoni (https://orcid.org/0000-0002-0091-3956)
Instituto
Nacional de Investigación Agropecuaria (INIA), Montevideo, Uruguay. // Mariana
Carriquiry (https://orcid.org/0000-0002-1600-2591)
Universidad de la República, Facultad
de Agronomía, Montevideo, Uruguay
References:
1. Bervejillo J. Comportamiento del sector carne vacuna. In: Anuario OPYPA. Montevideo: MGAP; 2018. p. 43-67.
2. Becoña G, Oyhantcabal W. Primer estudio de la huella de carbono de tres cadenas agroexportadoras del Uruguay: carne vacuna, lácteos, arroz. Montevideo: MGAP; 2013. 61p.
3. Ministerio de Ganadería, Agricultura y Pesca, DIEA (UY). Producción animal: ganadería vacuna y lanar. In: Anuario Estadístico Agropecuario. Montevideo: MGAP; 2018. p. 42-52.
4. Fernández E, Simeone A, Andregnette B. Sistemas de producción de carne intensivos: la experiencia del GIPROCAR. In: Seminario de actualización técnica: producción de carne vacuna y ovina de calidad. Montevideo: INIA; 2003. p. 139-44. (Actividad de difusión; 317).
5. Simeone A, Invernizzi G, Buffa JI, Andregnette B. Variables determinantes del resultado físico y económico de la invernada en sistemas agrícola ganaderos de las regiones Litoral Oeste y Cristalino Centro. In: Simeone A, editor. Nuevas alternativas tecnológicas y cambio técnico en sistemas de invernada del litoral oeste y cristalino centro del Uruguay (GIPROCAR II). Montevideo: INIA; 2013. p. 7-24. (Serie Técnica; 205).
6. Vaz Martins D. El proceso de intensificación de la invernada hacia la producción de carne de calidad. In: Jornada de ganadería intensiva. Montevideo: INIA; 1999. p. 33-41. (Actividad de difusión; 213).
7. Sollenberger LE, Agouridis CT, Vanzant ES, Franzlebbers AJ, Owens LB. Prescribed grazing on pasturelands. In: Nelson CJ, editor. Conservation outcomes from pastureland and hayland practices: assessment, recommendations, and knowledge gaps. Lawrence: Allen Press; 2012. p. 111–204.
8. Reinoso V, Soto C. Cálculo y manejo en pastoreo controlado. Veterinaria. 2006;41(161-162):9-24.
9. Moore JE, Brant MH, Kunkle WE, Hopkins DI. Effects of supplementation on voluntary forage intake, diet digestibility, and animal performance. J Animal Sci. 1999;77(2):122-35.
10. Roberts SD, Kerth CR, Braden KW, Rankins Jr DL, Kriese-Anderson L, Prevatt JW. Finishing steers on winter annual ryegrass (Lolium multiflorum Lam.) with varied levels of corn supplementation I: effects on animal performance, carcass traits, and forage quality. J Anim Sci. 2009;87:2690-9.
11. Mieres JM. Tipo de suplemento y su efecto sobre el forraje. In: Vaz Martins D, editor. Suplementación estratégica para el engorde de ganado. Montevideo: INIA; 1997. p. 11-5. (Serie técnica; 83).
12. Burns JC. ASAS Centennial Paper: Utilization of pasture and forages by ruminants: a historical perspective. J Anim Sci. 2008;86:3647-63.
13. Tedeschi LO, Molle G, Menendez HM, Cannas A, Fonseca MA. The assessment of supplementation requirements of grazing ruminants using nutrition models. Transl Anim Sci. 2019;3(2):811-28.
14. Coleman SW, Moore JE. Feed quality and animal performance. Field Crops Res. 2003;84:17-29.
15. Sollenberger LE, Vanzant ES. Interrelationships among forage nutritive value and quantity and individual animal performance. Crop Sci. 2011;51:420-32.
16. Rouquette FM. Invited Review: the roles of forage management, forage quality, and forage allowance in grazing research. Prof Anim Sci. 2016;32:10-8.
17. Huuskonen A, Huhtanen P, Joki-Tokola E. Evaluation of protein supplementation for growing cattle fed grass silage-based diets: a meta-analysis. Animal. 2014;8(10):1653-62.
18. Boval M, Edouard N, Sauvant D. A meta-analysis of nutrient intake, feed efficiency and performance in cattle grazing on tropical grasslands. Animal. 2015;9(6):973-82.
19. NASEM. Nutrient Requirements of Beef Cattle. 8th rev. ed. Washington (DC): National Academies Press; 2016. 494p.
20. Weisdorf D, Hakke R, Blazar B, Miller W, McGlave P, Ramsay N, Kersey J, Filipovich A. Risk factors for acute graft-versus-host disease in histocompatible donor bone marrow transplantation. Transplantation. 1991;51(6):1197-203.
21. Agboola O, Benoit B, Cross P, Da Silva V, Esche B, Lesiuk H, Gonsalves C. Prognostic factors derived from recursive partition analysis (RPA) of radiation therapy oncology group (RTOG) brain metastases trials applied to surgically resected and irradiated brain metastatic cases. Int J Radiat Oncol Biol Phys. 1998;42:155-9.
22. Chang JS, Kim KH, Keum KC, Noh SH, Lim JS, Kim HS, Rha SY, Lee YC, Hyung WJ, Koom WS. Recursive partition analysis of peritoneal and systemic recurrence in patients with gastric cancer who underwent D2 gastrectomy: implications for neoadjuvant therapy consideration. J Surg Oncol. 2016;114(7):859-64.
23. Carámbula M. Potenciales y alternativas para producir forraje. In: Carámbula M, editor. Pasturas y forrajes. Vol. 1. Montevideo: Hemisferio sur; 2007. 357p.
24. Rearte DH, Pieroni GA. Supplementation of temperate pastures. In: Proceedings of the XIX International Grassland Congress; 2001 Feb 11-21; San Pablo. San Pablo: FEALQ; 2001. p. 679-89.
25. Armstrong DV. Heat stress interaction with shade and cooling. J Dairy Sci. 1994;77:2044-50.
26. Mader TL, Davies MS. Effect of management strategies on reducing heat stress of feedlot cattle: feed and water intake. J Anim Sci. 2004;82:3077-87.
27. Brown-Brandl TM. Understanding heat stress in beef cattle. R Bras Zootec [Internet]. 2018 [cited
2021 Mar 01]; 47:e20160414. Available from: http://bit.ly/3b2bpv2.
28. Beretta V, Simeone Á, Bentancur O. Manejo de la sombra asociado a la restricción del pastoreo: efecto sobre el comportamiento y performance estival de vacunos. Agrociencia Uruguay. 2013;17:131-40.
29. Lancaster PA, Krehbiel CR, Horn GW. A meta-analysis of effects of nutrition and management during the stocker and backgrounding pase on subsequent finishing performance and carcass characteristics. Prof Anim Sci. 2014;30:602-12.
30. Schoonmaker JP, Loerch SC, Fluharty FL, Zerby HN, Turner TB. Effect of age at feedlot entry on performance and carcass characteristics of bulls and steers. J Anim Sci. 2002;80(9):2247-54.
31. Goetsch AL, Murphy GE, Grant EW, Forster LA, Galloway DL, West CP, Johnson ZB. Effects of animal and supplement characteristics on average daily gain of grazing beef cattle. J Anim Sci. 1991;69(2):433-42.
32. Ackerman CJ, Purvis II HT, Horn GW, Paisley SI, Reuter RR, Bodine TN. Performance of light vs heavy steers grazing plains old world bluestem at three stocking rates. J Anim Sci. 2001;79(2):493-9.
33. Krehbiel CR, Kreikemeier KK, Ferrell CL. Influence of Bos indicus crossbreeding and cattle age on apparent utilization of a high-grain diet. J Anim Sci. 2000;78(6):1641-7.
34. Reuter RR, Beck PA. Carryover effects of stocker cattle systems on feedlot performance and carcass characteristics. J Anim Sci. 2013;91:508-15.
35. Risso D, Ahunchaín M, Cibils R, Zarza A. Suplementación en invernadas del litoral. In: Restaino E, Indarte E, editors. Pasturas y producción animal en áreas de ganadería intensiva. Montevideo: INIA; 1991. p. 51-65. (Serie técnica; 15).
36. Beretta V, Simeone A, Franco J, Bentancur O. Suplementación con fuentes de fibra o almidón a novillos en terminación pastoreando verdeos de invierno. Agrociencia Uruguay. 2017;21:131-9.
37. Beretta V, Simeone A, Elizalde JC, Baldi F. Performance of growing cattle grazing moderate quality legume–grass temperate pastures when offered varying forage allowance with or without grain supplementation. Aust J Exp Agric. 2006;46:793-7.
38. Sollenberger LE, Vanzant ES. Interrelationships among forage nutritive value and quantity and individual animal performance. Crop Sci. 2011;51:420-32.
39. Rouquette FM. Grazing systems research and impact of stocking strategies on pasture-animal production efficiencies. Crop Sci. 2015;55:2513-30.
40. Lange A. Relaciones “animal-pastura-suplemento”. In: Lange A, editor. Suplementación de pasturas para la producción de carne. Buenos Aires: AACREA; 1980. p. 8-16.
41. Banchero G, Mieres J, Tieri MP, La Manna A. ¿Cómo consumir sus verdeos de invierno con terneros o novillos teniendo una buena utilización de los mismos? In: Jornada de ganadería: el menú de la invernada. Montevideo: INIA; 2011. p. 4-8. (Actividad de difusión; 658).
42. Duckworth JE, Shirlaw DW. A study of factors affecting feed intake and the eating behaviour of cattle. Anim Behav. 1958;6:147-54.
43. Cabrera-Estrada JI, Delagarde R, Faverdin P, Peyraud JL. Dry matter intake and eating rate of grass by dairy cows is restricted by internal, but not external water. Anim Feed Sci Technol. 2004;114:59-74.
44. Vérité R, Journet M. Influence de la teneur en eau et de la déshydratation de l'herbe sur sa valeur alimentaire pour les vaches laitiéres. Ann Zootec. 1970;19(3):255-68.
45. Osoro K, Cebrian M. Digestibility of energy and gross energy intake in fresh pastures. Grass Forage Sci. 1989;44:41-6.
46. Mieres J, Assandri L, Cúneo M. Tablas de valor nutritive de alimentos. In: Mieres J, editor. Guía para la alimentación de rumiantes. Montevideo: INIA; 2004. p. 13-68. (Serie técnica; 142).
47. Mertens DR. Regulation of forage intake. In: Fahey GC, editor. Forage quality, evaluation and utilization. Madison: Am Soc Agron; 1994. p. 450-93.
48. Minson DJ, McDonald CK. Estimating forage intake from the growth of beef cattle. Trop Grassl. 1987;21:116-22.
49. Di Marco ON. Crecimiento de vacunos para carne. Balcarce: AAPA; 1988. 246p.
50. Dixon RM, Stockdale CR. Associative effects between forages and grains: consequences for feed utilisation. Aust J Agric Res. 1999;50:757-73.
51. Simeone A, Beretta V. Uso de alimentos concentrados en sistemas ganaderos. ¿Es buen negocio suplementar al ganado? In: Simeone A, Beretta V, Franco J, Baldi F, editors. Jornada anual de la unidad de producción intensiva de carne (UPIC). Paysandú: Facultad de Agronomía; 2004. p. 10-19.
Notes
Author notes
jclariget@inia.org.uy