2021
251
26022018
14122020
 Febrer, C. carlafebsa@gmail.com
Universidad de la República, Uruguay
Dieguez, F.
Universidad de la República, Uruguay
Gazzano, I.
Universidad de la República, Uruguay
Abstract: In the context of agrarian intensification and unsustainability of family livestock farming in Uruguay, it is important to understand the critical elements of productive units to guide possible improvement strategies. This study integrates socioeconomic and environmental information collected through a system of records of the project “Improvements in Family Livestock Farming Sustainability in Uruguay” (INIA, MGAP and the Agricultural Plan Institute). The system evaluated, interpreted and identified critical points for extensive family farming systems. This study presents the constructions of a multicriteria approach of sustainability indicators incorporating environmental, social and productive aspects to evaluate 13 Uruguayan family livestock systems. The results show low relative values in the indicators of the environmental dimension, allowing to direct possible changes in the practices of the productive system. On the other hand, with this case study, the importance of considering a multidimensional vision in the analysis of production systems is evident in order to contemplate all their complexity and identify the critical aspects to take into account.
Keywords: grazing livestock systems, familiar agriculture, sustainability indicators.
Resumen: En un contexto de intensificación agraria e insustentabilidad de la ganadería familiar en Uruguay, es importante comprender los elementos críticos de las unidades productivas para orientar posibles estrategias de mejora. El presente trabajo aúna información socioeconómica y ambiental predial recogida a través de un sistema de registros del proyecto «Mejora en la Sostenibilidad de la Ganadería Familiar de Uruguay» (INIA, MGAP e Instituto Plan Agropecuario), diseñado para identificar, evaluar e interpretar aspectos clave para la ganadería extensiva familiar. Se integraron aspectos ambientales, sociales y productivos en un conjunto de indicadores multicriterio, para la evaluación de la sustentabilidad en 13 predios familiares. Los resultados muestran bajos valores relativos en los indicadores de la dimensión ambiental, permitiendo orientar posibles cambios en las prácticas del sistema productivo. Por otro lado, con este estudio de casos, se evidencia la importancia de considerar una visión multidimensional en el análisis de los sistemas productivos para contemplar toda su complejidad e identificar los aspectos críticos a tener en cuenta.
Palabras clave: ganadería pastoril, agricultura familiar, indicadores de sustentabilidad.
Resumo: Em um contexto de intensificação e de insustentabilidade da pecuária familiar no Uruguai, é importante compreender os elementos críticos das unidades produtivas para orientar possíveis estratégias de melhoramento. O presente trabalho reúne informações socioeconômicas e ambientais de sítios coletadas por meio do sistema de registros do projeto “Melhoria da Sustentabilidade da Pecuária Familiar no Uruguai” (INIA, MGAP e Instituto Plan Agropecuario) desenhado para identificar, avaliar e interpretar aspectos fundamentais para a pecuária familiar extensiva. Foram integrados aspectos ambientais, sociais e produtivos sob um conjunto de indicadores multicritério para a avaliação da sustentabilidade em 13 sítios familiares. Os resultados mostram baixos valores relativos nos indicadores da dimensão ambiental, permitindo orientar possíveis mudanças nas práticas do sistema produtivo. De outro lado, com este estudo de casos, evidencia-se a importância de levar em conta uma visão multi-dimensional na análise dos sistemas produtivos para contemplar toda sua complexidade e identificar os aspectos críticos a serem considerados.
Palavras-chave: pecuária pastoril, agricultura familiar, indicadores de sustentabilidade.
Natural and environmental resources
Multicriteria sustainability evaluation of thirteen extensive rearing and full-cycle family livestock farming systems of Uruguay
Evaluación multicriterio de la sustentabilidad de trece sistemas ganaderos familiares extensivos de cría y ciclo completo de Uruguay
Avaliação multicritério da sustentabilidade de treze sistemas familiares pecuarios no Uruguai
Febrer, C. carlafebsa@gmail.com
Dieguez, F.
Gazzano, I.
Received: 26 February 2018
Accepted: 14 December 2020
Published: 23 April 2021
Corresponding author: carlafebsa@gmail.com

Currently, agriculture is going through an industrialization process as a consequence of the capitalist economic model that privatizes and commercializes ecological goods, turning them into speculation objects or commodities(1). It is a technical revolution promoting innovation that aims to dominate nature through science and technology in order to maximize profits(2).
This process has a high environmental cost, leading ecosystems to a state of stress(3) and giving rise to an emerging agricultural crisis causing rural population impoverishment(1). It is a coevolution towards a model in which production is linked to market strategies(4). This model disconnects the value of products from human well-being needs and dissociates the relationship between products and means of production, detaching people from land and basing productive forces on competitiveness(2).
As a consequence, family farmers are put under pressure and forced to abandon productive activities due to the difficulties of surviving competitive markets and the demands for constant technological innovation dependent on inputs(5)(6)(7). This increases social inequality in the territorial conformation change caused by land concentration(8)(9).
Family production in Uruguay has experienced a transformation over time. From the 60s to the end of the last millennium, this group was strongly pressured due to the implementation of the neoliberal economic model, leading to a process of disappearance and transformation of the rural environment(10).
Based on information from the last agricultural census carried out in the country, it can be observed that between the years 2000 and 2011 the number of farms of less than 100 ha decreased by 22%(11) while the country's productive area remained the same, showing an increase in farm size(12)(13)(14).
This process was favored by the arrival and expansion of forestry and rainfed agriculture, promoting land concentration and foreign ownership, increasing its price and displacing family producers(15). As a consequence, a new rural scenario developed, in which land tenure is not stable and production is subordinated to service companies that promote countryside modernization through “technological packages”(16). Likewise, producers are firmly linked to products, inputs, labor, credits and land markets(14) which lead them to dependency and unsustainability.
Family farmers in Uruguay are pictured as “small or medium farmers dedicated to the production of meat, wool or milk who might combine their main activity with a secondary agricultural activity”(16). This characterization is conceptually consistent with the formal definition established at ministerial level (Ministerial Resolutions 219 and 387/14). Furthermore, when taking into account its productive characteristics, Uruguay has a livestock area of 12 million hectares which represents 75% of the agricultural area(13). It can be stated that livestock farmers are the main holders of the country's natural resources (common goods) from a territorial perspective and the main actors in the rural environment, considering the proportion of family farmers within the industry(17).
This situation can determine the sustainable development of the family livestock sector, therefore, conditioning the possibility to avoid degradation of nature and society(18).
The concept of sustainability is complex and dynamic and starts from the idea of encompassing the main components of agroecosystems, including their interrelations(19). In a broad sense, sustainability can be understood as maintaining a series of desired goals over time. These goals are related to balance and tensions between three dimensions: environmental, economic-productive and social. Sustainability involves having good and economically viable productivity without affecting or impacting ecosystem functionality, and presenting no social risks(20).
The importance of a comprehensive evaluation of production systems is based on a holistic vision(21) and on considering the inherent complexity in ecological, social, cultural and economic aspects that constitute them(22). A more exhaustive and complete description is sought to facilitate both the analysis and detection of potentiating and conflicting elements of each system.
Several tools are used to assess sustainability, which arise from the need to make this concept operational, bringing it to real cases and generating technical recommendations towards a more sustainable natural resource management(23). One of the main analysis methodologies is the Evaluation Framework for Natural Resources Managing Systems incorporating Sustainability Indicators (mesmis, by its Spanish acronym), which is a tool used for sustainability assessment of production systems. This methodology evaluates systems in space, time and within a specific sociocultural context through diagnostic criteria or indicators that integrate information obtained through multi-criteria analysis techniques(19). Sustainability indicators are variables that define the complexity of a system from a sustainability perspective and are used to monitor changes(24), aiming to achieve human and ecosystem well-being(25) for each of the specific dimensions considered (economic, social and environmental).
Over the past decade in Uruguay, several studies aimed to evaluate sustainability through indicators as a helpful tool for farm-level diagnosing and guiding improvements and decision-making. The project carried out by the multidisciplinary group “Zoom” between 2008-2010 is one of them, which analyzed the main factors affecting technology adaptation in breeding livestock through sustainability indicators(26). Likewise, studies on family dairy farms developed by researchers from the Veterinary College have been carried out(27)(28), in which a system of indicators was created based on the method Sustainability Indicators for Agricultural Activities, (idea by its French acronym)(29), using farm and individual surveys in addition to potential assessments of the approach. On the other hand, the research carried out by Albicette and others(30) presents an alternative to evaluate farm sustainability through indicators using an adaptation of the mesmis method, created in participatory workshops along with a group of producers from Rio Negro (Uruguay). Another Uruguayan research carried out by Oyhantçabal and others(31) presents case studies of family farmers, where indicators from studies carried out in dairy and cattle family farms were adapted and used in swine production(27)(32)(33).
Some issues were identified from the mentioned background studies, including in particular the state of natural grassland and social aspects such as capital transferability and land tenure. While background studies focus on different production systems, in several contexts and with partially dissimilar indicators, it is always relevant to characterize the condition of productive resources such as grassland and an update of arising farm issues.
The objective of this research is to carry out an assessment of family livestock farmers' sustainability and to discuss possible problems and improvement areas in production systems, contrasting them with previous similar investigations.
The investigation was performed along with a group of livestock farmers by defining key indicators of system operation. Francis and Altieri(34) express the interest to obtain a tool for guiding improvements in family livestock systems that highlights critical features, that additionally helps visualize possible issues, contemplating social, economic and environmental aspects.
A priori, it can be hypothesized that sustainability of a productive system can be evaluated through indicators disaggregated into their social, economic and environmental dimensions. Furthermore, considering background studies in the country, sustainability of family livestock production systems is affected by conditions of natural grasslands, and economic and social factors, such as capital transferability and succession, among others.
For the development of this research and to perform a multi-criteria evaluation, a set of indicators was established based on the mesmis(19) and idea(29) methods. The biggest difference, especially with the mesmis method, is the construction of indicators defined before their application, which were based on information collected in the uffip (Uruguay Family Farming Improvement Project, 2013-2016) and not in a participatory way with those involved. However, the indicators used were similar to those established in previous sustainability evaluation experiences for family farming, mainly in the studies by Morales and others(26), Tommasino and others(27)(28), Albicette and others(30) and Oyhantçabal and others(31). Likewise, according to the information collected, new indicators were generated to assess sustainability in livestock systems participating in the aforementioned project (described in the section “Indicators and analysis dimensions”).
Data collection survey for uffip was carried out through meetings and annual conferences open to the community, based on a farm called “focus site” and along with a group of approximately six producers, depending on each case. Economic, environmental, productive and social aspects of the 2013-2014 financial year for the agricultural sector were taken into account. A registration and planning tool called Integrated Farm Management (ifm) was used to enter the information into electronic forms, integrating an exhaustive description of the farms.
From these data, a theoretical concept of sustainability was generated on which indicators were built for social, economic and environmental dimensions. Farms were evaluated using the available information of the aforementioned period entered in the ifm, and through five validation workshops (with a total of 50 participants, including 39 producers of the Focus group and 11 follow-up technicians), where the concept of sustainability was discussed. A definition adapted to each farmer group was generated in a participatory way and the indicators were presented and discussed.
Actors' activity evaluation was carried out through personal and anonymous surveys of all participants, using the Likert test(35) with a scale of 1 to 5, being 1 “totally disagree” and 5 “totally agree” for each statement. The answers were collected and summed according to their value in the scale and their corresponding statement in order to calculate the percentage of each value in the total of surveys. Regarding the sustainability indicators generated, the following statements were made:
“Sustainability assessment, as presented in the workshop, is important to consider farms in an integrated way”.
“The way of evaluating sustainability presented today in the workshop is useful to identify emerging issues in the farm”.
“Through sustainability evaluation as presented in the workshop, it is possible to plan actions to manage emerging issues in the farm”.
“The indicators (economic, social and environmental) presented today in the workshop are relevant and represent the analyzed farm”.
Twenty-four indicators were developed and grouped into the three dimensions of sustainability using information from the ifm and taking background studies in Uruguay as reference. The indicators that were constructed are expressed on a continuous scale that goes from 0 (minimum) to 1 (maximum), considering decimal values between both limits. In all cases, when an indicator exceeds the maximum value, it is given a value of 1.
Indicator calculation and thresholds are detailed below.
a. Gross Productivity (Productivity)
Description: Productivity in kg of meat equivalent/ha. Calculation of Gross Productivity = sales – purchases consumption + (final stock-initial stock), in kg/ha/year.
Reference: according to production orientation, the national average is 104 kg/ha/year (2013-2014, “Carpeta Verde” of the Agricultural Plan Institute).
Indicator calculation = Gross productivity/reference.
b. Net Income (Net_Income).
Description: Net income of livestock activity system. Calculation of Net Income = Income-Expenses, in usd/year.
Reference: basic living costs $UY 55.637 x 12 months/average usd to $UY exchange rate for 2013-2014, according to the National Statistical Institute (ine by its Spanish acronym).
Indicator calculation = Net income value/reference.
c. Off-farm Income (Off_Farm_Inc).
Description: Proportion of off-farm income of the total income of the farm, in usd/year. Extra-property income/total income.
Reference: a relationship inversely proportional to the proportion of off-farm income that sustains each production system is considered. Dependence on livestock activity is reduced as off-farm income increases.
Indicator calculation = 1- (off-farm income value/total income value).
d. Income Diversification (Inc_Div).
Description: it is generated based on the Shannon-Weaver index(36), considering, for this case, that economic activities linked to the different items that constitute the Gross Income contribute equally. This indicator is self-referential to the group of 13 farms, presenting relative diversity to the maximum productive diversity of the group of farms.
Reference: relative abundance of gross income categories in farm is considered (cattle, sheep, wool, leather and income recorded from the sale of other products).

Where f is the number of the farm, Hmax the maximum value of H of the farm set, i the number of items that generate economic income in each farm considered in the calculation of Gross Income and p income per item value of Gross Income.
e. Input/output ratio (I/O_R).
Description: Cost of producing one dollar of product. Input/output ratio = Gross Income / Production Costs.
National references: Maximum limit value 0.61 (2013-2014 financial year, “Carpeta Verde” of the Agricultural Plan Institute).
Indicator calculation: takes value 1 for values of Input/output ratio lower than the national reference. For values of Input/output ratio greater than the reference, an inversely proportional relationship is generated between the value of the indicator and the ratio between input cost and product price, in usd. In this situation, the indicator takes its value according to the line with slope -2 and independent variable +2, so that with input/output ratio = 1, the value of the indicator equals 0.
f. Debt level (Debt).
Description: Perception of debt level by farmers registered in ifm, with a predetermined scale.
Indicator value according to scale; High: 0; Medium: 0.33; Low: 0.66 and Null: 1.
g. Productive security (Prod_Sec).
Description: Proportion of area owned, leased to the government agency National Institute of Colonization (inc) or to a family member, related to the total area of the farm.
Reference: Continuous value on a scale of 0 to 1, where the maximum is the total productive area owned. The area leased to the inc and to relatives was weighted with a factor of 0.5.
Indicator calculation = (area owned + 0.5 * area leased to inc + 0.5 * area rented to a family member) / total area.
h. Transferability (Transf).
Description: It is the area inheritable to each successor, taking into account the total area of the system and the number of heirs (area in ha / number of heirs).
Reference: 250 ha per heir, group “Zoom”.
Indicator calculation = transferability / reference value.
a. Operation and exploitation results (Op_Conf).
Description: It considers producers' satisfaction with farm operations and their perception of economic and productive results, recorded in the tool ifm, according to a predefined scale.
Indicator value according to the following scale: Very high: 1; High: 0.8; Medium: 0.6; Regular: 0.4 and Low: 0.2, for each item.
Calculation Indicator = (value of operation satisfaction + value of satisfaction with economic results + value of satisfaction with productive results) / 3.
b. Lifestyle and free time (Life_Sat).
Description: Considers producers' perception of their average satisfaction over their free time and life quality, according to a predefined scale.
Indicator value according to the following scale: Very high: 1; High: 0.8; Medium: 0.6; Regular: 0.4 and Low: 0.2, for each item.
Indicator calculation = (free time satisfaction + life quality satisfaction) / 2.
c. Social Engagement (Social_Eng).
Description: Considers producers' perception of contentment with social interaction possibilities and contact with other people, according to a predefined scale.
Indicator value according to the following scale: Very high: 1; High: 0.8; Medium: 0.6; Regular: 0.4 and Low: 0.2, for each item.
Indicator calculation / indicator value.
d. Access to services (Acc_Serv).
Description: Considers access to health services, training access and availability of study centers, according to predefined options.
Indicator value according to option: answer Yes: 1 and answer No: 0, for each item.
Indicator calculation: Access to services = (value of access to health services + value of access to training + value of access to study centers) / 3.
e. Housing Conditions (Housing).
Description: Considers producers' perception of the conditions of their residence.
Reference: according to ine's scale. Comfortable: 4; Standard: 3; Modest: 2 and Precarious: 1.
Indicator calculation / indicator value / 4.
f. Connectivity and Accessibility to populated areas (Connectiv).
Description: Considers private transportation means, road connectivity (routes and transport) and distance to populated areas, according to predefined scales.
Reference: according to scale and response. For perception of connectivity: Very Good: 1; Good: 0.8; Standard: 0.6; Fair: 0.4 and Bad: 0.2. For private transport (vehicle ownership), according to answer: Yes: 1 and No: 0. For distance to populated areas, the following value is assigned: 5 km: 1; 10 km: 0.75; 25 km: 0.5 and more than 25 km: 0.25.
Indicator calculation: (connectivity perception value + private transport value + distance value to populated centers) / 3.
g. Service Availability (Services).
Description: Considers access to communication services (landline, mobile phone) and internet, electricity sources and availability and source of drinking water, according to producers' responses and predefined scale.
Indicator value by class: answer Yes: 1; Answer No: 0 for landline or mobile phone, and internet. For drinking water and electricity, it is considered: No access: 0; Access to state providers ute and ose: 3; Access to other sources: 1.5.
Calculation of indicator (telephonic communications value + internet value + water access value/3+ electricity access value/3)/4.
h. Family Continuity (Fam_Cont).
Description: Considers the possibility that the farm will continue to be owned and managed by family in the next 5 years and the next 10 years, according to producers' response on a predefined scale.
Reference: according to scale. Certainly: 1; Likely: 0.66; Unlikely: 0.33; Certainly not: 0.
Indicator calculation: (possibility value of continuity at 5 years + possibility value of continuity at 10 years)/2.
i. Education level (Education).
Description: Contemplates farmers' training activities considering formal education, past general training and courses carried out in the last year as well as a weighted score referring to seniority in the industry.
Reference: For formal education, values are assigned according to the following: Primary school: 1; Secondary school: 2; Technical training: 3 (including state technical school utu) and University: 4. For seniority in the industry, values are assigned according to active years: 0 to 5 years: 1; 6 to 10 years: 2; 11 to 15 years: 3 and over 15 years: 4. Seniority is weighted multiplying it by 2. For courses taken, the number of courses taken both in the past and in the last year are considered according to farmers' statements.
Indicator calculation = (Formal education + Courses taken + Courses in the last year + (Seniority in the industry) * 2)/20.
a. Grassland Conservation Index (gci).
Description: It considers the proportion of natural grassland on the property, natural grassland deterioration and management conditions of the entire property.
Reference: the pasture conservation index was used, elaborated by qualified experts of the Grassland Alliance(37) association.
Indicator calculation: Pasture conservation index/100.
b. Stocking rate (Stock_Rate).
Description: Considers the number of animals per hectare of paddock, according to forage productivity.
Reference: depending on the stocking rate for each farm based on net primary productivity (npp), animal intake (considering 2% of live weight) and the number of animals in the system.
Indicator calculation: The stocking rate was estimated from data from npp for each farm and according to the number of animals. If the real stocking rate in the farm is within a range of +/- 10% of the stocking rate, the indicator takes value 1. In cases when it is not within the range, a linear relationship is generated to calculate the indicator value, with a positive slope for values below optimal and negative for higher values. In both situations, the indicator takes value 0 (graph intersection) at rates of 0.5 and 1.5 LU/ha, respectively.
c. Number of paddocks (Paddocks).
Description: Considers the number of paddocks on the farm.
Reference: 4 paddocks have been deemed optimal, considering the characteristics of the studied farms and the reference given by the group Zoom. Hence, if the number of paddocks is less than 4 it is given a value of 0, if it is greater it takes the value 1.
Indicator calculation: if number of paddocks <4, indicator value = 0; if not, indicator value = 1.
d. Water Resources Assessment (Water_Res).
Description: Wetlands, lakes, rivers and streams are evaluated, considering the assessment made by the monitoring technician, using a predefined scale and according to the criteria established by Stachetti and Moreira(38).
Reference by class: Excellent: 1; Good: 0.75; Fair: 0.5 and Deficient: value 0.25.
Indicator calculation = (wetlands value + lakes value + rivers and streams value) / 3.
e. Input Use Deintensification (Inp_Use_De).
Description: Considers the proportion of the costs of energy subsidies (agrochemicals, fuel and animal supplementation) to total production costs.
Reference: continuous value in scale 0 to 1.
Indicator calculation= 1-[(fertilizer cost + herbicide cost + farm machinery fuel cost + seed cost + supplementation cost)/total production costs].
f. Input Use efficiency (Input_Ef)
Description: Considers the relationship between the cost of used inputs involving an energy subsidy (agrochemicals, fuel and animal supplementation) and gross income.
Reference: continuous value in scale 0 to 1.
Indicator calculation= 1-[(fertilizer cost + herbicide cost + farm machinery fuel cost + seed cost + supplementation cost)/Gross Income].
g. Ecosystem disturbance (Eco_Dis)
Description: Considers the sum of farm management activities, weighted according to their level of disturbance, inspired by the Intensification Index(39). For land use categories, surface percentage was calculated and weighted according to the degree of ecosystem disturbance.
References:
Minimum disturbance 1: percentage of natural forest plus farm land not used for production.
Minimum disturbance 2: percentage of natural grassland.
Average disturbance 1: percentage of improved and fertilized natural grassland.
Average disturbance 2: percentage of artificial forest (afforestation).
Highest degree of disturbance: percentage of paddocks + crops + stubbles.
Indicator calculation = [((Minimum Disturbance 1+ Minimum Disturbance 2) * 2) + (Average Disturbance 1 + Average Disturbance 2) + (Highest degree of Disturbance* 0)] / 2.
The uffip project included 19 livestock farms in total. The call was voluntary and public and carried out by the Agricultural Plan Institute and inia through the national unions that form them (Rural Association, Rural Federation, Federated Agrarian Cooperatives and National Commission for Rural Development). Criteria such as availability to be a “focus site” or to participate as a focus group with a schedule of periodic meetings (public and internal to the group) were included in the call bases, in addition to accepting to generate and share information and to be willing to make changes in the farm following the objectives set by them and the focus group.
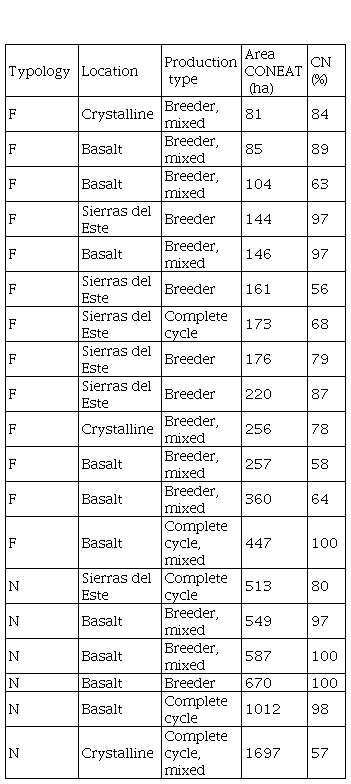
Of the 19 livestock farms participating in the project, 13 were family and 6 non-family (see Table 1). In this study, only the information from the 13 family livestock farms was used. Ministerial Resolutions 219 and 387/14 were used to define and characterize family farms which have the following criteria: maximum two non-family waged employees, up to 500 ha (weighted at coneat 100), live on the farm or not farther than 50 km away and off-farm income less than or equal to 14 bcl (equivalent to 39,466 Uruguayan pesos) monthly average, for the 2013-2014 fiscal year.
Family farms (n=13) have an average area of 201 ha coneat 100, and 78% area in average natural grassland. They are mostly mixed farmers with livestock as their main productive activity, located in basalt, eastern and central ranges of the country (see Table 1). Information on the analyzed systems is available on the website of uffip(40), including a more exhaustive description of each system and video interviews to the participating producers.
Data not available: The data set that supports the results of this study is not publicly available.
Firstly, it is worth mentioning that the evaluation of the workshops carried out with producers shows that both the methodology and the indicators are relevant for the multi-criteria sustainability evaluation of the livestock systems involved(41)(42). Accordance results (4+5 values of the Likert scale) were 92%, 85%, 88% and 73% for statements i, ii, iii and iv, respectively. Regarding the workshops, Febrer(43) expands on the topics discussed, the definitions of sustainability and the analysis carried out in conjunction with the stakeholders. In all cases, participants made a positive assessment of the methodology and topics discussed, especially incorporating a multidimensional analysis of production system functioning, involving social and environmental issues as well as economic-productive ones.
Regarding the indicators results in the three evaluated dimensions, Figure 1 (1a: economic, 1b: social, and 1c: environmental) shows the values for each of them, for each family system monitored.
The following section discusses the main results and findings of the investigation.
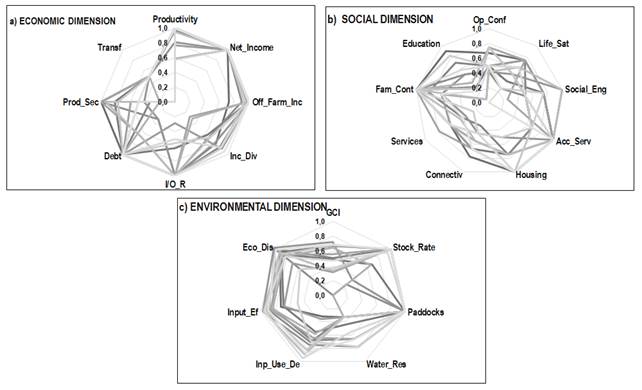
In the economic dimension, values obtained for net income, productivity and off-farm income indicators are highlighted. These three indicators present high values for all the analyzed farms, as in the work carried out by Molina(44). This aspect can be related to the main objectives presented by Uruguay's institutional rural development support plans, which seek to maximize farm efficiency by increasing productivity per area (kg/ha) through the implementation of a technology package(17). This technological package proposes management, sanitary, genetic and nutritional improvement practices based on natural grassland management with greater use of inputs or pasture substitution for permanent forage crops(45), consequently compromising the environment and making systems more dependent on inputs. On the other hand, it is important to contextualize the historical moment in which the data were collected. In the 2013-14 period, Uruguay had a high world meat demand, with relatively favorable prices and low internal production costs which provided a good beef market outlook(46)(47).
Off-farm income represents the dependence on income from activities outside the farm. According to the calculation proposed in this research, a priori it is considered that this indicator is inversely related to sustainability since self-sufficiency of the system is one of its attributes(19). The evaluated cases present high values for this indicator, showing that farms focus their economic activity on livestock production and that there is no need for off-farm income to support a family of livestock farmers.
It is important to mention that off-farm work can represent a deliberate producer strategy to generate income during critical moments of the production system or to increase total income(48). Therefore, it is complex to generalize these aspects to a larger scale of livestock producers, considering the possibility of a bias in the sample of this study, as well as in a different context. However, the main challenge for producers is time management to carry out tasks inside and outside the system, and balancing family time(49). According to Malaquín(50), paid off-farm activities that are linked to agricultural production may encourage synergies with productive systems, while urban labor activities may present competition, especially in areas where livestock farming is facing a financial crisis. Producers' age and succession expectations are factors that may also condition the performance of off-farm activities that livestock farmers have or may have(50).
On the other hand, it is also interesting to analyze the income diversification indicator, which assesses the variety of productive items that generate income within the productive system. In this case, the value of the indicator increases as farm livestock species do. Systems presenting a higher value in this indicator have the possibility of diversifying their production, carrying out a complete cycle, with partial cattle fattening or finishing, heavy lambs or other product categories. This indicator exposes a variety of results, presenting greater differences according to geographical distribution and observing lower values for producers from Sierras del Este. This can be related to the edaphological characteristics of the region, limiting productive activities mainly to livestock breeding systems(51).
The most critical indicators in the economic dimension are productive security, linked to land tenure, and transmissibility, which is understood as the area (ha) by the number of heirs. This last indicator presents as threshold the value 250 ha/heir described by the work of the Zoom group(26).
Regarding production safety, a great result range is observed (see Figure 1). Firstly, it is important to highlight that limited access to land and capital is an attribute that characterizes family production throughout the southern cone, since “family farms are located in the lowest ranges of agricultural tenure size” and have “little working capital and reduced capacities to accumulate surpluses for capitalization”(52). Furthermore, competition with forestry and agriculture industries as well as high rent prices hinder land access to expand their productive area(15). Furthermore, a low indebtedness level indicator suggests that managers of the analyzed farms did not use these tools to increase their assets. Family farmers are cautious about taking out loans to make improvements or expand productive areas, hence becoming at times excluded from financial systems(28)(51).
Study cases present low values of transferability when analyzing this indicator in family farms (see Figure 1). Limited capital and farming area were highlighted as causes hindering the productive continuity of the system when passed onto their heirs, in the research carried out by Perrachón(53)(54), which studied succession in Uruguayan family livestock farming, agreeing with the results obtained for farming area per heir. It is important to note that producers do not usually look into the succession process until the property effectively lacks a legal owner(53)(55). It can be stated that this is a complex and multifactorial problem linked to the diversity of each family context, making it difficult to unify solutions given the plurality of causes(54).
When comparing the transferability indicator with the social dimension indicator of family continuity which assesses the perception of the producer about the possibility that the property will continue to be owned and managed by the family in the next 5 years and 10 years, contrasting results are observed. It is important to consider the real possibility of handing over farm management to future family generations and ensuring farming remains in family hands, either by survey participants or their heirs. This aspect is also shown in the sustainability evaluation carried out in livestock and dairy farms, in which a clear difference was found between transferability and succession(28)(44). High values for the family continuity indicator stand out in the assessment, contrary to rural youth displacement tendency and the decline and aging of the rural population(12). These indicators evidence the tension between the tendency of family farmers to shift towards other industries within the productive sector, and the difficulty of property transferability as both processes are resisted by them. The sense of identity to family farms and choosing farming as a lifestyle are highlighted. As stated in the study carried out by Morales and others(26), farms are “where we have lived for generations” and farming “is what I learned from my father, who learned from his grandfather, and what my children will learn from me”.
Regarding social dimension results, high variability is observed in the values obtained in different farms corresponding to the research of Malaquín and others(56), which addresses the diversity of contexts presented in productive systems. Analyzed farms present similar productive characteristics but significant social and family differences, reinforcing the importance of a holistic approach for studying the concept of sustainability considering systems in all their complexity(57).
The indicator of conformity in general farm operation and economic and productive farm results presented the lowest values, evidencing a critical aspect of this dimension. Furthermore, satisfaction with lifestyle, free time, connectivity and accessibility to populated areas, and availability of services are presented as critical indicators of the social dimension. These results match those obtained in the family farming study carried out by Morales and others(26), which highlights these as the main critical social aspects impacting permanence in rural areas. Nonetheless, it is noted that there is a greater lack of conformity regarding housing conditions and service availability in the Basalto area, and a lower educational level in the Sierras del Este producers.
These results expose the differences in service availability for each region, making visible the isolation difficulties family farmers usually experience(51).
In the environmental dimension, management of natural grassland and water resources stand out as the indicators with the lowest values, the most critical of the entire evaluation. Natural grassland degradation is an aspect also highlighted in the study carried out by Molina(44), considering pasture conditions as a critical aspect in livestock systems. Productive intensification of livestock systems induces soil degradation causing changes in land use and allowing overgrazing(58)(59). This last aspect is observed as a problematic element in family farmers with smaller farming areas. In an attempt to increase productivity in smaller farms, there is a risk of exceeding the possibilities of the available resources in the system, causing a state of stress on forage resources. This becomes a “perverse circle”(17) in which animal stock is usually increased as a result of good weather and market conditions, increasing consequently grazing pressure. Degradation of the plant cover is favored by this activity, leading to the deterioration of natural grassland. Additionally, there generally are periods when markets decline and environmental conditions are less favorable, leading to production and capital losses(17). Results obtained (see Figure 1) reveal that the indicator generated to evaluate the load of the system presents relatively low values, becoming a critical point of the systems, especially taking into account the “perverse family farmer logic” previously mentioned(17). In this sense, the relatively low values of gci are concerning when evaluating natural grassland conservation.
On the flip side, it is important to highlight that values obtained for the input efficiency indicator are low (see Figure 1). This indicator indirectly assesses environmental aspects of the systems through the relationship between input cost and gross income, and is directly related to productive characteristics of the studied systems, in which the use of external inputs is the basis for increasing yields and achieving greater production efficiency with potential environmental impact. Likewise, the input use deintensification indicator also presents low values. It is interesting to relate these indicators to the input-output relationship indicator (total cost to produce a dollar of product), since in this case farms present good results. The cases studied are extensive farms, considering the proportion of natural grassland (see Table 1), with low input-output ratio, and most of their production costs coming from inputs such as fertilizer, herbicides, machinery, seeds and supplementation as a consequence of the technological package implementation for system improvement in an intensification process. High dependence of production systems on input use can put sustainability at risk(14)(60), considering that autonomy and independence from external inputs correspond to sustainability attributes(19).
These development models that promote a process of improving systems through input-use based innovation implementation are framed within the “paradigm of modernity in which development implies unlimited growth”(61), contrary to the concept of sustainability which establishes limits to satisfy today's needs without compromising possibilities for future generations(61).
The indicator for number of paddocks per farm was the only dichotomous variable, taking a value of 0 or 1, depending on the case. The number of paddocks is higher than four in every farm except for one. Considering that this indicator can be arbitrary given the established threshold, it is questionable whether there is an ideal number of paddocks that could be suitable for all production systems. Despite this, and by consensus with the stakeholders participating in the workshops, it was considered that at least four paddocks are necessary for the proper functioning of the system.
A wide range of results is found in the evaluation of water resources; in some cases, animal access restriction to water holes is complied with, yet, in cases where there is no control, eutrophication and poor water quality can be observed.
It can be interpreted from the results obtained in the environmental dimension and from research carried out by Morales and others(26) that aspects related to this dimension may not be a priority in farm decision making or are not viewed as such. In any case, a negative impact is generated on the biophysical resources of the agroecosystems, representing a critical point in production systems.
The proposed indicators were suitable to evaluate farm sustainability in family livestock agroecosystems, according to the opinions collected in the workshops where the methodology was presented. Furthermore, the indicators enabled to carry out an initial diagnosis on the condition of family livestock systems and to determine some critical sustainability issues. It is a methodology that exposes the heterogeneity of each productive context to highlight points to be improved in production systems. In general terms, it can be concluded that in the farms studied the least critical dimension is the economic one, in which economic-productive indicators such as productivity, income level, off-farm income and debt level are not presented as main factors affecting sustainability. Nonetheless, it is worth mentioning that these indicators strongly depend on market prices and weather conditions.
For its part and within the indicators of the economic dimension, capital transferability presented relatively low values, in accordance with previous national background studies assessing sustainability at farm level in extensive livestock systems. As for the social dimension, the existence of tension is highlighted between producers' perception of their life quality, farm continuity in family ownership and real possibilities found in Uruguay. The latter together with low capital transferability can generate tensions in the system in the long-term. On the other hand, the environmental dimension of sustainability is evidenced as the most critical upon farmers. Furthermore, condition and management of natural grassland related to the load and the gci appear as key factors, prioritizing grassland maintenance and prevention of deterioration. These indicators presenting low values seem to characterize Uruguayan livestock systems, and correspond to findings from background studies in the country, despite using different specific indicators. This may expose a concerning situation, considering the role that natural grassland plays as a productive basis for family livestock systems. Depending on the system, the condition of water resources can be improved. All these aspects were discussed in the workshops with the actors, who recognize this methodology as a favorable instance for system reflection and evaluation, showing positive aspects and critical issues to improve.
Thus, the study carried out provides elements for possible improvements adapted to each situation in particular, stressing the need to contextualize each system according to its characteristics and objectives, considering conservation of productive resources and reproduction of family livestock systems.
Author contribution statement: All
authors contributed equally to the content.
Editors: The following editor approved this
article.
Gabriel Oyhantçabal (https://orcid.org/0000-0002-2500-4708)
Universidad
de la República, Facultad de Agronomía, Montevideo, Uruguay
http://agrocienciauruguay.uy/ojs/index.php/agrociencia/article/view/357/765 (pdf)
carlafebsa@gmail.com