

Electrical assessment of georeferenced distribution network due to electric vehicles deployment
Evaluación de un sistema eléctrico georreferenciado de distribución debido a la penetración de vehículos eléc
Revista de I+D Tecnológico
Universidad Tecnológica de Panamá, Panamá
ISSN: 1680-8894
ISSN-e: 2219-6714
Periodicity: Semestral
vol. 16, no. 1, 2020
Received: 24 June 2019
Corrected: 24 June 2019
Accepted: 02 December 2019

Abstract: Several cities worldwide are focused to reduce the environmental degradation based on the deployment and integration of renewable energies and electric vehicles (EV) into the distribution network. The first one replaces electricity produced by fossil fuels with solar, wind or hydro power plants, whilst the second one is a feasible alternative to substitute internal combustion engine (ICE) vehicles with eco-friendly vehicles. Set in this context, this paper proposes an examination about the main effects in a georeferenced distribution system when non-linear loads are connected to the grid. The distribution network model contemplates georeferenced data from customers, where unbalanced currents due to the customer’s consumption in each distribution transformer is evaluated using a variety of coefficient for commercial and residential load models. Voltage unbalance, harmonics and load flow analysis is performed in PowerFactory to determine the impacts of EVs to the grid
Keywords: Harmonics analysis, unbalanced loads, non-linear loads, georeferenced distribution network, electric vehicle.
Resumen: En la actualidad la sociedad está enfocada en la mitigación del daño ambiental basado en la integración de energía renovable y vehículos eléctricos en las redes eléctricas. Energías limpias como energía solar y eólica en la generación de electricidad están destinadas a reemplazar los derivados de combustible fósil, mientras que los vehículos eléctricos substituyen a los vehículos de combustión interna. En este contexto, el presente proyecto propone un análisis a una red eléctrica real georreferenciada considerando los principales retos que involucran la conexión de cargas no lineales al sistema eléctrico. El modelo utiliza información georreferenciada de los usuarios y la red eléctrica existente, donde corrientes desbalanceadas consumidas por los usuarios son evaluadas basado en modelos de carga para clientes residenciales y comerciales. El impacto debido a la inclusión de vehículos eléctricos es desarrollado en el software PowerFactory mediante análisis de flujos de potencia, análisis de amónicos y desbalance de voltajes.
Palabras clave: Análisis de armónicos, carga desbalanceada, carga no lineal, red de distribución georreferenciada, vehículos eléctricos.
1. Introducción
Electric vehicles deployment into the power distribution network is by far the biggest challenge in electrical and transport engineering, because it not only relates electrical facilities but also involves customer behaviors, transport patterns, infrastructure, technology advances and environmental concerns. The last one has become a paramount theme in the contemporary society, consequently some issues have been identified and possible solutions has been stated by academics [1]. Within this background, the environmental degradation has been mainly produced by the extensive utilization of ICE on transport sector, which consume considerable quantities of fossil fuels. Novel and modern technologies
have been developed by transport industry, which is focused to deplete the consumption of petroleum derivatives and extend the deployment of EV worldwide. Some countries have started to replace electrical vehicles instead of conventional vehicles due to fossil fuel limitations, and the results have been positive [2] [3].
The international transport industry market is primarily dominated by ICE vehicles due to customer reliance in traditional vehicles. The customer’s concerns about the transition from conventional fuel vehicles to eco-friendly vehicles are related with the insufficient battery capacity, the longer charging times, and lack of charging infrastructure. Nevertheless, technological advances are being developed to promote the
enlargement of EV fleets since new models present an enhanced battery performance, increasing the energetic autonomy and reducing the charging times. Consequently, rapid chargers could be located in zones with high urban density such as shopping centers, parks and municipal parking lots [4].
With a raising environmental concerns and technological advances, the electric industry worldwide has improved considerably in recent years. Generation, transmission and distribution systems have been renewed, and thus, thermal power plants which consume significant amounts of fossil fuels have been replaced by renewable energy like solar, wind and hydropower generation. Transmission corridors have been enhanced with the inclusion of several transmission lines connecting power plants with load centers, improving the flexibility and operability of the system [5]. The last stage of the system has been upgraded since daily operative works are achieved in distribution system to offer a better service to the customers. As consequence, medium and low voltage networks are undergoing rapid changes, therefore identification of impacts of EV and distributed generators have been carry out evaluating the balance between demand and supply and the potential violation of statutory limits [6], real cases has been investigated in [2], [7], where probabilistic approximations are utilized to determine impact on LV networks.
The deployment of EV around world is constantly growing, then public policies has been declared, which are focused with reduction of taxes for green vehicles, investments in mobility programs, replacing the conventional cars in governmental institutions by vehicles with low emissions [8]. Additionally, technical and commercial approaches has been stated to develop rapid charging infrastructure in parking zones and commercial areas with high traffic and population demand [9]. Consequently, not only a structural change in transport sector is imminent due to the introduction of electrical vehicles in medium and long term, but also distribution networks will face several effects and impacts in their assets, then planning, maintenance and operation policies should be evaluated [1], [7].
Several research has been conducted for planning in distribution networks considering georeferenced data, providing security and reliability at minimum cost with a coverage of 100% since it is mandatory to supply electricity to the totality of end customers [10], [11].
Georeferenced data can be obtained from OSM files, which contribute with information about location and functionality of essential facilities and systems serving a city. Electricity networks, roads, streets, residential and commercial buildings are acquired from georeferenced files. The aforementioned information is characterized in three forms nodes, ways and relations [12]. Nodes are the virtual representation of specific points on the Earth’s surface, which are expressed in its geographical coordinates (latitude and longitude), whilst ways are the computer-generated combination of nodes, which are well-arranged to form closed features such as buildings or non-closed features like a street section. Finally, the gathered data, which relates information among different objects is named relations [11], [13].
Set in this context, the present paper analyses the influence, impacts and assessment of proliferation of electrical vehicles into distribution networks. The main assets such as distribution transformers and cables are studied when unbalanced non-linear loads are connected to the distribution system. The rest of the present is structured as follows: Section II presents a description of the study case considering the EV model when it is connected to residential and commercial end users based on georeferenced data. Section III presents simulations performed in DIgSILENT PowerFactory, and a comprehensive asset assessment on distribution network is stated in Section IV followed by the conclusions drawn in Section V.
2. Case study and EV load model
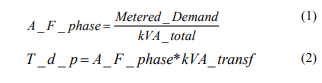
The present section focuses in a detailed model of the case study, where the network topology is based from georeferenced data. The loads data consider a period of time of 24 hours, then a peak and the lowest demand is analyzed. Additionally, EV and traditional loads are modelled considering unbalanced behaviors due to its natural features in distribution networks, see figure 1.
2.1 Case study based on OpenStreetMap (OSM) data
The topology of the selected distribution network is based on data from OSM files, where both closed and nonclosed features permit to reconstruct location of buildings, streets and revision boxes. Buildings and infrastructure represent to end customers, which can be divided in different categories or strata depending their electrical demand. The selected case study is composed
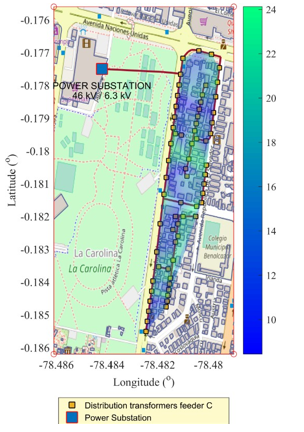
by 368 closed features, which are represented as end users (buildings), and 204 non-closed features which are related with roads, avenues and streets. Additionally, a recreational area is depicted where rapid charging stations and distributed generation will be modelled to determine the effect of by bi-directional load flows on their distribution transformers. Set in this context, the selected case study is located in one of the most profitable and commercial zones in Quito, the capital of Ecuador. Not only the central business district, but also luxury residential buildings, shopping centers and government institutions are located in this area. Consequently, the zone presents a higher urban density than the surroundings districts in Quito. Currently, more than one substation is needed to supply the enough electricity demand for the entire zone.
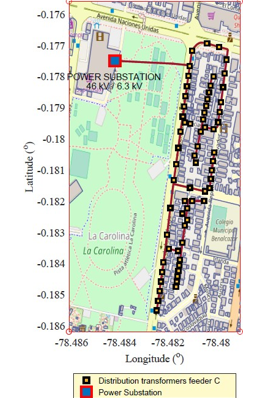
The chosen substation is connected to the sub transmission grid at a primary voltage level of 46 kV. It transfers down to the medium voltage level of 6.3 kV by
two power transformers connected in parallel with a capacity of 15/20 MVA each. The substation is not only comprised by switching and protection systems, but also control and energy management system is available, where control system permits the automatic connection and disconnection of the three underground outgoing feeders, which delivers electricity to a variety of residential and commercial customers via distribution transformers 6.3kV/220V/127V.
| Primary feeders | Distribution transformers | End users per primary feeder |
| Feeder A | 78 | 2208 |
| Feeder B | 31 | 1220 |
| Feeder C | 65 | 2240 |
| Feeder D | 68 | 738 |
| Total | 242 | 6406 |
The selected primary feeder is completely modelled considering all electrical equipment, whereas the rest of the substation feeders are modelled as lumped loads. As a consequence, the network modelling contemplates the quantity of distribution transformers, paths and lengths of underground cables, and the estimated demand consumed by customers. The selected primary feeder is based on radial and loop configurations with external interconnections (tie lines) with sufficient capacity to connect and transfer end-users between primary feeders providing flexibility and reliability under unusual circumstances. However, for the present paper the grid operates in normal conditions, where external interconnections are in open position and primary feeders are working radially. Table 1 shows main features of the selected scenario.
The customer’s demand in future years is based on transformer kVA demand allocation and a long-term forecasting. Load forecasting provides information for a proper decision in planning, investments, and usually load forecasting in the long-term is permanently affected by uncertain nature since there are several factors such as economy, weather, new policies, which can change the pattern of customer consumption. For the present a trend analysis is performed since it is based on historical data of power demand and its changes along the time, therefore predictions and future electricity demand can be determined [14].
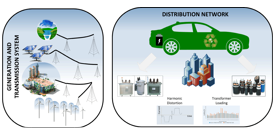
The transformer kVA demand allocation is a traditional and extensive method to model the customer electricity consumption when feeders are analyzed, and it uses the kVA demand per phase metered at the feeder head and the kVA rating of all distribution transformers connected to the feeder. Consequently, an allocation factor by phase is calculated using (1), and the allocated load per phase ( T _ d _ p ) in each transformer is determined by (2) [4].
2.2 EV load model
The EV penetration for coming years into distribution networks is influenced by economic and politic stimulus, technology advances, and EV commercialization. As a result of EV worldwide market has been rapidly growing in last 5 years due to the fact that the successful partnership between industry and governments [8]. The main effect of insertion of EVs considering a smart charging strategy is a considerable augmentation of electrical current circulating on distribution networks. The advantage of smart strategy is that the demand curve will be made more uniform, because the EV will be charged when the electrical demand is in the lowest value due to high communication level between the grid and vehicles by innovative supervision system controls, which manages all the EV loads connected into the distribution network. Nevertheless. It is possible that distribution networks face with EVs during peak hours due to the fact that customers have the liberty to link the vehicle to the grid, consequently they could inject or consume electricity increasing loading, losses in the power distribution system, see figure 2.
Set in this context, for the present, the charger points will represent an increment of load considering a utilization factor of 0.2, which represents that only 20% of EV are connected simultaneously to the different phases of the three phase distribution transformers along the feeder [15]. An arbitrary function defined by utilization factor, charging point capacity, pattern of vehicle usage, battery state of charge, and operation time are used to determine the EV load per hour per phase. In addition, the proposal analysis contemplates the installation of four rapid chargers in parking lots in the main avenue, which are fed by photovoltaic (PV) systems. The PV system has been designed to supply enough energy to its load, and the surplus is injected to the grid depending the solar variability. The benefits provided by vehicle to grid (V2G) are simulated, because that energy stored in low demand can be delivered to the grid during peak periods [16] [17].
An accurate analysis in distribution system considers the mathematical representation of steady state characteristics of distributed loads. The load model represents the relationship between the voltage magnitude, active and reactive power flowing into the bus load [18]. The load model provided by PowerFactory uses three polynomial terms to define active and reactive power as can be seen in equations (3) and (4). The load behavior is defined by some coefficients and exponents. The exponents specify the load type such as constant power, constant current and constant impedance, whilst the relative proportion of each load type is defined using the coefficients aP, bP, cP and aQ, bQ, cQ .
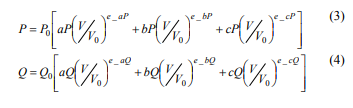
The selected values to represent a residential, commercial and EV loads are showed in table 2, and they are a compilation of suggested data from literature[18], [19]. EV load includes within its model a harmonic current source based on three-phase thyristor bridge converter and 12-pulse bridge converter, which represent the non-linear characteristic due to their power electronic components.
3. Simulation and results
Load model aforementioned for commercial, residential and EV load, in conjunction with the complete feeder’s model are the basis for electrical studies such as power flow, short-circuit and harmonic analysis to determine planning expansions, upgrades, refurbishments and investments. The present paper is focused in EV penetration to futures years, consequently unbalanced power flows analysis is mandatory to determine voltage levels in each distribution transformer, phase voltage unbalance and voltage drops on busbars, and also losses and loading in cables and transformers are calcualted. Furthermore, harmonic study is carried out to establish the effects in power quality due to the penetration of power converters in PV systems and EV loads. Consequently, a comprehensive and detailed electrical assessment of distribution network components can be performed.
3.1 Current status
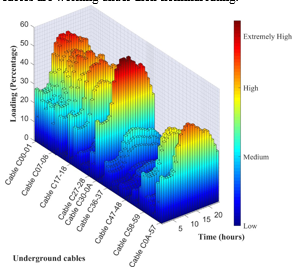
Power flow analysis in current conditions will establish the real state of the distribution equipment. The analysis is focused on busbar voltage levels, cables and transformer loading regarding the load profile, i.e. demand per hour. Power flows are calculated per hour, then 24 electrical studies are performed to establish the
condition of the distribution network during a normal day. Consequently, active and reactive power, voltages in each busbar, cable loading and other electrical parameters can be determined. Cable loading and losses can be estimated and represented as can be seen in figure 3 during a period of 24 hours. It is clear that cable C00-01, which is the connection between the main substation and the high voltage side of the distribution transformer number 1 is the most loaded (69%) since this cable conducts the entire feeder’s current. Another cable which has a loading over 50% is Cable C30-A, which is carrying a current for its customer’s load and other subsidiary transformers. Both aforementioned cables exhibit the major losses in the entire feeder because of their elevated currents, whilst the rest of underground cables are working under their nominal rating.
Distribution transformers are selected by utilities designers to operate within their nameplate ratings due to the fact that some contingency factors are consider for unplanned load growth. Current conditions of the selected network present an extensive number of distribution transformers, consequently the utilization factor is lower than 25%. This value gives an indication of how well the capacity of an equipment is being used, and it is calculated in based of the relationship of maximum kVA demand and the transformer kVA rating.
Consequently, distribution transformers are oversized as can be seen in figure 4, where it is depicted a heat map representing transformer loading. An oversized distribution transformer can ensure reliability during contingencies, however, constant and perpetual core losses, which depend upon the magnetic properties of distribution transformers are present during their service life.
3.2 Future conditions due to EV proliferation
Future conditions are based on the forecasted load growth, which is associated with addition of load by actual consumers and raise of end users in each transformer. In addition, electric vehicle penetration will be considered, so slow, medium and fast charging stations will be employed to analyze the grid.
3.2.1 Transformer assessment
Based on current conditions and also utility policies, it is clear that utilization factor for distribution transformers connected to the residential and commercial customers should be increased up tolerable values in the coming years by the addition of end users and EV loads to each transformer instead of increment the number of transformer along the feeder. Consequently, technical and economic resources can be reduced due to EV integration, reducing oil derivatives consumption on transport and electricity sector.
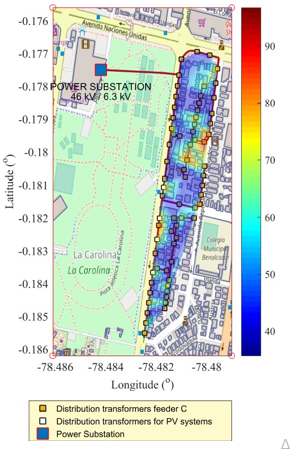
Figure 5 represent the loading of a distribution transformers due to the load growth and connection of residential and commercial (fast) charging points, where the consumption level or quantity of load required by EVs will depend on battery consumption. It is clear that consumption is associated with travelled distance by EV and thus the patterns of vehicle usage will have significant impacts on the operation times of chargers; and therefore the quantity of electricity demanded by EV will vary with this pattern.
Residential charging points are normally consuming energy from the grid in order to charge vehicles, however for this scenario vehicle to grid concept will be studied, where the battery of EV can storage energy, charging at night when demand is low, and sending power back to the grid when demand is high. Fast charging points and distributed generation are considered for this proposed scenario, then additional transformers (75 kVA) are selected to connect the fast charging station and the PV system to the main grid.
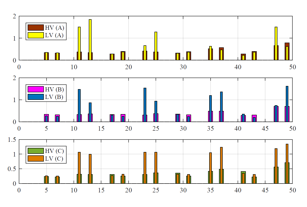
PV systems, fast and residential charger points are modelled considering their inverters (12-pulse inverter and 6-pulse inverter), consequently, circulation of fundamental current and its associated harmonics will cause an increase of heating in the iron core and conductors of the transformers. The loading increment and excessive non-linear currents accentuates the aging of the transformer since these currents produces hot-spot temperature of windings. The result of the accelerated aging could cause two problems, the first one is to leave to the distribution transformer with a weakness, which could fail as a result of a system transient or short-circuit, and the second one is related with the operating life reduction. Figure 6 represents the harmonic content in high voltage level and low voltage level per phase in one distribution transformer.
3.2.2 Busbar voltage assessment
A suitable analysis of distribution system should take into account the phase unbalance due to the fact that the majority of household are designed to operate with one single phase, consequently EV charger points will be connected with the available mains supply points at home and small buildings. The voltage unbalance in a three- phase system is defined as the ratio of the negative sequence component to the magnitude of the positive sequence component and its equation is expressed in (5).

Calculations of voltage unbalance at each busbar are obtained using (5) with the positive and negative sequence components from simulations on DIgSILENT PowerFactory. Voltage unbalance results are within the allowable range established by IEEE, where acceptable values for voltage unbalance should be lower than 3%. Table 3 shows the most significant busbars where the voltage unbalance is greater than 1% but lower than 3%.
| Busbar | Voltage nnbalance (%) |
| LV(48) | 1.749 |
| LV(49) | 1.008 |
| LV(39) | 1.420 |
| LV(18) | 1.751 |
| LV(28) | 1.475 |
| LV(54) | 1.340 |
| LV(59) | 1.015 |
3.2.3 Underground cable assessment
The increment of EV load is associated with the increment of currents circulating along the feeder, so the coincidence between charging time and peak hours, could cause the overload of cables, and thus accelerating the normal degradation of them. However, the main issue is related with harmonics, since the non-linear current circulating inside conductor produces a non-uniform current distribution due to the excessive skin and proximity effects. Additionally, third harmonic and its multiples cause disproportionate high currents on the neutral conductor. Within this background, circulation of harmonic in the grid origins the premature deterioration of cables and the derating of cable capacity due to the conductor’s overheating.
4. Conclusions
The present paper is performed to determine the main effects in a distribution system when non-linear loads are connected to the grid. The distribution network is modelled in detail considering the unbalanced residential and commercial loads due to the customer’s consumption in each distribution transformer based on the kVA demand allocation method. Simulations are performed in DIgSILENT PowerFactory. Results shows that an uncontrolled charging method could cause cables overloading and raising of voltage drops among some negative effects to the distribution system. However, this can be fixed throughout an Energy Management System EMS), which could coordinate the EV charge when the demand is low and injecting power to the grid during peak hours, and thus achieving valley filing, peak shaving and avoiding voltage unbalance.
Future research should be the maximum number of EV connected to the grid considering statutory limits associated with voltage unbalance, harmonics, loading and voltage drops minimizing the system operation cost.
References
[1] H. Kheradmand-Khanekehdani and M. Gitizadeh, “Well- being analysis of distribution network in the presence of electric vehicles,” Energy, vol. 155, pp. 610–619, 2018.
[2] J. Delgado, R. Faria, P. Moura, and A. T. de Almeida, “Impacts of plug-in electric vehicles in the portuguese electrical grid,” Transp. Res. Part D Transp. Environ., vol. 62, pp. 372–385, 2018.
[3] J. Meza and E. García, “Asignación de recursos para la recarga de vehículos eléctricos en estaciones de servicios basado en la respuesta a la demanda,” Rev. I+D tecnológico, vol. 14, no. 2, 2018.
[4] A. Valenzuela, I. Montalvo, and C. Barrera-singaña, “Electrical Vehicle: Facing Future Challenges in Quito,” 2017.
[5] C. Barrera-singaña, A. Valenzuela, and M. P. Comech, “Dynamic Control Modelling of a Bipole Converter Station in a Multi-Terminal HVDC Grid,” 2017 Int. Conf. Inf. Syst. Comput. Sci., 2017.
[6] E. M. Garcia, B. D. B. Lopez, and I. A. I. Millan, “Analysis of the Voltage Profile by the Insertion of Electric Vehicles in the Distribution Network Considering Response to Demand,” 2017 Int. Conf. Inf. Syst. Comput. Sci., pp. 7–13, 2017.
[7] A. Temiz and A. N. Guven, “Assessment of impacts of Electric Vehicles on LV distribution networks in Turkey,” 2016 IEEE Int. Energy Conf. ENERGYCON 2016, 2016.
[8] J. H. Wesseling, “Explaining variance in national electric vehicle policies,” Environ. Innov. Soc. Transitions, vol. 21, pp. 28–38, 2016.
[9] A. Ul-Haq, C. Cecati, and E. El-Saadany, “Probabilistic modeling of electric vehicle charging pattern in a residential distribution network,” Electr. Power Syst. Res., vol. 157, pp. 126–133, 2018.
[10] S. A. Miloca, N. M. P. Volpi, J. Yuan, and C. L. S. Pinto, “Expansion planning problem in distribution systems with reliability evaluation: An application in real network using georeferenced database,” Int. J. Electr. Power Energy Syst., vol. 70, pp. 9–16, 2015.
[11] W. Medjroubi, U. P. Müller, M. Scharf, C. Matke, and D. Kleinhans, “Open Data in Power Grid Modelling: New Approaches Towards Transparent Grid Models,” Energy Reports, vol. 3, pp. 14–21, 2017.
[12] A. Alhamwi, W. Medjroubi, T. Vogt, and C. Agert, “GIS- based urban energy systems models and tools: Introducing a model for the optimisation of flexibilisation technologies in urban areas,” Appl. Energy, vol. 191, pp. 1–9, 2017.
[13] A. Alhamwi, W. Medjroubi, T. Vogt, and C. Agert, “OpenStreetMap data in modelling the urban energy infrastructure: A first assessment and analysis,” Energy Procedia, vol. 142, pp. 1968–1976, 2017.
[14] L. Ghods and M. Kalantar, “Different methods of long-term electric load demand forecasting; a comprehensive review,” Iran. J. Electr. Electron. Eng., vol. 7, no. 4, pp. 249–259, 2011.
[15] X. Tong, C. Guo, X. Yang, and C. Chen, “Research on Characteristics of Electric Vehicle Charging Load and Distribution Network Supportability,” 2016 IEEE Asia- Pacific Power Energy Conf., pp. 1539–1542, 2016.
[16] S. Pirouzi, J. Aghaei, T. Niknam, and H. Farahmand, “Exploring prospective bene fi ts of electric vehicles for optimal energy conditioning in distribution networks,” Energy, vol. 157, 2018.
[17] V. T. Tran, D. Sutanto, and K. M. Muttaqi, “The state of the art of battery charging infrastructure for electrical vehicles: Topologies, power control strategies, and future trend,” 2017 Australas. Univ. Power Eng. Conf., pp. 1–6, 2017.
[18] A. Bokhari et al., “Experimental determination of the ZIP coefficients for modern residential, commercial, and industrial loads,” IEEE Trans. Power Deliv., vol. 29, no. 3, pp. 1372–1381, 2014.
[19] E. Sortomme, A. I. Negash, S. Member, S. S. Venkata, L. Fellow, and D. S. Kirschen, “Multistate Voltage Dependent Load Model of a Charging Electric Vehicle,” 2012 IEEE Transp. Electrif. Conf. Expo, no. 1, pp. 4–8, 2012.