

Original Articles
Are GPUs Non-Green Computing Devices?
¿Son las GPUs dispositivos eficientes energéticamente?
Are GPUs Non-Green Computing Devices?
Journal of Computer Science and Technology, vol. 18, no. 2, 2018
Universidad Nacional de La Plata
Received: 11 May 2018
Revised: 09 August 2018
Accepted: 13 August 2018
Abstract: With energy consumption emerging as one of the biggest issues in the development of HPC (High Performance Computing) applications, the importance of detailed power-related research works becomes a priority. In the last years, GPU coprocessors have been increasingly used to accelerate many of these high-priced systems even though they are embedding millions of transistors on their chips delivering an immediate increase on power consumption necessities. This paper analyzes a set of applications from the Rodinia benchmark suite in terms of CPU and GPU performance and energy consumption. Specifically, it compares single-threaded and multi-threaded CPU versions with GPU implementations, and characterize the execution time, true instant power and average energy consumption to test the idea that GPUs are power-hungry computing devices.
Keywords: Power, Rodinia, GPU, NVML, RAPL.
Resumen: Con el consumo de energía emergiendo como uno de los mayores problemas en el desarrollo de aplicaciones HPC (High Performance Computing), la importancia de trabajos específicos de investigación en este campo se convierte en una prioridad. En los últimos años, los coprocesadores GPU se han utilizado frecuentemente para acelerar muchos de estos costosos sistemas, a pesar de que incorporan millones de transistores en sus chips, lo que genera un aumento considerable en los requerimientos de energía. Este artículo analiza un conjunto de aplicaciones del benchmark Rodinia en términos de rendimiento y consumo de energía de CPU y GPU. Específicamente, se comparan las versiones secuenciales y multihilo en CPU con implementaciones GPU, caracterizando el tiempo de ejecución, la potencia real instantánea y el consumo promedio de energía, con el objetivo de probar la idea de que las GPU son dispositivos de baja eficiencia energética.
Palabras clave: Potencia, Rodinia, GPU, NVML, RAPL.
1. Introduction
The computing scenario has changed substantially since the introduction of accelerators, particularly GPGPU (short for general purpose computing on graphics processing units). Therefore, the number of devices with GPUs and the amount of GPU accelerated applications increased more and more over the past years.
These devices have drawn the attention of the HPC research community because they have a great computational power next to a high memory bandwidth and are formidably suited for massively data parallel computation (Single Instruction Multiple Threads applications). Coming along with these features, the energy consumption of GPU containers like high performance workstations and personal computers became a real problem [1][2]. Some direct consequences of its higher power consumption are growing dissipation of heat, more complex cooling solutions, and noisier fans [3].
As a result, power dissipation must be reduced without losing computing performance. Further, the peak power of latest Nvidia and AMD GPUs is as high as 300W, while a typical CPU consumes only 80W at Thermal Design Power (TDP). This does not indicate that the GPU has lower energy efficiency since the increasing advantage in performance can offset the larger power consumption [4][5]. For instance, in the June 2018 Green 500 ranking, 7 of 10 top computer systems incorporate Nvidia accelerators. However, in this supercomputers list is not possible to isolate the power consumed by the accelerators.
Historically, GPGPU researching has focused primary on accelerating scientific applications [6] such as physical simulations, medical analysis, image and video processing. This work does not accelerate a HPC algorithm, but it makes a description of performance, power and energy consumption of CPU and GPU computing devices.
Generally, the energy quantification process relies on two approaches: hardware-based and software-based measurement. In first, a physical measuring device is attached between the power supply and the many-core device. Then, the electrical power can be computed by multiplying current and voltage. Also, energy consumption can be determined by integrating the power over total execution time [7]. On the other hand, latest high-end Nvidia GPUs provide the possibility to read the current power consumption by software through the Nvidia Management Library (NVML) [8]. In addition, Intel CPUs present a set of counters providing energy and power consumption information through Running Average Power Limit (RAPL) software.
This work analyzes a set of applications from the Rodinia benchmark suite [9], a collection of parallel programs developed to evaluate the performance of heterogeneous computing. These applications have been implemented for both GPUs and multicore CPUs using CUDA and OpenMP.
Specifically, the experiments compare serial CPU versions with multithreaded CPU versions and with GPU versions, where the computation runs exclusively on the accelerator. Performance, instant power, and energy consumption are evaluated.
The rest of the paper is organized as follows. Section 2 presents the background for the proposed work. Sections 3, 4 and 5 describe the targeted experiments as well as main performance and power results. Finally, Section 6 makes a brief conclusion of obtained data.
2. Background
This section presents some background material in order to put the research in perspective, particularly a Rodinia benchmark summary, a brief review of power consumption approaches and a description of the measurement system.
2.1. Rodinia suite
Rodinia is a set of benchmark applications designed for heterogeneous computing environments including both multi-core CPUs and GPUs using three different parallel programming models such as OpenMP [10], CUDA and OpenCL. To provide a high-level abstraction of common computing, memory access and communication patterns, each application is classified according to the Berkeley’s dwarf taxonomy [11].
Rodinia’s applications adopt an “offloading” model which assumes that accelerators use a memory space disjoint from main memory. Again, the benchmark suite provides a set of applications from which it may be relatively hard for compilers to automatically generate accelerator code [12].
Rodinia has 19 applications which cover 6 different dwarves. The experiments target the serial, OpenMP and CUDA parts of the benchmark suite. To cover all behaviors, this work analyzes 6 Rodinia applications, each one with a different Berkeley dwarf. Table 1 shows the applications along with their corresponding dwarves.
| Application | Dwarf | Domain |
| PathFinder | Dynamic Programming | Grid Traversal |
| SRAD | Structured Grid | Image Processing |
| BFS | Graph Traversal | Graph Algorithms |
| LavaMD | N-Body | Molecular Dynamics |
| CFDSolver | Unstructured Grid | Fluid Dynamics |
| LUD | Dense Linear Algebra | Linear Algebra |
PathFinder is a dynamic programming algorithm for solving the shortest path problem. The goal is to find the shortest path of a 2D grid, row by row, by choosing the smallest accumulated weights. Each node picks a neighboring node in the previous row that has the smallest accumulated weight and adds its own weight to the sum.
Speckle Reducing Anisotropic Diffusion (SRAD) is a diffusion algorithm based on partial differential equations and used for removing the speckles (locally correlated noise) in an image maintaining as much as possible important image features. SRAD is commonly used in radar and ultrasonic imaging applications.
Breadth-First Search (BFS) is a graph algorithm for traversing all the connected components in the data structure. It starts at the tree root (or some arbitrary node) and explores the neighbor nodes first, before moving to the next level neighbors. BFS is widely used in scientific and engineering applications.
LavaMD is an algorithm to study the physical movements of atoms and molecules. It calculates particle potential and relocation due to mutual forces between particles in a 3D space. This space is divided into cubes, or large boxes, that are allocated to individual cluster nodes. The large box at each node is further divided into cubes, called boxes.
CFD Solver is an unstructured-grid, finite-volume solver for the three-dimensional Euler equations for compressible flow. It has an advantage over other solvers in memory usage and solution speed, especially for large problems.
LU Decomposition (LUD) is an algorithm to calculate the solutions of a set of linear equations. The LUD kernel factors a matrix as the product of a lower triangular matrix and an upper triangular matrix. LUD can be viewed as the matrix form of Gaussian elimination.
2.2. Power monitoring approach
The power consumption measurement can be carried out in two different ways.
Firstly, a hardware-oriented solution, where an additional power capable device is attached between the computational equipment and the power supply. This method consists on sampling electrical current while voltage remains constant. However, voltage could be eventually measured by clamp probes. Then, power is computed by multiplying the two signals, and total energy is calculated as the integral of the power over the execution time. This approach might lead to significant errors caused by clamp sampling variations and instant power approximation (by multiplication means).
This hardware technique can be invasive or not. In the invasive way, power consumption is measured interfering the power supply lines generally through direct current sensors (Hall Effect). In contrast, an extern system measurement can be carried out by intercepting the power supply input through alternating current and voltage tools.
On the other hand, energy consumption could be supervised across special software interfaces. In this case, real time power information could be accessed through built-in on-board sensors or by a specific power estimation model. In this last approach, the power scheme is fueled by hardware counters data.
This work employs a software measurement approach, where CPU power consumption is monitored through Intel RAPL interface and GPU power information is gathered using Nvidia NVML.
RAPL provides a set of counters producing energy and power consumption information. It uses a software power model that estimates energy usage by querying hardware performance counters and I/O models [13] and results are available to the user via a model specific register (MSR). This power model has been validated by Intel in [14].
NVML is an API for monitoring and managing different Nvidia GPUs features like the ability to set/unset ECC (Error Correction Code), or to monitor memory usage, temperature, utilization rates, and more. Also, this library provides the ability to query power consumption at runtime through the built-in power sensor.
2.3. Power measurement system
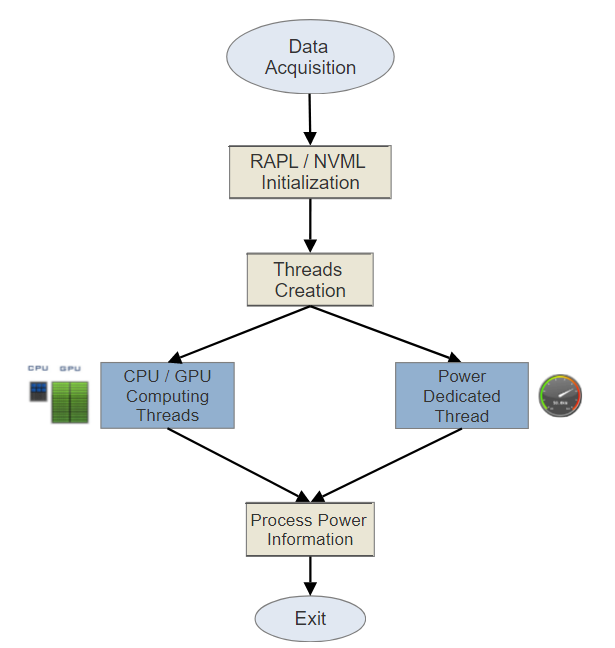
For all implementations the measuring method consists on: running the computational algorithm in one/multiple threads and the RAPL/NVML code in another thread using Pthreads, which provides negligible overhead.
Then, the only communication between the power measuring threads and computational threads is a flag variable. Furthermore, power readings are stored in a global structure. Finally, RAPL and NVML threads stop when the shared flag is reset, which is when the CPU/GPU finalize its execution. This brief description is portrayed in Fig. 1.
Besides, a critical parameter to define is the power sampling interval. Some previous research works on GPU power consumption have focused on this point. Lang and Rünger et al. [7] shows that the optimal NVML sampling frequency is 50Hz (20ms). In contrast, Burtscher et al. [15] demonstrates that the maximum frequency supported by hardware is 66.7Hz (15ms). In addition, Kasichayanula et al. [1] and Weaver et al. [16] recommends a sampling frequency of 62.5Hz (16ms).
This paper uses a NVML (GPU) and RAPL (CPU) sampling frequency of 62.5Hz. Therefore, a power measurement tool is written to query the GPU sensor via NVML interface and to obtain estimated CPU power data through RAPL.
It is also necessary to mention that NVML power information refers to whole GPU board, including DC voltage converters, integrated circuits like video chip and bridge, memories, etc. The returned value is accurate to within a range of +/- 5 milliwatts. However, Intel RAPL provides entire CPU package power data (including cores, uncore circuit and DRAM memory) with +/- 1 milliwatt precision.
Generally, power consumption of commercial CPUs and GPUs can be described as the sum of static power, dynamic power and the impact of ascending temperature. Thus,
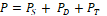 [Eq. 1]
where PS is static power, PD is dynamic power and PT is the temperature effect on power. Static power depends on chip layout and circuit technology, and it is independent of workload execution. Dynamic power results from transistors switching overhead. Heat also has an impact on power due to transistors current leakage increases with temperature [17].
In this work, static power is measured when no workload is executed and while none of the CPU and GPU resources are turned off. Furthermore, temperature contribution is considered negligible because of GPU algorithms execute in a few seconds. Despite CPU code runs a longer time, the measured temperature does not increase significantly. Finally, as dynamic power depends on the specific workload to be processed, it is the chosen variable to analyze in results section.
Whereas other related works analyze the power dissipated by the whole system [18][19][20], this paper isolates each computing device (CPU and GPU) from the system, characterizing the true instant power and total energy consumption. This approach allows to minimize recurring measurement errors caused by inefficiencies in the power supply and also by the energy contribution of different devices in the system.
3. Target platform
The hardware platform includes a computing server with an Intel Core i7-7700 (7th gen.) processor with an 8MB cache and 4 physical cores (8 threads) at 3.60GHz. This processor is attached to a Gigabyte GA-Z270X-G5 motherboard, which additionally holds an 16GB RAM memory. The server also contains a Nvidia Tesla C2075 scientific computing GPU equipped with 14 multiprocessors including 32 CUDA cores each (448 total cores) and a 6GB GDDR5 global memory.
Moreover, the software configuration includes a 64-bit Ubuntu distribution (Linux kernel 3.2.0) with Nvidia Driver v331.62 and CUDA Toolkit 6.0.
4. Experimental setup
As mentioned before, this work analyzes 6 Rodinia applications, each one with a different Berkeley dwarf. The serial, OpenMP and CUDA side of the benchmark are targeted to characterize the execution time, true instant power and average energy consumption.
To get accurate timing, the algorithm averages the results of five runs for all cases. Moreover, as PathFinder and LavaMD execution times are too short, these applications are run in a ten times loop.
Table 2 illustrates the targeted applications with their corresponding input size.
| Application | Data size | Multipleruns? |
| PathFinder | 1.000.000 x 200 data points, pyram. height = 10 | 10x |
| SRAD | 8.192 x 8.192 data points | - |
| BFS | 16.000.000 nodes | - |
| LavaMD | 103 = 1.000 boxes | 10x |
| CFD Solver | 97.000 elements | - |
| LUD | 8.000 x 8.000 data points | - |
To increase performance, both CPU versions are compiled with gcc/g++ O2 optimization flag. For detailed information, see [21]. Furthermore, GPU algorithms are compiled with Nvidia nvcc tool.
Serial version
Multithreaded version
GPU version
5. Experimental results
This section introduces the GPU speedup and some power related measurements like instant dynamic power (load dependent observed power), total measured power and total energy consumption.
As explained in measurement section, total power fluctuation associates directly with dynamic power variation. Table 3 shows static, dynamic and total average power for PathFinder application. As mentioned, temperature impact is considered negligible in this work.
| CPU | GPU | |
| Static | 4,01 | 76,82 |
| Dynamic | 23,93 | 63,69 |
| Total | 27,94 | 140,51 |
Static power measurements correspond with CPU and GPU idle state and it is almost constant for all experiments. Then, dynamic values vary depending on the specific workload.
So as to calculate and display dynamic power data, this work uses the measured static power values shown above: 4,01W for the Intel i7 CPU and 76,82W for the Nvidia Tesla GPU. These numbers are the zero reference for CPU and GPU dynamic power plot.
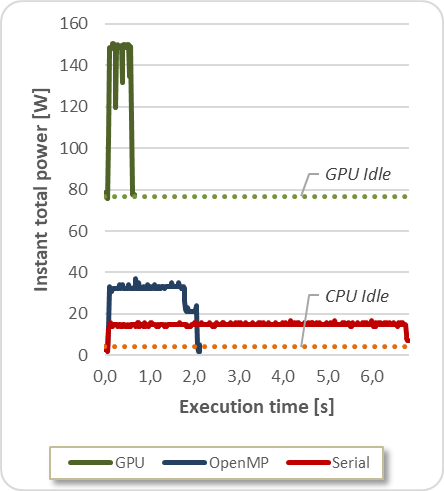
Fig. 2 presents the execution time and instant dynamic power for PathFinder application.
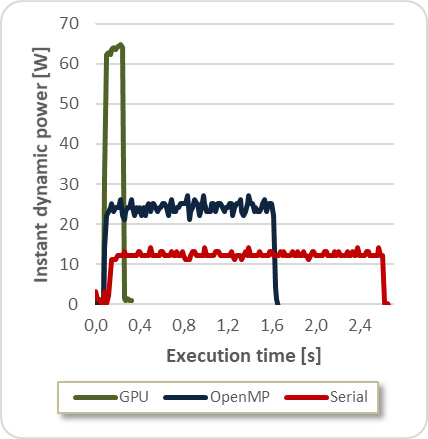
As shown in the graph, the zero reference (idle state) represents beginning and end of algorithm execution for all cases. Notice that the serial versions correspond to less power consumption while the multithreaded version raises this value. Moreover, the GPU implementation presents a huge difference in power consumption regarding serial and OpenMP versions.
In contrast, GPU execution time is minimal compared to CPU versions. Fig. 3 introduces the speedup of each CUDA implementation running on the GPU relative to serial and OpenMP implementations running on the multicore CPU.
To achieve speedup calculation, the execution time is measured on the CPU and GPU for the core part of the computation (excluding setup).
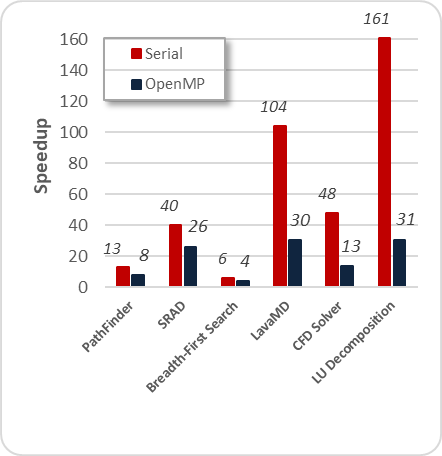
The speedups range from 4 to 31 over the multi-threaded CPU implementations and from 6 to 161 over the single-threaded CPU implementations.
Even though the generation difference between the Intel i7 and the Tesla C2075 is huge, the achieved speedups are considerable.
Most of the performance diversity results from the different application characteristics implicit in the benchmark suite (Berkeley dwarves). In particular, compute-bound applications like LU Decomposition, LavaMD, CFD Solver and SRAD reach higher acceleration than applications presenting complex behaviors. In this case, PathFinder and Breadth-First Search algorithms implemented through CUDA are extremely dependent on the off-chip memory (poor bandwidth) and utilize uncommon data structures. In all cases, the Rodinia OpenMP implementation outperforms serial version.
Although it is necessary to analyze dynamic power consumption (Fig. 2), it is also significant to present and evaluate total power consumption, that means, static and dynamic power behavior.
In this case, Fig. 4 displays LavaMD total power consumption and execution time.
As shown, the remaining gap between GPU and CPU solutions increases when total power consumption is introduced. This is because GPU power consumption on idle state is extremely higher than the CPU one (dotted lines).
Having exposed power measurements and total execution time, the average energy consumption can be presented. This metric is computed by multiplying average power consumption (static + dynamic) over total execution time.
Fig. 5 shows the average energy consumption for all experiments.
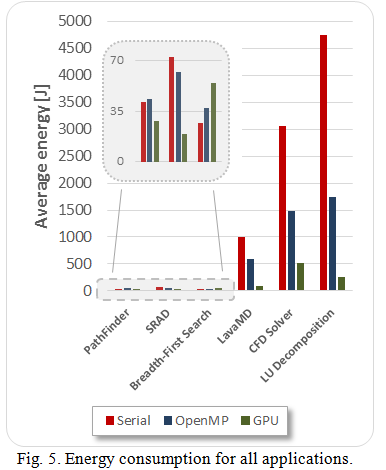
Nearly all the evaluated applications present a significant decrease in energy consumption when the GPU acceleration is applied. Compute-intensive algorithms like LU Decomposition, LavaMD, CFD Solver and SRAD exhibit a serious difference between serial, multithreaded and GPU implementations in terms of energy consumption. The energy boost ranges from 2.8 to 6.8 over the multi-threaded CPU implementations and from 3.7 to 18.7 over the single-threaded CPU implementations.
However, PathFinder and Breadth-First Search applications do not perform in the same way. In first, GPU outperforms CPU implementations, but the energy speedup is negligible. On the other hand, the Breadth-First Search algorithm shows that GPU utilization does not improve energy efficiency. In both cases, the serial algorithm delivery a smaller energy consumption regarding the multi-threaded implementation.
6. Conclusion and future work
This article presents some measurements and a detailed analysis of the performance and energy consumption of an application set from the Rodinia benchmark suite. The algorithms were carefully selected following the Berkeley dwarves to represent all the diverse behaviors implicit in the suite.
The experimental results show that GPU-accelerated code can outperform CPU single and multi-threaded programs in terms of performance and total energy consumption in almost all cases. Despite GPU observed power is huge, applications can finish faster, so the total energy consumption is notably less than CPU versions. This debunk the idea that this kind of accelerators are non-green computing devices.
Essentially, compute-bound dwarves like particle dynamics, grids and linear algebra benefit more from GPU acceleration than a dynamic programming algorithm like PathFinder. Further, only the Graph traversal dwarf exhibits a degradation in energy efficiency when using the accelerator.
In future work, it would be useful to combine software-based power data with physical measurements directly from CPU and GPU. Therefore, this accurate information merged with performance counters data can be the starting point to design a new model to predict CPU and GPU power consumption.
References
[1] K. Kasichayanula, D. Terpstra. “Power Aware Computing on GPUs”. In: Symposium on Application Accelerators in High Performance Computing, pp. 64-73, 2012.
[2] X. Mei, Q. Wang, X. Chu. A survey and measurement study of GPU DVFS on energy conservation. Digital Communications and Networks, vol. 3, no. 2, pp. 89-100, 2017.
[3] X. Ma, M. Dong, L. Zhong, Z. Deng. “Statistical Power Consumption Analysis and Modeling for GPU-based Computing”. In: HotPower ACM SOSP Workshop Power Aware Computing and Systems, pp. 1-5, 2009.
[4] H. Nagasaka, N. Maruyama. “Statistical Power Modeling of GPU Kernels Using Performance Counters”. In: International Conference on Green Computing, pp. 115-122, 2010.
[5] R. Suda, Da Qi Ren. “Accurate Measurements and Precise Modeling of Power Dissipation of CUDA Kernels toward Power Optimized High Performance CPU-GPU Computing”. In: International Conference on Parallel and Distributed Computing, Applications and Technologies, pp. 432-438, 2009.
[6] S. Huang, S. Xiao, W. Feng. “On the energy efficiency of Graphic Processing Units for scientific computing”. In: IEEE Symposium on Parallel & Distributed Processing, pp. 1-8, 2009.
[7] J. Lang, G. Rünger. “High-Resolution Power Profiling of GPU Functions Using Low-Resolution Measurement”. In: Euro-Par 2013 Parallel Processing Lecture Notes in Computer Science vol. 8097, Springer, pp. 801–812, 2013.
[8] NVML Reference Guide, http://docs.nvidia.com/deploy/nvml-api/index.html. Accessed on 2018-04-13.
[9] S. Che, M. Boyer, J. Meng, D. Tarjan, J. W. Sheaffer, S. Lee, K. Skadron. “Rodinia: A benchmark suite for heterogeneous computing”. In: IEEE International Symposium on Workload Characterization (IISWC), pp. 44-54, 2009.
[10] OpenMP Application Programming Interface, http://www.openmp.org/wp-content/uploads/openmp-4.5.pdf. Accessed on 2018-04-13.
[11] 10 K. Asanovic et al. “The landscape of parallel computing research: A view from Berkeley”. Technical Report UCB/EECS-2006-183, EECS Department, University of California, Berkeley, pp. 56-67, 2006.
[12] S. Che, J. W. Sheaffer, M. Boyer, L. G. Szafaryn, L. Wang, K. Skadron. “A characterization of the Rodinia benchmark suite with comparison to contemporary CMP workloads”. In: IEEE International Symposium on Workload Characterization (IISWC), pp. 1-11, 2010.
[13] Running Average Power Limit – RAPL, https://01.org/blogs/2014/running-average-power-limit-%E2%80%93-rapl. Accessed on 2018-04-13.
[14] 13 E. Rotem, A. Naveh, D. Rajwan, A. Anathakrishnan, E. Weissmann, “Power-management architecture of the Intel microarchitecture codenamed Sandy Bridge”. In: IEEE Micro, vol. 32, no. 2, pp. 20–27, 2012.
[15] M. Burtscher, I. Zecena, Z. Zong. “Measuring GPU Power with the K20 Built-in Sensor”. In: GPGPU-7 Proceedings of Workshop on General Purpose Processing Using GPUs, pp. 28-36, 2014.
[16] V. Weaver, M. Johnson, K. Kasichayanula, J. Ralph, P. Luszczek, D. Terpstra, S. Moore. “Measuring Energy and Power with PAPI”. In: 41st International Conference on Parallel Processing Workshops, pp. 262-268, 2012.
[17] D. Li, S. Byna, S. Chakradhar. “Energy-Aware Workload Consolidation on GPU”. In: 40th International Conference on Parallel Processing Workshops, pp. 389-398, 2011.
[18] Y. Zhang, Y. Hu, B. Li, L Peng. “Performance and power analysis of ATI GPU: A statistical approach”. In: 6th IEEE International Conference on Networking, Architecture and Storage (NAS), pp. 149-158, 2011.
[19] Y. Abe, H. Sasaki, S. Kato, K. Inoue, M. Edahiro, M. Peres. “Power and performance characterization and modeling of GPU-accelerated systems”. In: 28th IEEE International Parallel and Distributed Processing Symposium, pp. 113-122, 2014.
[20] J. Chen, B. Li, Y. Zhang, L. Peng, J. K. Peir. “Tree structured analysis on GPU power study”. In: 29th IEEE International Conference on Computer Design (ICCD), pp. 57-64, 2011.
[21] GCC Command Options: Options That Control Optimization, https://gcc.gnu.org/onlinedocs/gcc-4.6.2/gcc/Optimize-Options.html. Accessed on 2018-04-13.
Additional information
Cómo citar: M. Pi Puig, L.
De Giusti and M. Naiouf. “Are GPUs
Non-Green Computing Devices?”, Journal of Computer Science &
Technology, vol. 18, no. 2, pp. 153-159, 2018.

