Poverty in the Colombian Atlantic Region. A New Dimension for your Analysis
Introduction
The determination of subjective poverty is a theme proposed in recent years that provides a significant relevance to the perception that a person has about its well-being, quality of life and level of happiness. Thus, this approach offers a complementary analysis to the objective measures that are generally used as lines of poverty and indigence, Unsatisfied Basic Needs, index of living conditions, etc., offering a broader view for the structuring and application of policies that look forward to reduce this problem.
The objective of this research is to determine the causes of subjective poverty and establish income poverty at national and regional levels, focusing on the Atlantic region, establishing the main variables that determine this condition of poverty.
The document establishes the self-perceptions individuals have regarding poverty at national level and specifically for the Atlantic region since it presents wide gaps in economic development, which is reflected on the fact that the region has high multidimensional poverty indexes compared to other regions of the country.
Theoretical aspects and concepts that define multidimensional poverty versus one-dimensional poverty
In the economic sphere, one-dimensional or monetary poverty is based on using the monetary income as an approximation of the economic wellbeing of the population. This type of measurement is based on establishing a threshold that would represent a minimum income to have access to a basket of goods. It is contrasted with the income in family groups in order to identify the population that has least access to basic needs, taking into account that the basket of goods and services can be acquired.
A second approach proposed by Alkire & Foster (2007) proposes a way to classify the poor using deprivation and a single dimension that summarizes an aggregate indicator. In the same way, there is a minimum threshold for calculating the deprivations of such dimensions, where they usually become typical features of a multidimensional or multidimensional approach.
The multidimensional methodology seeks to measure poverty from another approach, taking as a basis a form of classification outside of, which includes determinants such as decomposability and the method of intersection and union, which is commonly used, is left aside. The need to choose the different factors was generated, which despite being combined and establishing minimum thresholds in the indicators are not integral to encompass the subjective measures in which poverty is found.
Among the authors who study poverty are Aguado Quintero and Osorio Mejía (2006), who formulate a series of questions to conduct a survey, which analyzes poverty from the subjective point of view and which is intended to cities of Colombia and Latin America. In the book “Subjective Perception of the Poor: An Alternative to the Measurement of Poverty”, we have already analyzed the measures, approaches and methods for the establishment and determination of poverty, a series of questions that have been posed by different authors for the measurement of subjective poverty. These include the Minimum Income Question (MIQ), proposed by Pradhan & Ravallion (1997), which basically evaluates what an individual earns and how much it spends, evaluating in this way the minimum income necessary to meet basic needs. However, as a result of these questions, relative results are observed, since they have the same amount of income as those evaluated differently. Reflecting on the calculation of poverty lines that define as poor any individual who has an income below the threshold established by this question. In this poverty field, the focus of Pradham and Ravallion (1998) is highlighted, where they determine this poverty with simple qualitative assessments of the adequacy of consumption in household surveys, which present information on food consumption, housing tenure, clothing and chores. With this he evaluates if these factors satisfy the needs of the family. The estimate that is based on an economic concept of income as the maximum consumption, is usually constructed from many questions of the survey; no household survey would attempt to obtain their income estimate from a single question. Similary, Pradham and Ravallion say that some respondents will perceive that they have a lower income than they really have. For example, it may include cash income, excluding imputed homeownership income or self-produced activities. Some include the sale of assets or ignore certain production costs, overestimating their real income.
From a conceptual point of view, subjective poverty, the subjective perception of deprivation. Two approaches can be distinguished in the definition of subjective poverty. The first test is generally considered poor, and the second is defined by collecting self-perceptions about its own position in a system of inequalities. This allows us to infer that there must be more subjective determinants for the measurement of poverty and not only be based on poverty due to incomes and Unsatisfied needs, but also to evaluate the fact that the person feels poor or not and establishing a line which Ravallion calls ‘’ The social subjective poverty line ‘’. Although there are shortcomings in this subjective approach such as the choice of covariates, the problems of survey design, measurement errors, the effects of frame of reference and the late heterogeneity in personality traits (Ravallion, 2012), it is necessary to evaluate poverty from a subjective point of view.
Methodology
This document will have a mixed methodology, where the first section will analyse a qualitative description of the different types of poverty calculation applied in Colombia in all its fields. Additionally, a quantitative analysis will be used, taking as an example the Dane National Quality of Life Survey (ENCV) from 2011 to 2015. The National Quality of Life Survey is conducted by Dane in order to collect research on household welfare from its different aspects and dimensions including factors that allow for the analysis of different levels of life of society taking into account aspects such as access to capital and public services, private or collective, health, education, others.
For the present project, a model of the Logit type will be used, which seeks to establish the self-perceptions that individuals have regarding poverty and also to determine the variables with the greatest weight within that perception. The Logit model considers a dependent variable that is not quantitative, that is, it does not have a specific value, but it is qualitative, and it is encoded by means of digits or categories. This logistic regression model is more appropriate than the PROBIT model, which is restrictive when considering a single variable to explain the existence of some phenomenon. In the case under study, the interpretation of the effects that result when the variables change numerically or from one category to another is needed.
Characterization of the Atlantic Region
This research was developed around the Atlantic Region (made up of the departments of Atlántico, Bolívar, Cesar, Córdoba, Sucre, La Guajira and Magdalena) because at country level it is one of the regions with the most economic development health and educational gaps, which is reflected in the fact that the region has high multidimensional poverty rates compared to the national level, with the departments of La Guajira and Córdoba presenting the most worrisome figures as described in later sections, although it should be noted that the Inequality consistent with the Gini coefficient has decreased and is presented in proportions smaller than the national. As it has particular characteristics unlike the rest of the regions, such as the fluvial connections with the rest of the country, provisions of major water sources, these characteristics allow the economic activities related to international trade to be developed in the region: tourism, transport and logistics services, the petrochemical industry, agro-industry and mining.
Poverty and inequality in the region
The region has been characterized as one of the poorest in the country, and concentrates two of the departments with the highest monetary and multidimensional poverty rates at national level, such as La Guajira and Sucre. However, the entire region presents poverty indicators in critical condition and higher than the national average, except for the measure of inequality (Gini coefficient), where it is below national average.
One of the most relevant indicators, such as the Unsatisfied Basic Needs, is of a critical level in the region, mainly in the components of housing, overcrowding and economic dependence.
In this section, different measures of poverty are presented at national, regional and departmental levels.
Different definitions of poverty
The concept of poverty is and has been an ambiguous concept throughout history since it can be approached from several particular approaches and interpretations, although it is always related to concepts of deprivation, needs, subsistence, disabilities, inequality, etc. Poverty as an aspect of the inequality of individuals can not be understood without the concept of income or wealth. The definition of poverty throughout the literature has had two approaches: the absolute and the relative, by the first is understood the needs are independent of the wealth of other people and can not be satisfied, implies poverty condition; the second approach focuses on the fact that the needs originate from the comparison with other people, making the condition of poverty depend on the general level of wealth. On the other hand, Sen (1976) determines that the level of life (wealth) of a person is determined by its ability and not by the assets it possess or by the utility it experiences, that is, is determined by its actions and not by the objects that the individual possesses. Therefore, when addressing these approaches, one should speak directly about the definitions of poverty measurement contemplated in that universe, taking into account the different types of poverty measures classified as direct, which refer to those that determine as poor person one who does not satisfy one or several basic needs, as an example of these are the Unsatisfied Basic Needs Index (NBI) and the Multidimensional Poverty Index (UBN); and indirect measures determine a person is poor if it does not have sufficient resources to satisfy its basic needs, the latter contemplates measures related to poverty lines. In the following sections, the different poverty measures used for this work will be defined.
Monetary Poverty Atlantic Region
The region has been characterized as one of the poorest in Colombia, although in the last five years it has managed to reduce its poverty by more than 10 percentage points, placing it for the period of 2015 at 42.4%.
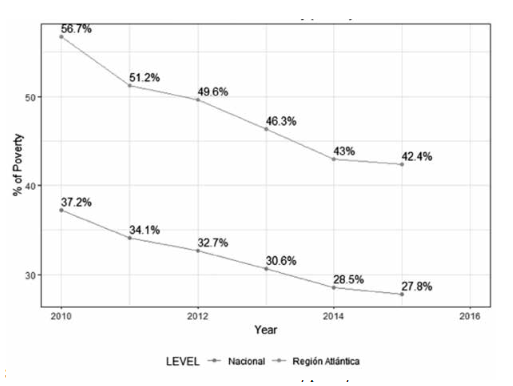 Figure 1
Incidence of monetary poverty 2010-2015
Figure 1
Incidence of monetary poverty 2010-2015
The
departments that have had a greater incidence of monetary poverty, over 50%,
for the period have been La Guajira (57.1%), Córdoba (55%), Magdalena (51.9%)
and Sucre (50.7%) on average for the last 6 years. Although significant
decreases have occurred in all of them, they continued to have a higher
incidence in the last year.
Table 1
Incidence of monetary poverty, departments of
the Atlantic Region (2010-2015)
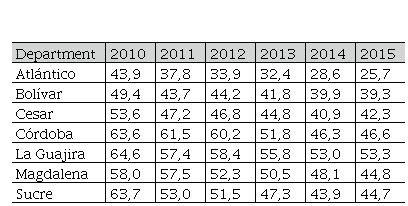 Own elaboration based
on data from monetary poverty series, Dane 2016
Own elaboration based
on data from monetary poverty series, Dane 2016
|
Department
|
2010
|
2011
|
2012
|
2013
|
2014
|
2015
|
|
Atlántico
|
43,9
|
37,8
|
33,9
|
32,4
|
28,6
|
25,7
|
|
Bolívar
|
49,4
|
43,7
|
44,2
|
41,8
|
39,9
|
39,3
|
|
Cesar
|
53,6
|
47,2
|
46,8
|
44,8
|
40,9
|
42,3
|
|
Córdoba
|
63,6
|
61,5
|
60,2
|
51,8
|
46,3
|
46,6
|
|
La Guajira
|
64,6
|
57,4
|
58,4
|
55,8
|
53,0
|
53,3
|
|
Magdalena
|
58,0
|
57,5
|
52,3
|
50,5
|
48,1
|
44,8
|
|
Sucre
|
63,7
|
53,0
|
51,5
|
47,3
|
43,9
|
44,7
|
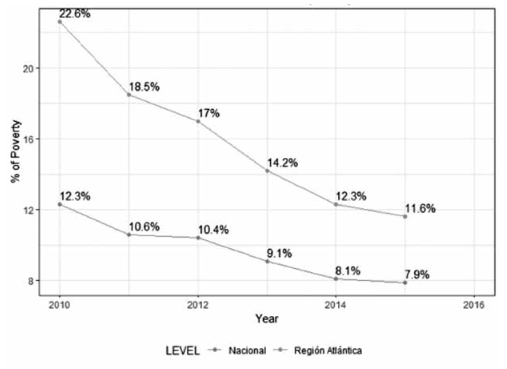
With regards to the situation of extreme poverty in the region, it continues to be well above national average, although a decrease of more than 10 percentage points has been observed in the period analyzed, with the departments of Sucre and La Guajira having reduced more on this issue.
With regard to the situation of extreme poverty in the region, it remained well above national average; although it showed a decrease of more than 10 percentage points in the period under review, the Departments of Sucre and La Guajira have reduced with respect to this topic.
Figure 2
Monetary poverty incidence of extreme
2010-2015
 Own elaboration based
on data from monetary poverty series, Dane 2016
Own elaboration based
on data from monetary poverty series, Dane 2016
As in the incidence of monetary poverty, the
departments that have had the highest incidence of extreme monetary poverty,
above 15%, for the period have been La Guajira (28%), Córdoba (21%), and
Magdalena (18%) on average for the last 6 years. Despite significant decreases
in all of them, they continue to have a higher incidence in the last year.
Table 2
Incidence of extreme monetary poverty, Atlantic
Region departments (2010-2015)
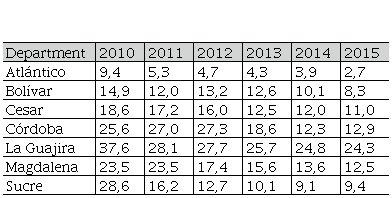 Own elaboration based
on data from monetary poverty series, Dane 2016
Own elaboration based
on data from monetary poverty series, Dane 2016
|
Department
|
2010
|
2011
|
2012
|
2013
|
2014
|
2015
|
|
Atlántico
|
9,4
|
5,3
|
4,7
|
4,3
|
3,9
|
2,7
|
|
Bolívar
|
14,9
|
12,0
|
13,2
|
12,6
|
10,1
|
8,3
|
|
Cesar
|
18,6
|
17,2
|
16,0
|
12,5
|
12,0
|
11,0
|
|
Córdoba
|
25,6
|
27,0
|
27,3
|
18,6
|
12,3
|
12,9
|
|
La Guajira
|
37,6
|
28,1
|
27,7
|
25,7
|
24,8
|
24,3
|
|
Magdalena
|
23,5
|
23,5
|
17,4
|
15,6
|
13,6
|
12,5
|
|
Sucre
|
28,6
|
16,2
|
12,7
|
10,1
|
9,1
|
9,4
|
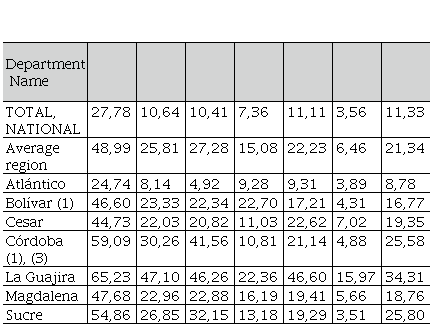
Unsatisfied Basic Needs Index (UBN)
According to the National Administrative Department of Statistics (Dane), the Unsatisfied Basic Need Index (UBN) aims to establish, on the basis of simple indicators, whether the basic needs of the population are met, classifying as poor those populations that do not reach a minimum threshold. These indicators include the following components: “inadequate housing, critically overcrowded housing, housing with inadequate utilities, housing with high economic d
Table 3
UBN Atlantic Region departments (Updated
2011)
 Own elaboration based
on UBN data, DANE 2011.
Own elaboration based
on UBN data, DANE 2011.
|
Department Name
| | | | | | | |
|
TOTAL, NATIONAL
|
27,78
|
10,64
|
10,41
|
7,36
|
11,11
|
3,56
|
11,33
|
|
Average region
|
48,99
|
25,81
|
27,28
|
15,08
|
22,23
|
6,46
|
21,34
|
|
Atlántico
|
24,74
|
8,14
|
4,92
|
9,28
|
9,31
|
3,89
|
8,78
|
|
Bolívar (1)
|
46,60
|
23,33
|
22,34
|
22,70
|
17,21
|
4,31
|
16,77
|
|
Cesar
|
44,73
|
22,03
|
20,82
|
11,03
|
22,62
|
7,02
|
19,35
|
|
Córdoba (1), (3)
|
59,09
|
30,26
|
41,56
|
10,81
|
21,14
|
4,88
|
25,58
|
|
La Guajira
|
65,23
|
47,10
|
46,26
|
22,36
|
46,60
|
15,97
|
34,31
|
|
Magdalena
|
47,68
|
22,96
|
22,88
|
16,19
|
19,41
|
5,66
|
18,76
|
|
Sucre
|
54,86
|
26,85
|
32,15
|
13,18
|
19,29
|
3,51
|
25,80
|
Multidimensional poverty index
“A multidimensional approach to poverty defines poverty as a deficit with reference to a poverty line in each dimension of an individual’s well-being” (Bourguignon & Chakravarty, 2003).
According to ECLAC (2013), “the multidimensional measurement of poverty assesses whether people achieve minimum well-being thresholds in each of the dimensions considered. Therefore, in a similar way to monetary measurement, disaggregated information is required at the level of individuals or households, such as that obtained from household surveys or population censuses” (ECLAC, 2013, p. 6).
In the case of Colombia, Dane constructs this indicator from the National Quality of Life Survey, which groups together five dimensions and 15 indicators for the calculation of this index, the dimensions worked on are: “the educational conditions of the home, the conditions of children and young people, health, work and access to utilities and housing conditions” (Dane; 2012, p. 22).
Multidimensional poverty index Atlantic Region
The situation of the Atlantic region with respect to this index is worrying in relation to the national situation, as it exceeds it by around 10 points, despite the fact that it has decreased negatively by 14 percentage points compared to the beginning of the period.
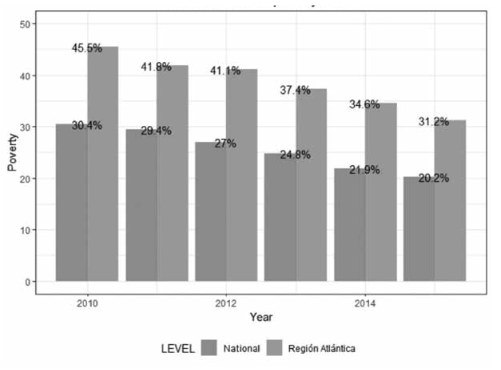 Figure 3
Incidence of multidimensional poverty
2010-2015
Own elaboration based
on data from monetary poverty series, Dane 2016.
Figure 3
Incidence of multidimensional poverty
2010-2015
Own elaboration based
on data from monetary poverty series, Dane 2016.
Gini coefficient
This coefficient measures the degree of inequality of income distribution or inequality of wealth in a region. This coefficient takes values between 0 and 1, where 0 indicates that all individuals have the same income and 1 indicates that only one individual concentrates all income.
Gini Atlantic Region
Unlike the previous indicators, where the region is above national average, for this measure of inequality the coefficient is below national average for the period analysed and has gone from 0.54 in 2010 to 0.48 in 2015, which means a significant reduction in terms of inequality in the region.
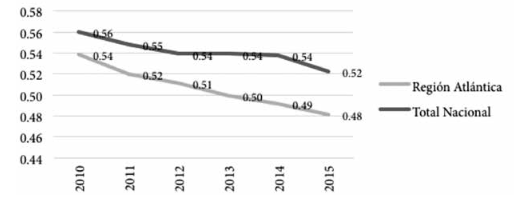 Figure 4
Gini coefficient 2010-2015
Own elaboration based
on data from monetary poverty series, Dane 2016.
Figure 4
Gini coefficient 2010-2015
Own elaboration based
on data from monetary poverty series, Dane 2016.
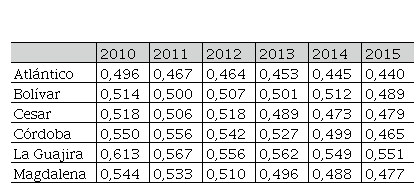
The
department with the highest inequality rates throughout the period, which is
even above national average and has the most deteriorated poverty indicators,
is the department of La Guajira, although it has decreased over the course of
five years. The reasons for these conditions are given by the high levels of
unemployment and poverty, explained by the low levels of education of the
population, the lack of training at work, the lack of skills and social
exclusion in the different areas in which human beings can carry out their
activities, as measured by the development research centre (CID) of the
National University. The improvement in the index has been due, among other
factors, to the improvement in the extractive industry, the incursion into
renewable and sustainable energy production, and the new political economy
represented in the state-market-society equation, renewed with international
coalitions that aim to recover trade relations, as indicated in the economic
report 2016 of the Chamber of Commerce of La Guajira.
Table 4
Departmental
GINI 2010-2015
 Own elaboration based
on data from monetary poverty series, DANE 2016
Own elaboration based
on data from monetary poverty series, DANE 2016
|
2010
|
2011
|
2012
|
2013
|
2014
|
2015
|
|
Atlántico
|
0,496
|
0,467
|
0,464
|
0,453
|
0,445
|
0,440
|
|
Bolívar
|
0,514
|
0,500
|
0,507
|
0,501
|
0,512
|
0,489
|
|
Cesar
|
0,518
|
0,506
|
0,518
|
0,489
|
0,473
|
0,479
|
|
Córdoba
|
0,550
|
0,556
|
0,542
|
0,527
|
0,499
|
0,465
|
|
La Guajira
|
0,613
|
0,567
|
0,556
|
0,562
|
0,549
|
0,551
|
|
Magdalena
|
0,544
|
0,533
|
0,510
|
0,496
|
0,488
|
0,477
|
Analysis of subjective poverty in the Atlantic region
As mentioned above, subjective measures of poverty are an appropriate way to capture the variation in subjectively perceived minimum standards of living in countries. In the Atlantic region, there is a similar trend to the common poverty indicators, i.e., the region perceives poor people to be a higher percentage than the perception that exists at national level, as shown below. The sample design used by Dane in the quality of life survey between 2011 and 2015 is probabilistic, stratified, multi-stage, clustered in such a way that the primary sampling units are municipalities with a size of more than 7000 inhabitants and those with smaller numbers are combined with other nearby and similar neighbours to complete more than 7000 inhabitants. The secondary sampling units are the blocks of the municipal seat and the tertiary units are segments comprising 10 dwellings on average. This means that each municipality is considered as a stratum because it assumes homogeneity in social, economic, demographic, cultural and poverty characteristics, among others; subsequently each block is a stratum and these are chosen within each municipality according to a random mechanism to apply the survey, but because of their number, segments of nearby dwellings are defined (on average 10) to be considered as strata and a sample of them is selected to carry out the study within each selected block.
Sample estimate of people who are considered poor
In this case we estimate a ratio between two totals: the numerator is the estimated total of households that are considered poor and the denominator is the estimated total of households. The estimate of this ratio shall be made taking into account the national total and the total for the Atlantic region.
Ratio for the national total
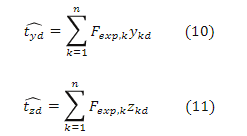
The estimation of the totals is done with the equations for the Horvitz Thompson estimator, which is unbiased and ideal for sample designs without replacement (i.e. where the same household is not chosen two or more times to complete the quality of life survey) as follows (Coefficient and Variance Specifications, 2008):
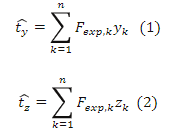 Formula 1 y 2
Where yk is an indicator function that takes the value
of 1 if the household is considered poor or 0 if it is not considered poor; in
addition, it takes the value of 1 because it is intended to estimate the total
number of households at national level and is the expansion factor associated with k – the household surveyed.
Thus, the ratio of households that are considered poor is given by (Gutiérrez,
2008):
 Formula 3
This ratio is ideal for estimating the proportion of households that are considered poor at national level and the Atlantic region, since one ratio is defined as a ratio between two totals and in this case these totals are: the number of households that are considered poor at national level or in the Atlantic region and the number of households at national level or in that region. It is necessary to emphasize that equations (1) and (2) allow us to estimate these totals respectively by means of the Horvitz Thompson estimator, in order to later estimate the ratio of people who consider themselves poor; which takes values between zero and one for its mathematical properties.
The estimated variance of this ratio, by means of Taylor’s approximation, is given by (Gutiérrez, 2009):
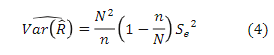 Formula 4
Thus, N
is the national total of households and n
the sample size; in addition, Se2 is the
sample variance of such that (Gutiérrez,
2009):
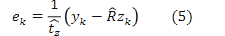 Formula 5
Developing a
routine in R, we obtain the following results for the ratio of households that
are considered poor in 2011, over the national total:
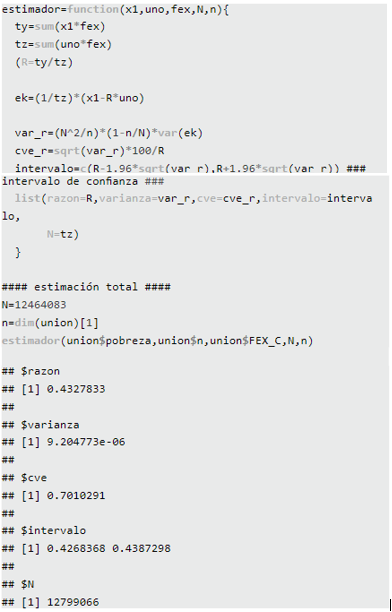 Estimador
We can say
that the estimated ratio of households that are considered poor in 2011 is:
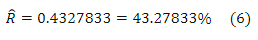 Formula 6
Its estimated variance is such that:
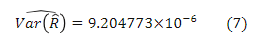 Formula 7
Thus the confidence interval with a 95%
confidence interval for the ratio of households that are considered poor is:
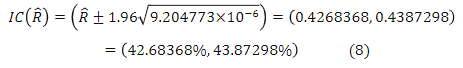 Formula 8
This means that the ratio of households in Colombia that are considered poor in 2011 is between 42.6836868% and 43.87298% with reliability of 95%.
The coefficient of variation of the estimate is:
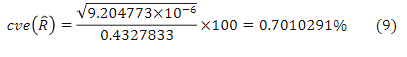 Formula 9
The interpretation of this coefficient is of great importance because it allows us to observe the error obtained when measuring a characteristic in a sample and not in the population. This coefficient is associated with the variability of the estimator used to infer the characteristic of a population, and in this case this estimator is the reason for subjective poverty at national or Atlantic regional level. The result obtained in equation (9) indicates that our estimate is very good because the coefficient of variation is less than 7%. This statement is the product of the statistical literature cited by Dane in its studies of interpretation of the coefficient of variation (2008), it is verified that:
“For the sample, an estimate with a coefficient of variation is considered:
Up to 7% is accurate;
Between 8 and 14% means that there is acceptable accuracy;
Greater than 20% indicates that the estimate is inaccurate and is therefore recommended for descriptive purposes only (trends not levels)”.
The latest record is the estimated total number of households in 2011, which is 12,799,066.
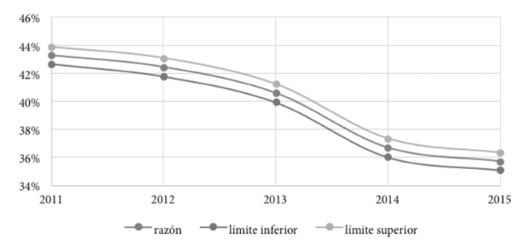 Figure 5
Subjective poverty ratio at national level
Own elaboration
Figure 5
Subjective poverty ratio at national level
Own elaboration
Ratio for the Atlantic region
To make the estimate for the Atlantic region, we use a domain-by-domain estimate (the region being the domain of interest):
 Formula 10 y 11
With 𝑡𝑡𝑡𝑡 estimated total number of households considered poor in that region and the estimated total number of households in the Atlantic region. In addition, is the indicator function that takes the value of 1 when a household in the Atlantic region is considered poor and 0 if not; while is the indicator function that takes the value of 1 when the household belongs to the Atlantic region or 0 if not.
Thus the estimated ratio of households that are considered poor in the Atlantic region in 2011 is:
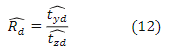 Formula 12
The equation of variance is the same as for the national total and in
particular is:
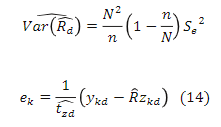 Formula 14
Developing a
routine in R, we obtain the estimation values in the following output table:
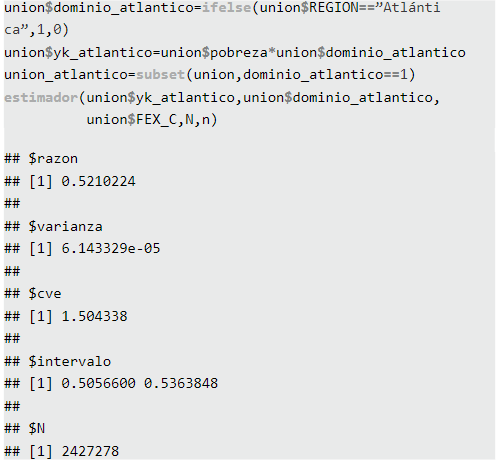 Union dominio
This means
that the ratio of households that are considered poor in the Atlantic region
is:
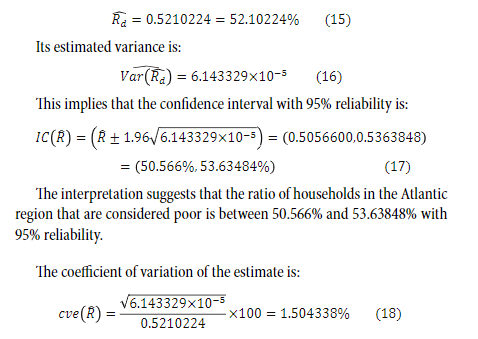 Formula 15-16-17 y 18
This indicates that we have a good estimate of the ratio of poor households in the Atlantic region as the coefficient of variation is less than 15%.
The last value of the output table is 2,427,278, which is the estimated total number of households in the Atlantic region in 2011.
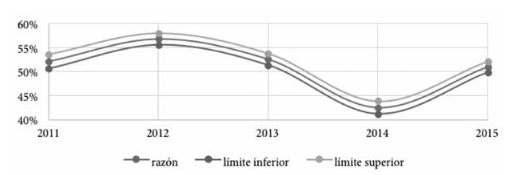 Figure 6
Subjective poverty ratio in the Atlantic
region
Own
elaboration.
Figure 6
Subjective poverty ratio in the Atlantic
region
Own
elaboration.
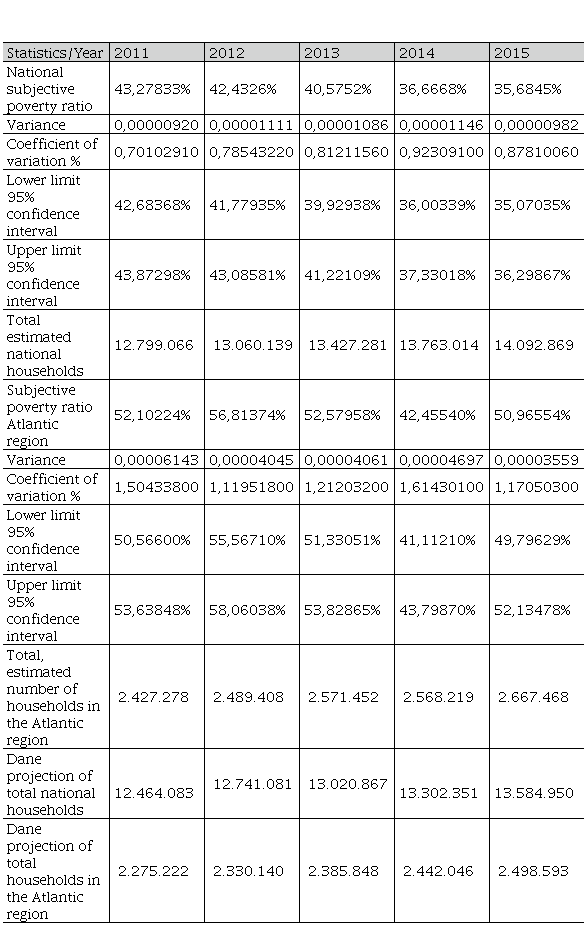
If we apply
the same results observed above, we can obtain the following table with the
subjective poverty ratio at national level and in the Atlantic region between
2011 and 2015:
Table 5
Subjective poverty ratio
 Own elaboration.
|
Statistics/Year
|
2011
|
2012
|
2013
|
2014
|
2015
|
|
National subjective poverty
ratio
|
43,27833%
|
42,4326%
|
40,5752%
|
36,6668%
|
35,6845%
|
|
Variance
|
0,00000920
|
0,00001111
|
0,00001086
|
0,00001146
|
0,00000982
|
|
Coefficient of variation %
|
0,70102910
|
0,78543220
|
0,81211560
|
0,92309100
|
0,87810060
|
|
Lower limit 95% confidence interval
|
42,68368%
|
41,77935%
|
39,92938%
|
36,00339%
|
35,07035%
|
|
Upper limit 95% confidence interval
|
43,87298%
|
43,08581%
|
41,22109%
|
37,33018%
|
36,29867%
|
|
Total estimated national households
|
12.799.066
|
13.060.139
|
13.427.281
|
13.763.014
|
14.092.869
|
|
Subjective
poverty ratio Atlantic region
|
52,10224%
|
56,81374%
|
52,57958%
|
42,45540%
|
50,96554%
|
|
Variance
|
0,00006143
|
0,00004045
|
0,00004061
|
0,00004697
|
0,00003559
|
|
Coefficient of variation %
|
1,50433800
|
1,11951800
|
1,21203200
|
1,61430100
|
1,17050300
|
|
Lower limit 95% confidence interval
|
50,56600%
|
55,56710%
|
51,33051%
|
41,11210%
|
49,79629%
|
|
Upper limit 95% confidence interval
|
53,63848%
|
58,06038%
|
53,82865%
|
43,79870%
|
52,13478%
|
|
Total,
estimated number of households in the Atlantic region
|
2.427.278
|
2.489.408
|
2.571.452
|
2.568.219
|
2.667.468
|
|
Dane
projection
of total
national households
|
12.464.083
|
12.741.081
|
13.020.867
|
13.302.351
|
13.584.950
|
|
Dane
projection of total households in the Atlantic region
|
2.275.222
|
2.330.140
|
2.385.848
|
2.442.046
|
2.498.593
|
Logistic regression model to explain subjective poverty between 2011 and 2015
The logistic regression model in the case of explaining subjective poverty in terms of demographic or socio-economic variables is more appropriate than a linear regression model since the latter is determined for all the real numbers, thus taking positive, negative or zero values; this is incongruent with the attempt to explain a variable that only takes values of 1 (when people consider themselves poor) or 0 (when people do not consider themselves poor). Similarly, the uncertainty of declaring oneself poor has an associated probability according to a certain demographic and economic profile; this is why the logistic regression model is a quantification of the probability p of declaring oneself poor or not according to a demographic and economic profile. The equation that defines the model is:
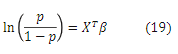 Formula 19
Where XT a vector of demographic and
economic information of people with which to explain the declaration of
subjective poverty. On the other hand, β are the parameters associated with demographic
and economic variables, which measure the effect they have on a person’s
decision to declare themselves poor or not. It follows from the above that:
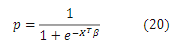 Formula 20
This logistic regression model is more suitable than the PROBIT model for interpreting the effects when variables change numerically or from one category to another.
To estimate the parameters β, we used the maximum likelihood method; solving the system of equations:
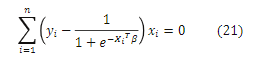 Formula 21
With as the response variable of 1 or 0 for
household . As the system has no solution by means of clearance methods,
numerical convergence methods such as NEWTON-RAPHSON or FISHER-SCORING are
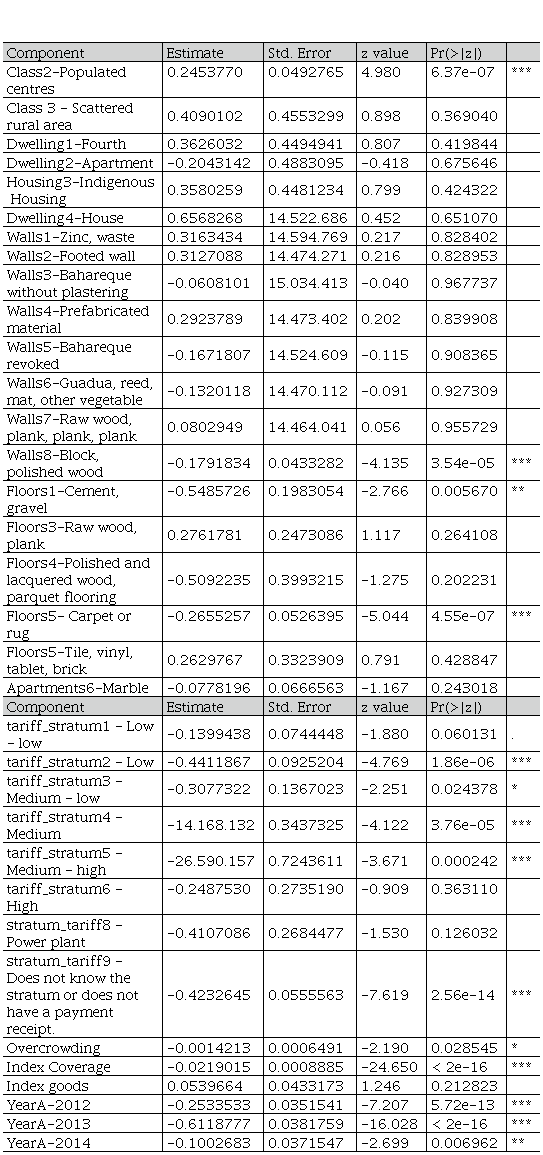
used. The method used in R is the FISHER-SCORING method and the estimates from β can be seen in the second column of
the following table:
Table 6
Estimates
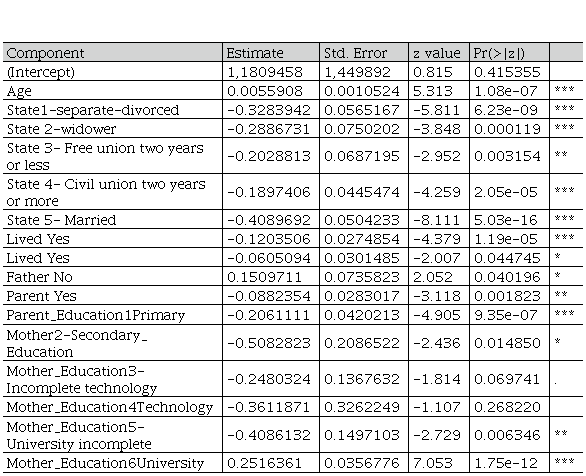 Own elaboration
|
Component
|
Estimate
|
Std. Error
|
z value
|
Pr(>|z|)
| |
|
(Intercept)
|
1,1809458
|
1,449892
|
0.815
|
0.415355
| |
|
Age
|
0.0055908
|
0.0010524
|
5.313
|
1.08e-07
|
***
|
|
State1-separate-divorced
|
-0.3283942
|
0.0565167
|
-5.811
|
6.23e-09
|
***
|
|
State 2-widower
|
-0.2886731
|
0.0750202
|
-3.848
|
0.000119
|
***
|
|
State 3-
Free union two years or less
|
-0.2028813
|
0.0687195
|
-2.952
|
0.003154
|
**
|
|
State 4-
Civil union two years or more
|
-0.1897406
|
0.0445474
|
-4.259
|
2.05e-05
|
***
|
|
State 5- Married
|
-0.4089692
|
0.0504233
|
-8.111
|
5.03e-16
|
***
|
|
Lived Yes
|
-0.1203506
|
0.0274854
|
-4.379
|
1.19e-05
|
***
|
|
Lived Yes
|
-0.0605094
|
0.0301485
|
-2.007
|
0.044745
|
*
|
|
Father No
|
0.1509711
|
0.0735823
|
2.052
|
0.040196
|
*
|
|
Parent Yes
|
-0.0882354
|
0.0283017
|
-3.118
|
0.001823
|
**
|
|
Parent_Education1Primary
|
-0.2061111
|
0.0420213
|
-4.905
|
9.35e-07
|
***
|
|
Mother2-Secondary_ Education
|
-0.5082823
|
0.2086522
|
-2.436
|
0.014850
|
*
|
|
Mother_Education3-
Incomplete technology
|
-0.2480324
|
0.1367632
|
-1.814
|
0.069741
|
.
|
|
Mother_Education4Technology
|
-0.3611871
|
0.3262249
|
-1.107
|
0.268220
| |
|
Mother_Education5-
University incomplete
|
-0.4086132
|
0.1497103
|
-2.729
|
0.006346
|
**
|
|
Mother_Education6University
|
0.2516361
|
0.0356776
|
7.053
|
1.75e-12
|
***
|
Table 6
Estimates
 Own elaboration
|
Component
|
Estimate
|
Std. Error
|
z value
|
Pr(>|z|)
| |
|
Class2-Populated centres
|
0.2453770
|
0.0492765
|
4.980
|
6.37e-07
|
***
|
|
Class 3 - Scattered rural
area
|
0.4090102
|
0.4553299
|
0.898
|
0.369040
| |
|
Dwelling1-Fourth
|
0.3626032
|
0.4494941
|
0.807
|
0.419844
| |
|
Dwelling2-Apartment
|
-0.2043142
|
0.4883095
|
-0.418
|
0.675646
| |
|
Housing3-Indigenous Housing
|
0.3580259
|
0.4481234
|
0.799
|
0.424322
| |
|
Dwelling4-House
|
0.6568268
|
14.522.686
|
0.452
|
0.651070
| |
|
Walls1-Zinc, waste
|
0.3163434
|
14.594.769
|
0.217
|
0.828402
| |
|
Walls2-Footed wall
|
0.3127088
|
14.474.271
|
0.216
|
0.828953
| |
|
Walls3-Bahareque without
plastering
|
-0.0608101
|
15.034.413
|
-0.040
|
0.967737
| |
|
Walls4-Prefabricated
material
|
0.2923789
|
14.473.402
|
0.202
|
0.839908
| |
|
Walls5-Bahareque revoked
|
-0.1671807
|
14.524.609
|
-0.115
|
0.908365
| |
|
Walls6-Guadua, reed, mat, other vegetable
|
-0.1320118
|
14.470.112
|
-0.091
|
0.927309
| |
|
Walls7-Raw wood, plank, plank, plank
|
0.0802949
|
14.464.041
|
0.056
|
0.955729
| |
|
Walls8-Block, polished
wood
|
-0.1791834
|
0.0433282
|
-4.135
|
3.54e-05
|
***
|
|
Floors1-Cement, gravel
|
-0.5485726
|
0.1983054
|
-2.766
|
0.005670
|
**
|
|
Floors3-Raw wood, plank
|
0.2761781
|
0.2473086
|
1.117
|
0.264108
| |
|
Floors4-Polished and lacquered wood, parquet flooring
|
-0.5092235
|
0.3993215
|
-1.275
|
0.202231
| |
|
Floors5- Carpet or rug
|
-0.2655257
|
0.0526395
|
-5.044
|
4.55e-07
|
***
|
|
Floors5-Tile,
vinyl, tablet, brick
|
0.2629767
|
0.3323909
|
0.791
|
0.428847
| |
|
Apartments6-Marble
|
-0.0778196
|
0.0666563
|
-1.167
|
0.243018
| |
|
Component
|
Estimate
|
Std. Error
|
z value
|
Pr(>|z|)
| |
|
tariff_stratum1 - Low - low
|
-0.1399438
|
0.0744448
|
-1.880
|
0.060131
|
.
|
|
tariff_stratum2 - Low
|
-0.4411867
|
0.0925204
|
-4.769
|
1.86e-06
|
***
|
|
tariff_stratum3 - Medium -
low
|
-0.3077322
|
0.1367023
|
-2.251
|
0.024378
|
*
|
|
tariff_stratum4 - Medium
|
-14.168.132
|
0.3437325
|
-4.122
|
3.76e-05
|
***
|
|
tariff_stratum5 - Medium - high
|
-26.590.157
|
0.7243611
|
-3.671
|
0.000242
|
***
|
|
tariff_stratum6 - High
|
-0.2487530
|
0.2735190
|
-0.909
|
0.363110
| |
|
stratum_tariff8 - Power plant
|
-0.4107086
|
0.2684477
|
-1.530
|
0.126032
| |
|
stratum_tariff9
- Does not know the stratum or does not have a payment receipt.
|
-0.4232645
|
0.0555563
|
-7.619
|
2.56e-14
|
***
|
|
Overcrowding
|
-0.0014213
|
0.0006491
|
-2.190
|
0.028545
|
*
|
|
Index Coverage
|
-0.0219015
|
0.0008885
|
-24.650
|
< 2e-16
|
***
|
|
Index goods
|
0.0539664
|
0.0433173
|
1.246
|
0.212823
| |
|
YearA-2012
|
-0.2533533
|
0.0351541
|
-7.207
|
5.72e-13
|
***
|
|
YearA-2013
|
-0.6118777
|
0.0381759
|
-16.028
|
< 2e-16
|
***
|
|
YearA-2014
|
-0.1002683
|
0.0371547
|
-2.699
|
0.006962
|
**
|
The asterisks indicate that all the variables are significant for the model with which we intend to explain the subjective poverty declared by the people of the Atlantic region between 2011 and 2015.
The interpretation of the results is based on mathematical application:
 Formula 22
Where βˆ is the point estimate of the parameters (which appear in the second column of the table above) of the variables defined above as explanatory for the model. The results (see Annex 3) and interpretation of these calculations are shown below, bearing in mind that only for the analysis is there considered to be a change in the variable of the referenced parameter; while the other variables of the model remain constant:
Age 0.56: For each additional year that a person in the Atlantic region has between 2011 and 2015, the pro-poor risk is expected to be 0.56% higher than the pro-poor risk before the year of age increases. This means that there is a greater tendency to declare themselves poor when they are older and this is consistent with the segmentation analysis observed earlier, showing a high perception of poverty in the age groups that are in the transition of young and old adults. This can be attributed to the labour force, which indicates that in the transition age mentioned above, there are fewer opportunities to work and earn a wage and economic dependency can be generated by other people (children, grandchildren, spouses, etc.).
Separated or divorced -27.99: The pro-poor risk for a divorced or separated person is 27.99% less than the pro-poor risk for a single person.
Widowed -25.07: The pro-poor risk for a widow is 25.07% less than the pro-poor risk for a single person.
Civil union over two years -17.28: The pro-poor risk for a person who has been in civil union for two years or more is 17.28% less than the pro-poor risk for a single person.
Civil union two years or less -18.36: The pro-poor risk for a person who has been in a civil union for two years is 18.36% less than the pro-poor risk for a single person.
Married -33.57: The pro-poor risk for a married person is 33.57% less than the pro-poor risk for a single person.
These results show that there seems to be a greater tendency to declare themselves poor in the Atlantic region, when people are single than when they are in other marital status. This can be attributed to the fact that people perceive that higher tenure and socio-economic status can be achieved when working as a team with another person than when living single.
Time Lived -11.34: The pro-poor risk for a person who has lived all his or her life in the municipality is 11.34% less than the pro-poor risk for a person who has not lived all his or her life in the municipality.
This result shows that there is a greater tendency to declare oneself poor when one has not lived all one’s life in the municipality than when one has always lived in the municipality. The reason for this is that people who have lived all their lives in a municipality may perceive that they have achieved a degree of stability (economic, employment, etc.), which has allowed them to remain in their place of origin without creating the need to migrate to other places to obtain new opportunities.
Father No -5.87: The pro-poor risk for a person who does not live with his or her father is 5.87% less than the pro-poor risk for a person who has a deceased father.
Parent Yes 16.30: The pro-poor risk for a person living with their parent is 16.30% higher than the pro-poor risk for a person whose parent is deceased.
Mother-Primary Education -8.45: The pro-poor risk for a person whose mother had a primary school education level is 8.45% less than the pro-poor risk for a person whose mother had no education level.
Mother-Secondary Education -18.63: The pro-poor risk for a person whose mother had a secondary education level is 18.63% less than the propoor risk for a person whose mother had no education level.
Mother-Incomplete technological education -39.85: The propoor risk for a person whose mother had an incomplete educational level of technological or technical training is 39.85% less than the pro-poor risk for a person whose mother had no educational level.
Mother-Complete-Technological Education -21.97: The pro-poor risk for a person whose mother had a complete technical or technological education level is 21.97% less than the pro-poor risk for a person whose mother had no education level.
Mother’s education-Incomplete university -30.32: The pro-poor risk for a person whose mother had an incomplete college education is 30.32% less than the pro-poor risk for a person whose mother had no education.
Mother’s education-University completed -33.54: The pro-poor risk for a person whose mother had a full university education is 33.54% less than the pro-poor risk for a person whose mother had no education at all.
These results show that there is a tendency not to declare themselves poor when the mother has a higher level of education. This consequence can be attributed to the fact that at a higher level of education, there will be greater job opportunities and economic growth to have a sustainable life, as well as a better quality of life that implies greater ownership of assets and excellent educational opportunities, among others.
Class of area populated centers 28.61: The risk in favor of declaring oneself poor for a person living in populated centers is 28.61% more than the risk in favor of declaring oneself poor for a person living in the municipal capital.
Class of area dispersed rural 27.81: The pro-poor risk for a person living in a dispersed rural area is 27.81% higher than the pro-poor risk for a person living at the municipal seat.
Interpretations indicate that there is a greater tendency to declare themselves poor when people in the Atlantic region live in populated centres or rural areas than when they live in municipal districts. One of the reasons that may explain this consequence is that people’s perception of economic, cultural and political development is that it is associated with the municipal capital, among others, more than with rural areas or populated centres.
Walls and type of dwelling: The variables of walls and type of dwelling are not significant in explaining the subjective poverty variable because the p-value of the null hypothesis of each of the categories that compose them is greater than any level of significance (1%, %5 or 10%) that may be chosen. By virtue of the above, none of the categories of the mentioned variables appear with asterisks or with points in the table of the LOGIT model.
Floors Cement, gravel -16.40: The pro-poor risk for a person in the Atlantic region who has cement or gravel floors in his or her home is 16.40% less than the pro-poor risk for a person who has sand floors in his or her home.
Floors Crude wood, table -42.22: The pro-poor risk for a person in the Atlantic region who has crude wood or plank floors in his or her home is 42.22% less than the pro-poor risk for a person who has sand floors in his or her home.
Floors Polished and lacquered wood, parquet 31.81: The pro-poor risk for a person in the Atlantic region who has polished and lacquered wood or parquet floors is 31.81% higher than the pro-poor risk for a person who has sand floors in their home.
Flooring Carpet or rug -39.90: The pro-poor risk for a person in the Atlantic region who has carpeted or matted floors in his or her home is 39.90% less than the pro-poor risk for a person who has sand floors in his or her home.
Floors Tile, vinyl, tablet, brick -23.32: The pro-poor risk for a person in the Atlantic region who has tile, vinyl, tablet or brick floors is 23.32% less than the pro-poor risk for a person who has sand floors in his or her home.
Marble floors 30.08: The pro-poor risk for a person in the Atlantic region who has marble floors in his or her home is 30.08% higher than the pro-poor risk for a person who has sand floors in his or her home.
The interpretation of parameters suggests that there is a greater tendency for people in the Atlantic region to declare themselves poor when they have floors in sand than when they have floors in materials such as cement, gravel, rough wood, plank, carpet, rug, tile, vinyl, tablet or brick; while people who have floors in materials such as polished and lacquered wood, parquet or marble tend to declare themselves poor with a greater tendency than those who have floors in sand.
These circumstances can be explained by the fact that materials such as cement, gravel, rough wood, board, carpet, mat, tile, vinyl, tablet or brick imply a better quality of life than dwellings with their sand floors; but the tendency to declare themselves poorer than when having sand floors by those who have marble or polished wood floors, can be explained by the fact that despite having an excellent quality of material, they do not conform and continue to aspire to an even more demanding quality of life.
Tariff stratum: The interpretations of each indicator according to the stratum recorded in the tariff of utilities are made in contrast to the basis of not having utilities. This means that since all the values shown in the table are negative, one can conclude that there is an increasing tendency to declare oneself poor when one does not have utilities than when one has at least one of them. The most logical reason for this phenomenon is that people’s perception of poverty is greater when they do not have decent living conditions that begin with a fact as basic as that of having utilities in their homes.
Overcrowding -34.51: Overcrowding has been defined as the number of rooms per person. Thus, the interpretation of the parameter suggests that for each additional unit of overcrowding (being less overcrowded in a dwelling), the pro-poor risk is 34.51% less than the risk of being poor before the increase in overcrowding.
This is of course a phenomenon associated with decent housing conditions that define a good quality of life. Therefore, greater overcrowding generates a greater tendency to declare poverty because the conditions of decent housing are not met for a good quality of life, since this generates the need to share goods, spaces and relationships of economic dependency among the people who make up a household.
Utilities coverage ratio -0.14: For each additional percentage unit of the Utilities coverage ratio, the pro-poor risk is 0.14% less than the risk of being poor before the unit increase.
This interpretation is consistent with the results of the tariff parameters observed above, given that the greater the coverage, the lower the tendency to declare themselves poor, since the conditions of decent housing that promote a better quality of life are met.
NSE asset holdings -2.17: For each additional percentage unit of the NSE asset holdings index, the pro-poor risk is 2.17% less than the risk of being poor before the unit increase.
The result is indicating that, to a greater extent in the index of the latent socioeconomic trait obtained by the possession of goods, there is a lesser tendency to declare oneself poor because, of course, having a great variety of goods implies economic self-sufficiency to be able to acquire and/or maintain them. In this way, the hypothesis that economic stability and high incomes generate fewer trends to be declared poor is fulfilled with the statistical evidence of the interpretation of the parameter estimation.
Year: The interpretations are made in contrast to the base year which is 2011. In this case, it can be observed that households in the Atlantic region tend to declare themselves less poor in 2013, 2014 and 2015 than in 2011. In addition, in 2012, there is a greater tendency than in 2011 to declare themselves poor.
According to the fifth column (significance of the variables) of the first table of the model, obtained in R, we can obtain the importance of each variable in the decision whether to declare itself poor or not. These magnitudes add up to 100 and you can see the most influential variables at the time they are declared poor in the following graph:
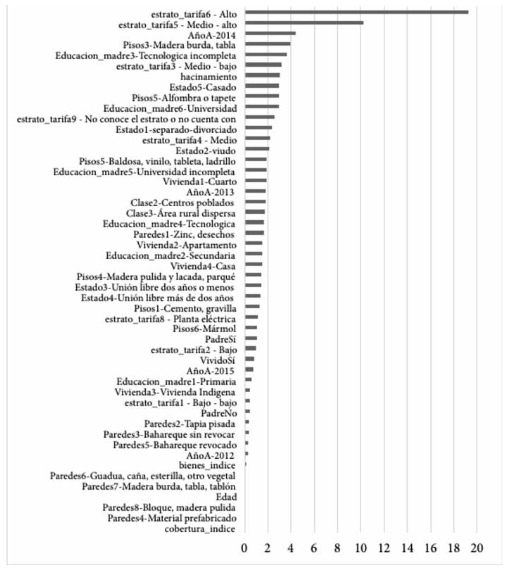 Figure 7
Most relevant variables
Own
elaboration.
Figure 7
Most relevant variables
Own
elaboration.
The results
of the model are reliable because it does not have a high variety of
influential values as most of them are within the range between -2 and 2 of the
residuals studied:
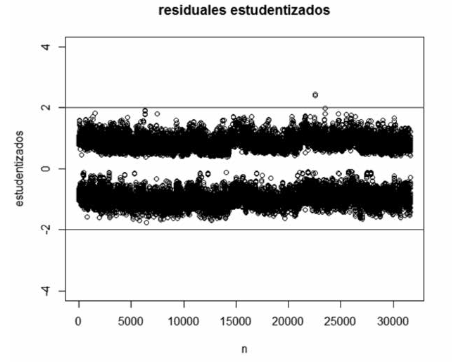 Figure 8
Most relevant variables
Own elaboration.
Figure 8
Most relevant variables
Own elaboration.
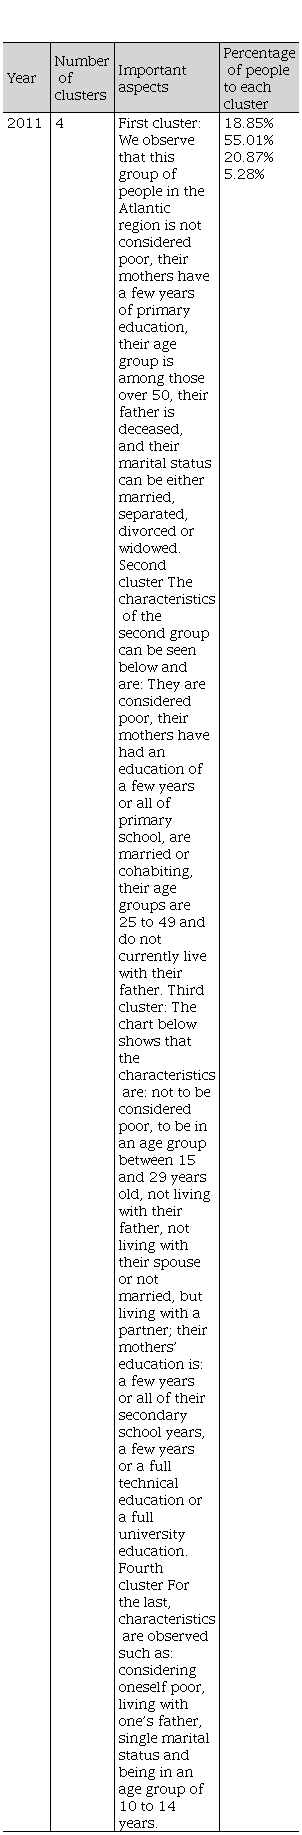
The following table presents a characterization
for each year of the period analysed, and the clusters broken down into each of
these:
Table 7
Characteristics by year and
cluster
 Own elaboration
|
Year
|
Number
of clusters
|
Important aspects
|
Percentage of people to each cluster
|
|
2011
|
4
|
First cluster:
We
observe that this group of people in the Atlantic region is not considered
poor, their mothers have a few years of primary education, their age group is
among those over 50, their father is deceased, and their marital status can
be either married, separated, divorced or widowed. Second cluster
The characteristics of the second group can be seen below and are:
They are
considered poor, their mothers have had an education of a few years or all of
primary school, are married or cohabiting, their age groups are 25 to 49 and
do not currently live with their father. Third
cluster:
The chart
below shows that the characteristics are: not to be considered poor, to be in
an age group between 15 and 29 years old, not living with their father, not
living with their spouse or not married, but living with a partner; their
mothers’ education is: a few years or all of their secondary school years, a
few years or a full technical education or a full university education. Fourth cluster
For the last, characteristics are observed such as: considering
oneself poor, living with one’s father, single marital status and being in an
age group of 10 to 14 years.
|
18.85%
55.01%
20.87%
5.28%
|
Table 7
Characteristics by year and
cluster
 Own elaboration
|
Year
|
Number
of clusters
|
Important aspects
|
Percentage of people to each cluster
|
|
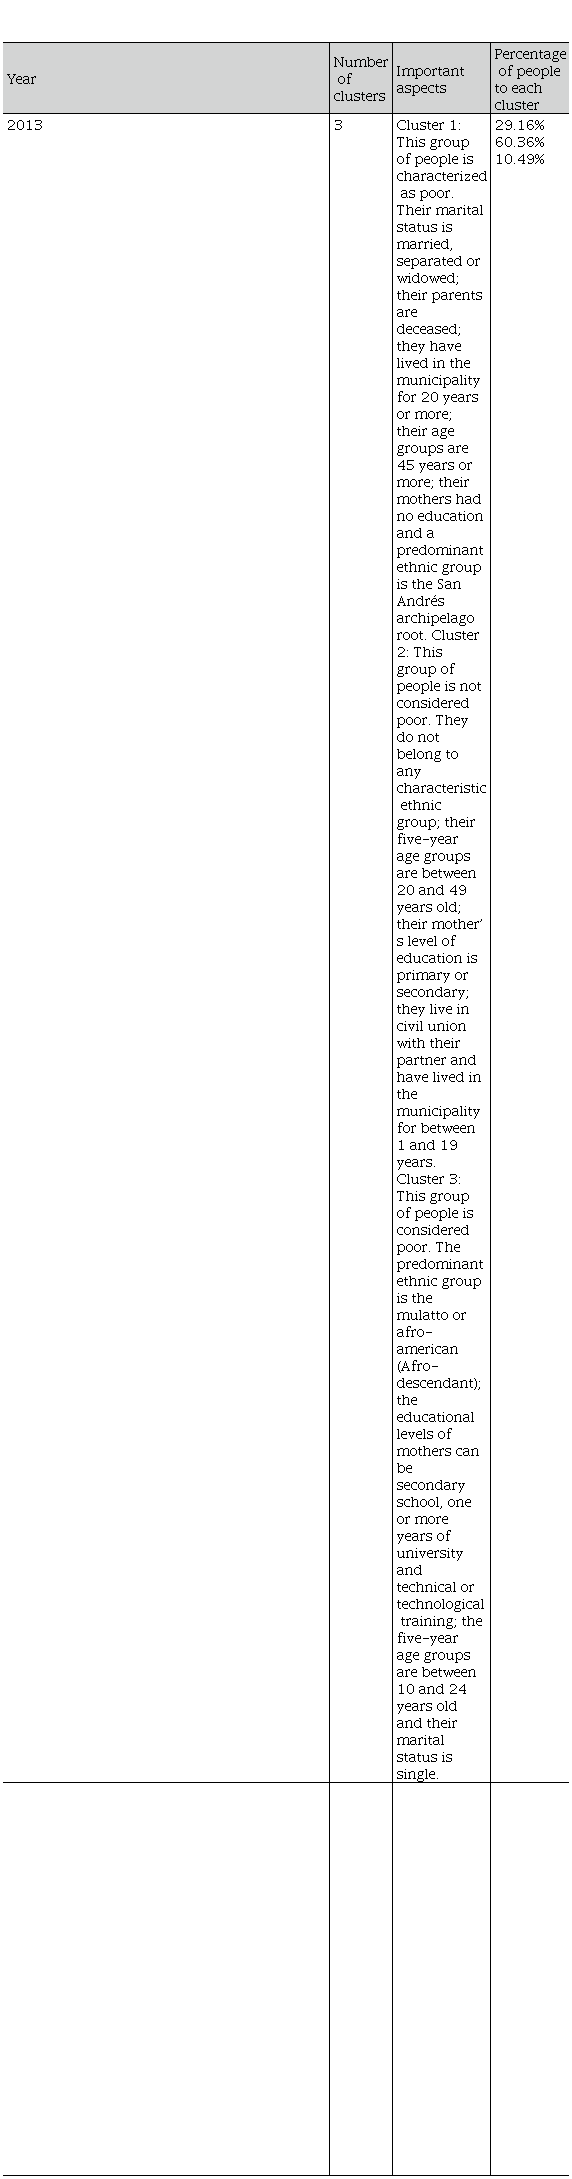
2013
|
3
|
Cluster 1: This
group of people is characterized as poor. Their marital status is married,
separated or widowed; their parents are deceased; they have lived in the
municipality for 20 years or more; their age groups are 45 years or more;
their mothers had no education and a predominant ethnic group is the San
Andrés archipelago root.
Cluster 2: This
group of people is not considered poor. They do not belong to any
characteristic ethnic group; their five-year age groups are between 20 and 49
years old; their mother’s level of education is primary or secondary; they
live in civil union with their partner and have lived in the municipality for
between 1 and 19 years.
Cluster 3: This group of people is considered poor. The
predominant ethnic group is the mulatto or afro-american (Afro-descendant);
the educational levels of mothers can be secondary school, one or more years
of university and technical or technological training; the five-year age
groups are between 10 and 24 years old and their marital status is single.
|
29.16%
60.36%
10.49%
|
| | | |
Table 7
Characteristics by year and
cluster
 Own elaboration
|
Year
|
Number
of clusters
|
Important aspects
|
Percentage of people to each cluster
|
|
2014
|
3
|
Cluster 1: This
group of people is considered poor. They have been living in their municipality
for a lifetime or more than 30 years; their marital status is married or
widowed; their five-year age groups are 50 years and older; their father is
deceased; the characteristic gender is male and their mothers have no
schooling level.
Cluster 2: This group of people is not considered poor. The
educational level of the mother is primary, secondary, university or
technical or technological training and the characteristic gender is female.
The age groups are between 20 and 49 years old in five-year groups; they do
not currently live with their father; their marital status is married, or in
civil union because they are cohabiting with their partner and do not
currently live with their father. In addition, they are newcomers or have
lived between 1 and 19 years in their municipality. On the other hand, they
do not belong to a characteristic ethnic group. Cluster 3: This group of people is considered poor. Their
five-year age groups are between 10 and 24 years old. Their mother’s
educational level is secondary school or one or more years of university;
they are newcomers or have always lived in their current municipality; their
characteristic gender is male; their marital status is single and they
currently live with their father. An outstanding ethnic group in this group
is mulatto or afro-american (Afro-descendant). The following page shows the
profile graphs of each active variable of the segmentation analysis according
to the group or cluster formed.
|
32.21%
56.69%
11.11%
|
|
Year
|
Number
of clusters
|
Important aspects
|
Percentage of people to each cluster
|
|
2015
|
3
|
Cluster 1: This
group of people is considered poor. They have always lived or more than 20
years in the current municipality. Their fiveyear age groups are 50 years and
older. Their marital status is married, separated, divorced or widowed. Their
mother has no education and both parents are deceased.
Cluster 2: This
group of people is not considered poor. The characteristic gender is female;
the educational level of their mothers is primary and secondary; they do not
currently live with both parents; their marital status is civil union; the
five-year age groups are between 20 and 49; they have lived in the
municipality between 1 and 20 years or have recently arrived.
Cluster 3: This group of people is considered poor. The
educational level of their mothers is one or more years of university or
technical or technological training; they have always lived in the
municipality or are newcomers. They currently live with their father, but not
with their mother; and the five-year age groups in which they are found are
10 to 24 years old. They are currently single and the characteristic gender
is male.
|
31.80%
57.40%
10.81%
|
Conclusions
The research estimated the subjective poverty rate for national level and the Atlantic region, which averaged 39.7% and 50.9% respectively for the period 2011-2015, with the latter result 11 percentage points higher than the national level, which is in line with the results of objective poverty measures analyzed in chapter 2 of this document.
Based on the previous perception of people living in poverty, a characterisation was made through different clusters for the periods analysed, taking into account the question of whether or not they are considered poor in the household survey:
• 2011 (55.01%): They consider themselves poor, their mothers had an education of a few years or all of primary school, are married or cohabiting, their age groups are 25 to 49 years old and do not currently live with their father.
• 2012 (43.2%): They consider themselves poor, have always lived in the municipality and belong to the indigenous ethnic group. The education of the mother of the family in their homes is secondary school or some years of college. The age group of these people is 20 to 34 years old, they are unmarried and have been cohabiting for two years or more. In addition, they do not currently live with their mother.
• 2013 (60.3%): Not considered poor. They do not belong to any characteristic ethnic group; their five-year age groups are between 20 and 49 years old; their mother’s level of education is primary or secondary; they live in civil union with their partner and have lived in the municipality for between 1 and 19 years.
• 2014 (56.6%): Not considered poor. The educational level of the mother is primary, secondary, university or technical or technological training and the characteristic gender is female. The age groups are between 20 and 49 years old in five-year groups; they do not currently live with their father; their marital status is married, or in civil union because they are cohabiting and do not currently live with their father. In addition, they are newcomers or have lived between 1 and 19 years in their municipality. On the other hand, they do not belong to a characteristic ethnic group.
• 2015 (57.4%): Not considered poor. The characteristic gender is female; the educational level of their mothers is primary and secondary; they do not currently live with both parents; their marital status is civil union; the five-year age groups are between 20 and 49; they have lived in the municipality between 1 and 20 years or have recently arrived.
• During the statistical study, it was observed that the samples for each year were similar in terms of the behaviour of demographic, economic, educational and household composition variables, among others, which explain subjective poverty. However, the reason for poverty presents important changes and the logit model also demonstrates this, as there is a lower tendency to declare oneself poor between 2013 and 2015 than in 2011; and a greater tendency to declare oneself poor in 2012 than in 2011. This means that in spite of having the same social, demographic and economic behaviours, among others, to explain subjective poverty, there is an additional perception year after year that has a direct impact on the decision to declare oneself poor or not and can be attributed to changes in the Atlantic region as a result of public policies that generated favourable or unfavourable changes in households and individuals. This means that variations in the subjective poverty ratio indicator can be attributed to the impact of public policies in the Atlantic region on each household and each person, who maintain a different position and perception of subjective poverty year after year, even though they behave similarly in demographic, economic and household composition areas, among others.