Introduction
Little has been written about how design influences and persuades users’ judgment. The way in which people interact with a product, or choose it, is strongly affected by the way they are designed [16][5]. The goal of this investigation is to test how the way the options are displayed to users serves to influence the options they choose.
For this particular case, there are two different display concepts of interest:
Sequential Display: consists of a specific number of options, where each of them is shown to the user or consumer, one at a time. The target options, in this specific case, are the ones located on the first and last positions of the sequence; the products that are most likely to be chosen by users according to the Psychology of Choice theory (see figure 1).
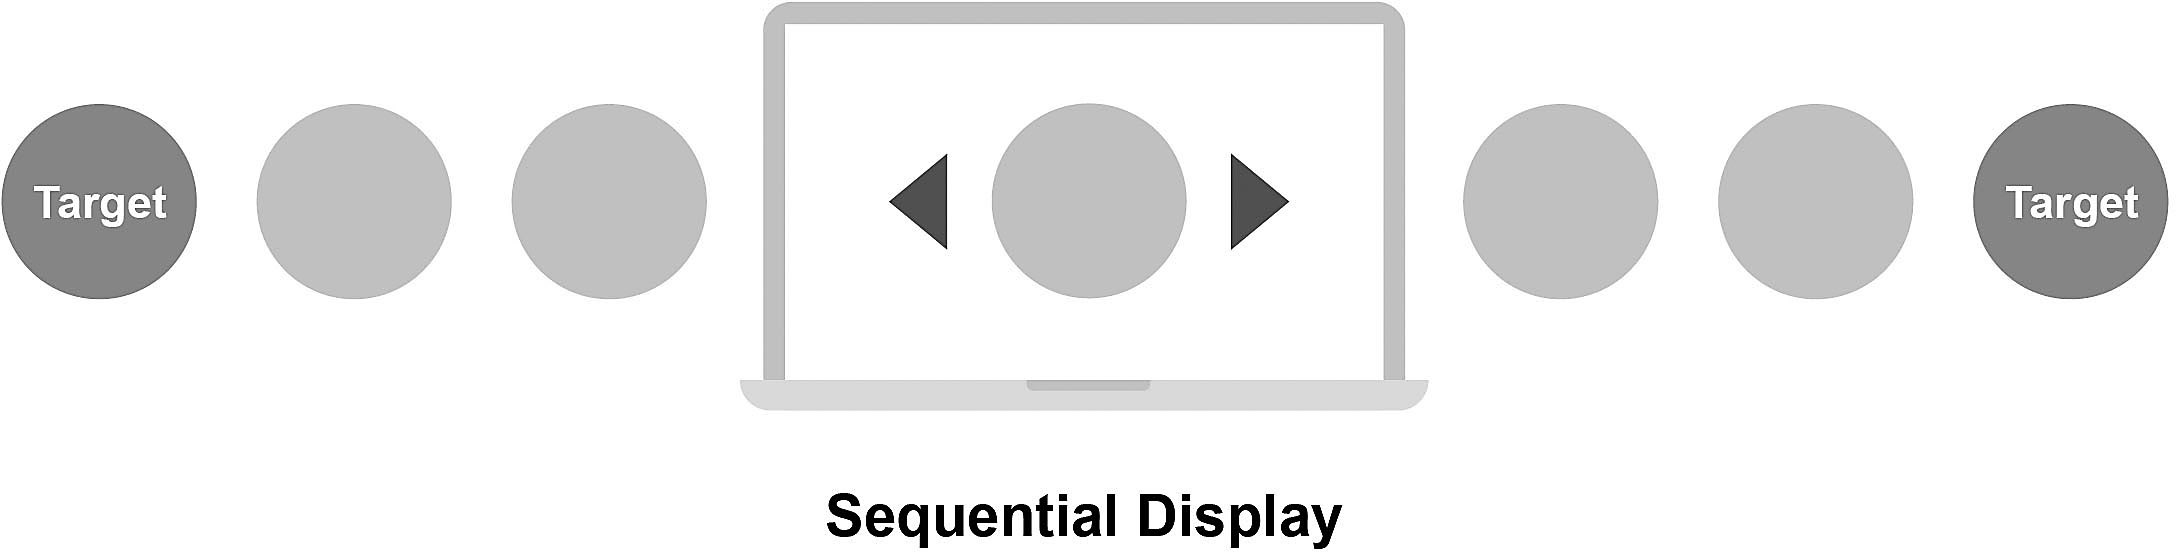 Figure 1
. Sequential Display concept
Figure 1
Figure 1. Sequential Display concept
Simultaneous
Display: this is a specific number of options that are displayed all at the same time to the user or consumer. For a simultaneous display of
options, the target products that are commonly
chosen according to Psychology of Choice are the options located on the center of the layout (see figure 2).
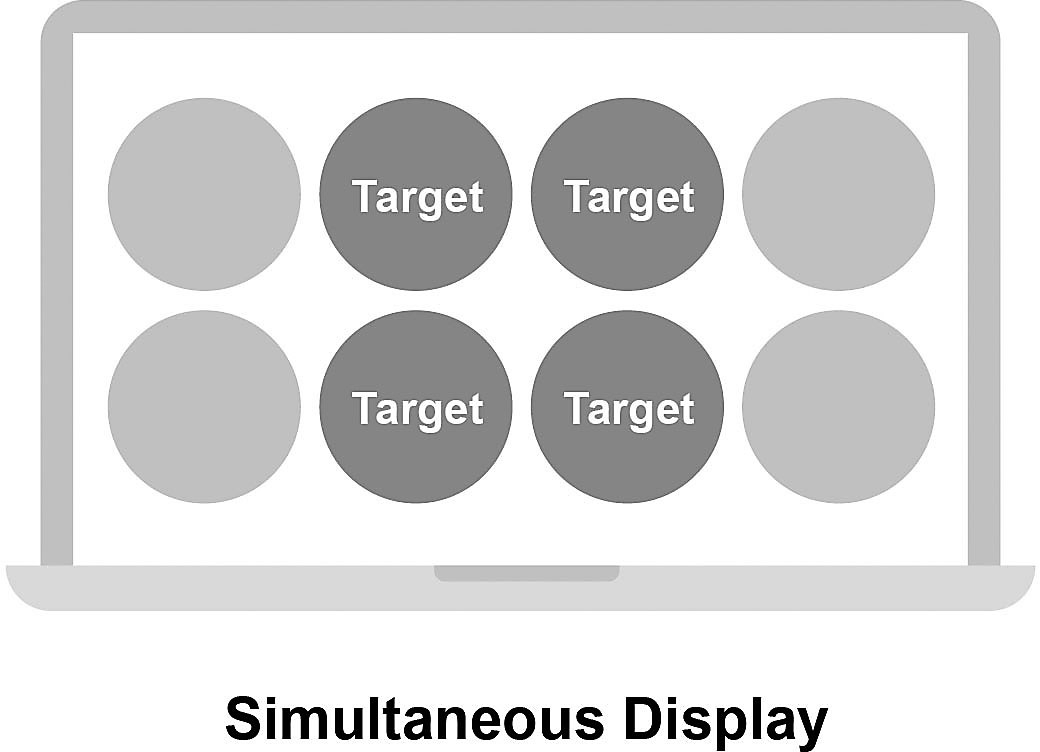 Figure 2.
 Simultaneous Display concept
Figure 2.
Figure 2. Simultaneous Display concept
Related Work
Consumer’s behavior is shaped by the product, just as the product is formed by the behavior of the consumer. As Robert Fabricant of Frog Design Inc. (2009) mentions, “designers are in the behavioral business” [1].
A human being believes they have rational behaviors, and that their decisions are based on logical and structured processes, but the reality is different: human behavior is fundamentally irrational, governed by emotional aspects that are difficult to explain according to logical explanations. This irrationality includes different areas of behavior, from the processes behind the purchase of movable or immovable property to the processes that define the ethical actions of people [3].
This irrationality, however, is far from being random and strictly personal but corresponds to a regular pattern with certain laws and principles. Dan Ariely [4] offers vast evidence to support the idea of systematically irrational behavior. For example, if we want to sell a television, the most convenient price policy is to place it next to a more expensive one and a cheaper one, since most people will seek to approach the “right one,” over the optimal or the most economically convenient. In the author’s words, “most people do not know what they want unless they see it in context” [3]. As clearly shown in the example, this context is designed so that people “take” the decision that was previously selected for them and that also makes them feel a greater satisfaction index.
It is crucial to have a vision of the users and their context when designing products to generate behavioral changes [5], both in physical and digital environments. User-Centered Design has numerous methods to provide this vision, but very little information is presented about the context related to behavioral changes [5] and the way in which its own methodology or elements achieve it. Interaction design is generally effective in influencing judgment and decision-making but is rarely recognized as such [21][1].
Hypothesis
Psychology of Choice says that, for Sequential Displays, users tend to choose the first or last options that are shown to them. Due to primacy and recency effects, users develop a stronger memory and preference for the first and last positions. Whereas with Simultaneous Displays, choosers tend to subconsciously gravitate toward central options [22].
In order to test these statements, an experiment is proposed based on two different layout designs: one with a sequential display of options, and another with a simultaneous display.
Four different orderings of the same series of products were established for each of the displays. For the sequential display (figure 3), six different brands of milk were chosen, unrelated to the Costa Rican population, where the tests were performed, and the selected photographs that represented the product were expected to have a similar composition and quality, in order to avoid the selection of the product being biased by brand preferences or photographic quality.
 Figure 3.
 Products selected for the Sequential Display tests
Figure 3.
Figure 3. Products selected for the Sequential Display tests
The same
product selection procedure was carried out for the simultaneous display
(figure 4), but the product chosen for this particular case
was bottled water and the display has eight items, arranged in two rows of four
products each.
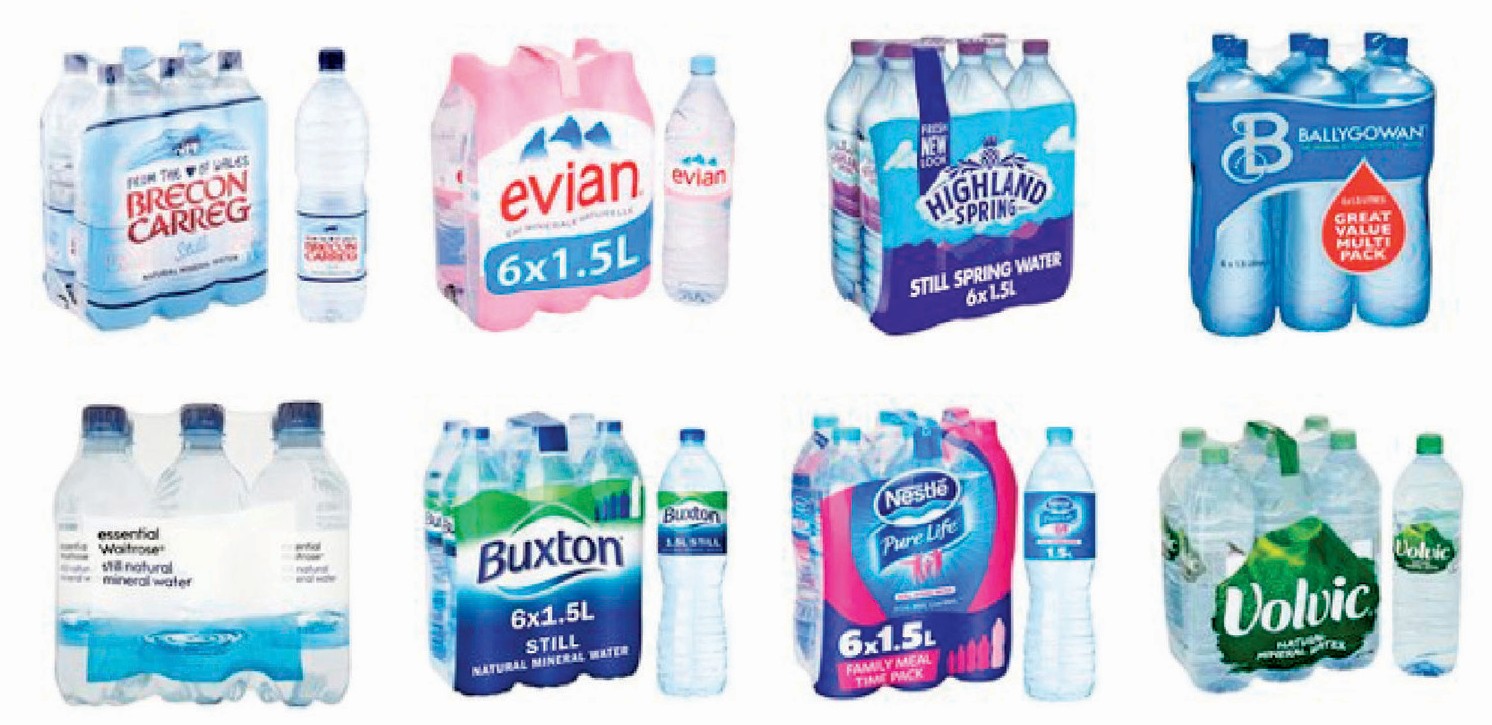 Figure 4.
 Products selected for the Simultaneous Display tests
Figure 4.
Figure 4. Products selected for the Simultaneous Display tests
Each tester was shown a sequential and a simultaneous display order and they were simply asked to choose a product from the selection.
Discussion and Results
One hundred and fifty-four testers, in ages between seventeen and forty-six years old, performed the tests for Sequential Display and Simultaneous Display.
In the Sequential Display tests, testers selected a product from a series of six different options, shown one at a time. The most selected products were the ones in position two, with forty-five “purchases” and position number five, with twenty-seven purchases, while the least selected product was the one in position three, with a total of seventeen “purchases.”
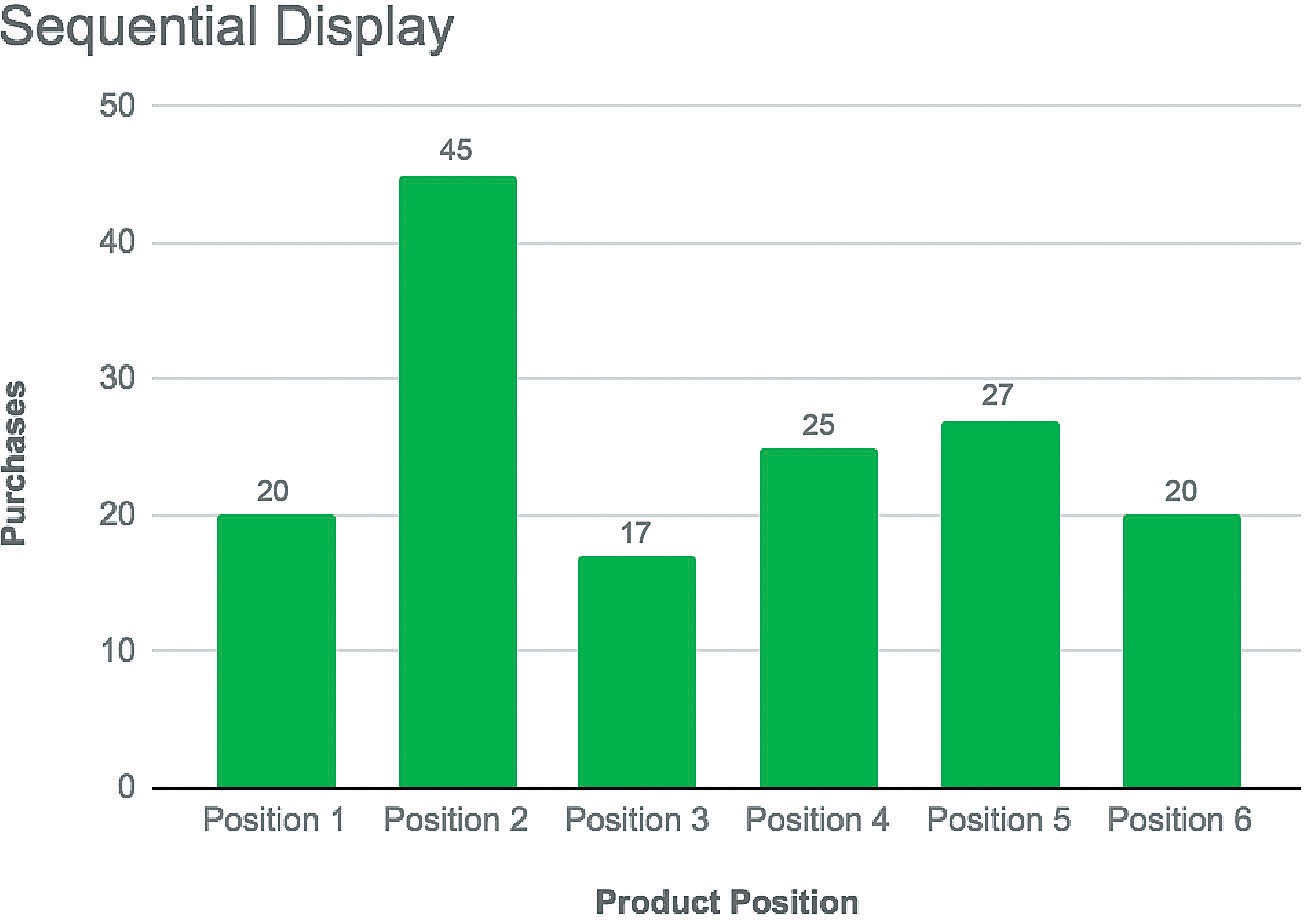 Figure 5
Results of Sequential Display tests based on product
positions
Figure 5
Results of Sequential Display tests based on product
positions
Therefore, it can be observed that the testers selected the products closest to the first and last position, but not the first and last products specifically, as indicated by the theory of the Psychology of Choice.
In the Simultaneous Display tests, the most selected products were those in the third and fifth positions of product orderings, with twenty-seven and twenty-four “purchases” respectively. The least favored positions by the testers for this display were: the product in the last position of product orderings, with eight “purchases” only, and the product in the first position with thirteen elections. It is clear, in this scenario, that users truly feel more attracted to the products at the center of the display and ignore the first and last positions.
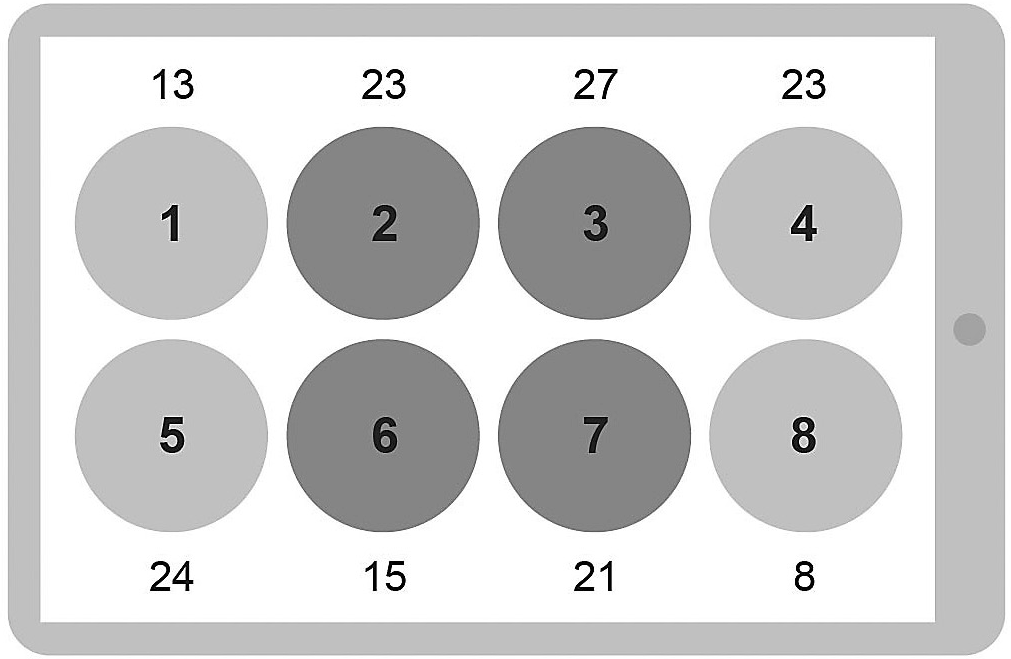 Figure 6.
 Position of products on screen and number of purchases on Simultaneous
Display tests
Figure 6.
Figure 6. Position of products on screen and number of purchases on Simultaneous
Display tests
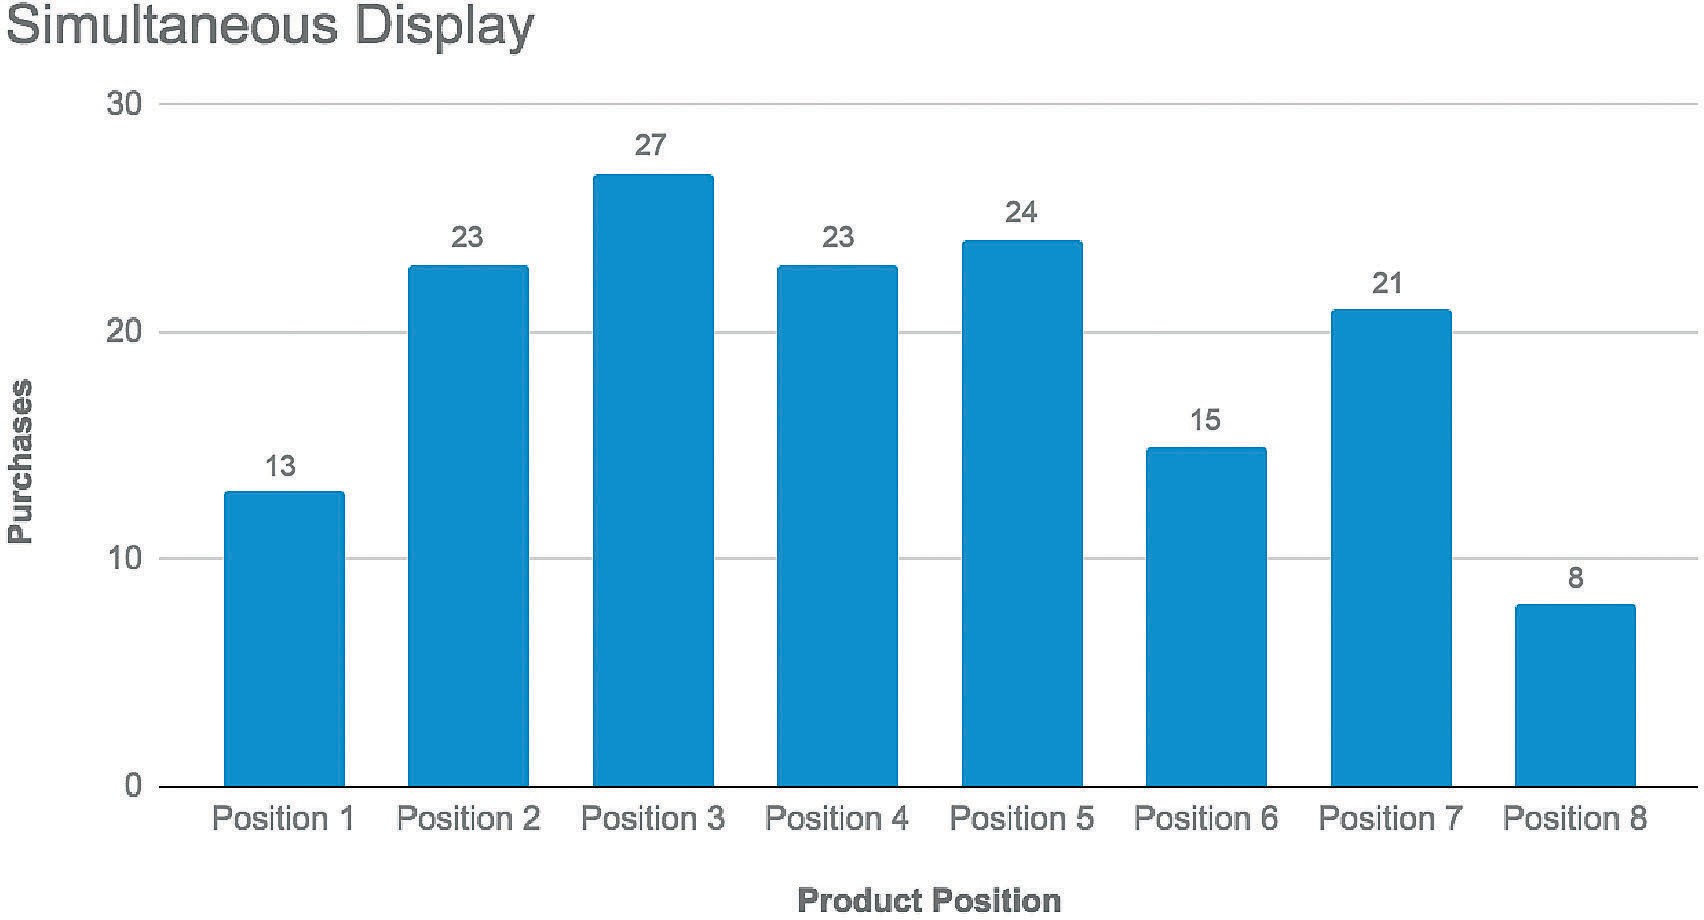 Figure 7.
 Results of Simultaneous Display tests based on product
positions
Figure 7.
Figure 7. Results of Simultaneous Display tests based on product
positions
For the Sequential Display tests, the products with the highest quantity of selections were the Product F and the Product B, but this greater quantity of “purchases” of each one of them occurred in the tests where they were in the second position of the product orderings, and this occurred in orderings one and four of the Sequential Display tests. This is evidence that the selection of products was made based on the position of the product and not on the product as such.
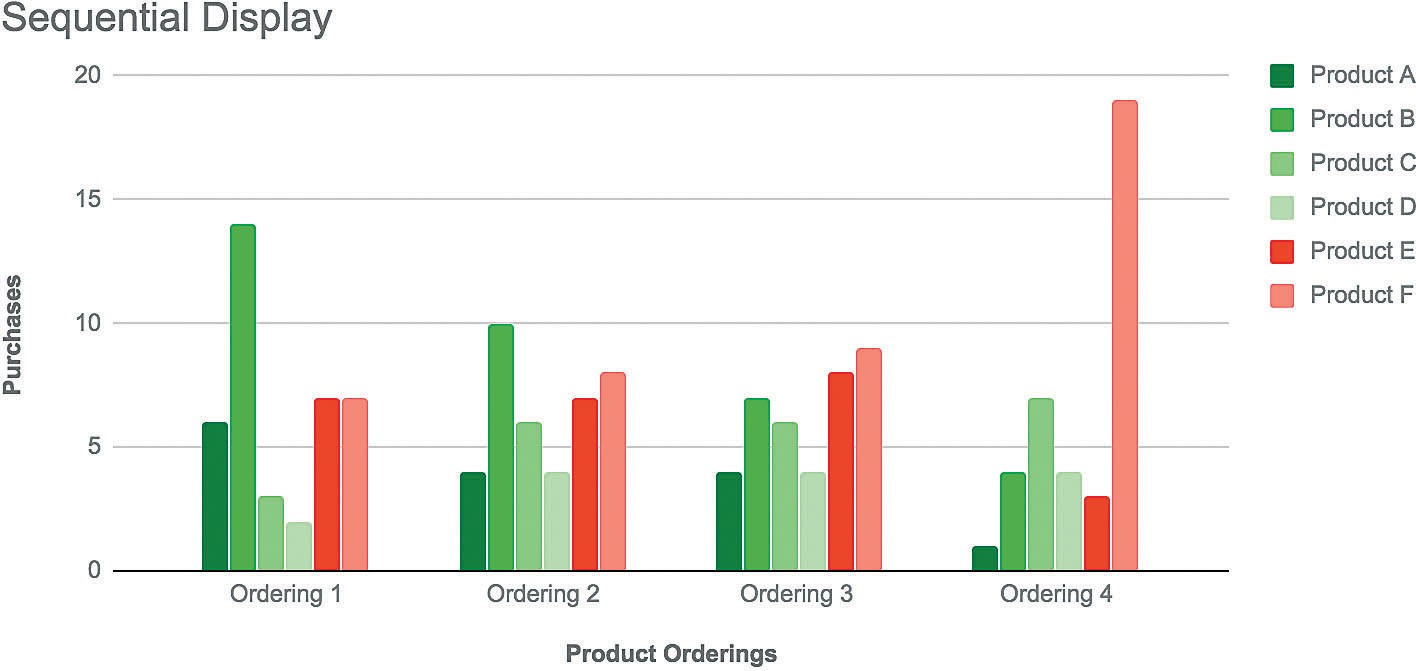 Figure 8.
 Results of Sequential Display tests based on product
selection
Figure 8.
Figure 8. Results of Sequential Display tests based on product
selection
On the Simultaneous Display tests, the products with more “purchases” from testers were the Product C and the Product A respectively. Product C obtained its mayor score when it was located in the third position of the product orderings, which happened on Ordering Three of the tests. Meanwhile, Product A was most successful on product orderings where it was placed on the fourth, fifth and seventh position, with the fifth position being the one with the least quantity of “purchases” (eight).
These results may indicate that testers were in some way attracted to the product itself (Product A), however, this did not affect the overall results of the tests, where the products located in the fifth position of the ordering were the second most chosen by testers, surpassed only by the products located in the second position of the ordering.
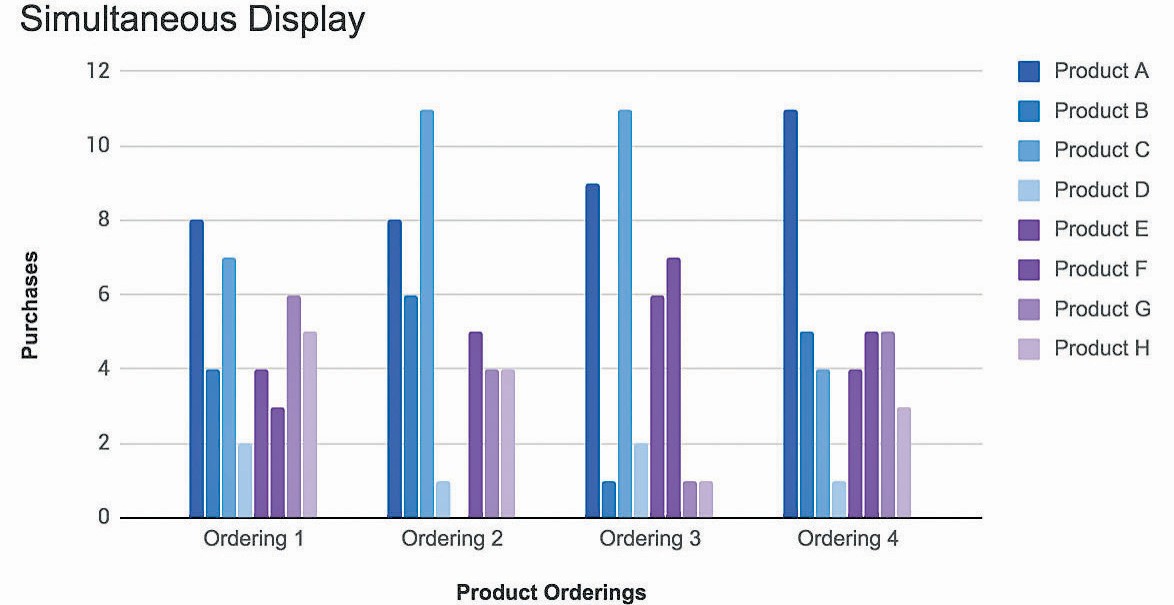 Fig. 9
. Results of Simultaneous Display tests based on product
selection
Fig. 9
Fig. 9. Results of Simultaneous Display tests based on product
selection
Conclusions
Users’ decisions made on Sequential and Simultaneous Display tests were mainly based, not on the product itself, but on its placement; since, for the positions mostly chosen by testers on both tests, the products were not in the same location in any of their four product orderings.
For the Sequential Display tests, the testers were mostly attracted by the products in the second and penultimate positions of the product ordering, therefore, the theory described by the Psychology of Choice cannot be 100% validated, so it may be necessary to run a larger quantity of tests with different types of products, to rule out the concern that the results may be biased by product preferences. However, the theory of Psychology of Choice, for this particular study, cannot be completely discarded, since the options selected by the testers remain positions close to the extremes.
In the Simultaneous Display tests, users were more attracted to the products located at the center of the display (third, fourth and fifth position) and ignored the first and last positions. It was observed that the testers had some attraction toward a particular product since it obtained high scores despite being in positions close to the extremes. This fact highlights the importance of a careful and well-thought-out decision, which prevents the results of the test from being affected.
Therefore, it can be said, that the affirmations made by Psychology of Choice about the decision- making processes, as related to the way we display options to the users or consumers, are valid for digital layout design and not only for decisions in physical environments like supermarkets.
Future Work
In relation to decision-making processes, based on the position of the elements in the layout, it would be interesting to test different variables that could demonstrate a deeper insight of the theory Psychology of Choice proposes. Such as:
If the quantity of objects shown on display affects the selection of products based on its positions, and if this amount influences the satisfaction level the “purchase” produces with testers.
The nature of the products shown: if they represent products of basic need or objects they could just want or desire.
Basing the Sequential Display tests on whether the decision should be taken immediately or in the future and seeing how this affects the selection of products.
Analyzing in Simultaneous Display tests, if the selection of objects based on their position on the layout is affected by how the options are displayed (single lined or multiple lines).
References
[1] D. Lockton, D. Harrison, and N. Stanton. The Design with Intent Method: A design tool for influencing user behaviour. Applied Ergonomics, 41, 2010, pp. 382–392.
[2] M. C. Munger. Persuasion, psychology and public choice. Journal of Economic Behavior & Organization, 80, 2011, p. 290–300.
[3] R. Mora. Acerca de la racionalidad y la irracionalidad de nuestras decisiones. Fractal: Revista de Psicología, 23(2), 2011, pp. 425–428.
[4] D. Ariely. Predictably Irrational. New York, United States: Harper Collins, 2008.
[5] Daae, J., Boks, C. (2005). A classification of user research methods for design for sustainable behaviour. Journal of Cleaner Production, 106, pp. 680–689.
[6] D. Y. Sleeth-Keppler and S. C. Wheeler. A multidimensional association approach to sequential consumer judgments. Journal of Consumer Psychology, 21, 2015, pp. 14–23.
[7] A. FishBach, R. K. Ratner, Y. Zhang. Inherently loyal or easily bored?: Nonconscious activation of consistency versus variety-seeking behavior. Journal of Consumer Psychology, 21, 2011, pp. 38–48.
[8] C. Messner and M. Wänke. Unconscious information processing reduces information overload and increases product satisfaction. Journal of Consumer Psychology, 21, 2011, pp. 9–13.
[9] R. M. Rohrer and E. Swing. Web-based information visualization. IEEE Computer Graphics and Applications: Information Visualization, 1997, pp. 52–59.
[10] J. L. Gabbard, D. Hix, and J.E. Swan II. User-centered design and evaluation of virtual environments. IEEE Computer Graphics and Applications: Virtual Reality, 1999, pp. 51–59.
[11] W. H. Rynson, F. Li, L. Li, T. L. Kunii, B. Guo, B. Zhang and M. Gutierrez. Emerging web graphics standards and technologies. IEEE Computer Graphics and Applications: Web Graphics Tutorial, 2003, pp. 66–75.
[12] L. Zhu, and B. L. Grabowski. Web-Based Animation or Static Graphics: Is the Extra Cost of Animation Worth It? Journal of Educational Multimedia and Hypermedia, 15(3), 2006, pp. 329–347.
[13] U. Bhandari, T. Neben, K. Chang, and W. Y. Chua. Effects of interface design factors on affective responses and quality evaluations in mobile applications. Computers in Human Behavior, 72, 2017, pp. 525–534.
[14] F. Hernández-Castro and J. Monge-Fallas. IUI – Interfaces Intangibles: el contexto. Memoria del Séptimo Congreso Internacional sobre Enseñanza de la Matemática Asistida por Computadora. 2011. Cartago, Costa Rica.
[15] A. Marcus. Metaphor design for user interfaces. CHI 98 Conference Summary on Human Factors in Computing Systems, 1998, pp. 129–130.
[16] D. A. Norman. The design of everyday things. New York, United States: Basic Books.1988.
[17] E. G. Nilsson. Design patterns for user interface for mobile applications. Advances in Engineering Software, 40, 2009, pp. 1318–1328.
[18] B. A. Myers and W. Buxton. Creating Highly-Interactive and Graphical User Interfaces by Demonstration. ACM SIGGRAPH Computer Graphics, 20(4), 1986, pp.249–258.
[19] J. Nielsen. Usability inspection methods. CHI ‘94 Conference Companion on Human Factors in Computing Systems. Boston, Massachusetts, USA, 1994, pp. 413–414.
[20] N. Perovic. Psychological pricing in modern retailing: the case of wine sector in hard-discounter chains of Russia. Journal of Economic Behavior, 4, 2014, pp. 83–95.
[21] J. Kolko. Thoughts on Interaction Design. Massachusetts, United States: Elsevier. 2007.
[22] N. Kolenda. Psychology of Choice, 2016, https://www.nickkolenda.com/pdf/psychology-of-choice.pdf?x78043
[23] N. Kolenda. Psychology of Pricing. 2016. https://www.nickkolenda.com/psychological-pricing-strategies/
[24] R. Haque. Investigations on User Interface for Online Shopping: Towards a Real Thing Based Design Approach. Other thesis, Concordia University. 2000.