

Relating goat milk production according to the Normalized Difference Vegetation Index and precipitations in the Chaco forest throughout the 2016-2018 period
Producción de leche caprina y su relación con el Índice de Vegetación de Diferencia Normalizada y las precipitaciones del Bosque Chaqueño Semiárido en el periodo 2016-2018.
Revista de la Facultad de Agronomía
Universidad Nacional de La Plata, Argentina
ISSN: 1669-9513
Periodicity: Semestral
vol. 120, no. 2, 2021
Received: 10/09/2020
Accepted: 19/09/2020
Corresponding author: tiedemannjl@gmail.com
Abstract: This work aimed to quantify and relate goat milk production and the Normalized Difference of Vegetation Index of the semiarid Chaco forest and the monthly average precipitation along the 2016-2018 period. The work was carried out in El Polear, in Santiago del Estero, Argentina. Even though the NDVI of the forest and its lower strata biomass productivity were affected by drought, its milk production curve remained unaffected. This may be due to the forest stability resulting from the deep rooted trees that includes, to the strategic displacement of the phenophase in its lower strata (broadleaves, herbaceous) in drought seasons and the adaptation to the changes in the goat diet selectivity before forage fluctuations. Winter NDVI peaks should be considered for new lines of research on their contribution to the energetic reserves of the goat component at the beginning of winter. Significant straight relationships (p<0.05) were found between the average goat milk production and the average monthly precipitation (r=0.64) as well as the NDVI and the semiarid Chaco forest (r=0.59). The resulting linear models involving goat milk production with both precipitation and NDVI had moderate and significant (p<0.05) explaining power (R2=0.41) and (R2=0.35), respectively. These models make the seasonal goat milk production predictable and the planning and the making decision process of both producers and the agroindustry easier.
Keywords: time series, seasonality, natural forest, drought, milk recording.
Resumen: El objetivo de este trabajo fue cuantificar y relacionar la producción de leche caprina con el Índice de Vegetación de Diferencia Normalizada del Bosque Chaqueño semiárido y la precipitación media mensual en el periodo 2016-2018. El estudio fue realizado en El Polear, Santiago del Estero, Argentina. El NDVI del bosque y la productividad de biomasa de sus estratos inferiores fueron afectados por sequía. La curva de producción de leche no fue afectada por la sequía, y se debe a la estabilidad del bosque con leñosas de raíces profundas, a los estratégicos desplazamiento de fenofases de los estratos inferiores del bosque (latifoliadas y herbáceas) en épocas de sequía y a la adaptación a cambios en la selectividad de la dieta de los caprinos ante fluctuaciones de forraje. Los picos de NDVI de invierno deberían ser considerados para nuevas líneas de investigación sobre el aporte de los mismos a las reservas energéticas del componente caprino ante la entrada del invierno. Significativas relaciones directas (p<0.05) fueron encontradas entre la producción media de leche caprina y la precipitación media mensual (r=0.64) y entre el NDVI del Bosque Chaqueño semiárido (r=0.59). Los modelos lineales resultantes, entre la producción de Leche caprina con la Precipitación y el NDVI tuvieron, respectivamente, moderado y significativo (p<0.05) poder explicativo (R2=0.41) y (R2=0.35). Los modelos lineales obtenidos posibilitan predecir la producción de leche estacional facilitando la planificación y toma de decisión tanto a productores como a la agroindustria.
Palabras clave: series temporales, estacionalidad, bosque nativo, sequia, control lechero.
INTRODUCTION
Dairy goat systems in Santiago del Estero belong to family farming and are characterized by small farms, low technological level and insufficient investment. The goat milk sector is mostly comprised of farms and microenterprises where family labor prevails (Pece et al., 2017). The predominant milk production system is semi-extensive; food is mainly based on open field grazing, using semi-arid the Chaco forest as the basis of food. These systems are limited by the instability and seasonality of their productions, as well as by poor and inadequate marketing in most of the cases (Pece et al, 2017). Goat production systems adapt well to arid and semiarid zones (Salvador & Martinez, 2007) so that they have an abundant natural ecological niche in Northwest Argentina (Frau et al., 2007, 2012). Alike other ruminant species’, goat milk production and composition is affected by such factors as feeding, race, management, climate (Frau et al., 2007). Thus knowing its productive behavior under the local conditions becomes necessary
According to Martinez & Suarez (2019), goats are adapted to the grazing and browse of herbaceous and shrubby species though the latter are the preferred. However, they exhibit changes in their dietary selectivity in terms of the seasonal forage availability. In this sense, the biomass productivity of the photosynthetically active vegetation demarks the growth season and is directly related to the distribution of seasonal precipitations, particularly in arid and semiarid zones (Le Houerou et al., 1988).
The increase of biomass of the seasonally active vegetation is the seasonal net aerial primary productivity (NAPP) (Field et al., 1995) and can be estimated using the time series of the Normalized Difference Vegetation Index (NDVI) (Rouse et al., 1974). Thus, Zerda & Tiedemann (2010) determined that the semiarid Chaco forest’s NDVI (Sensor Vegetation) follows the regional seasonal model of precipitations defined in a marked summer humid season with high values of NDVI and in a winter dry season with low values of NDVI. In turn, Tiedemann et al. (2018, 2019) found remarkable seasonality (September to May) and a goat milk production highly dependent upon the seasonal forage biomass productivity (December to May) of the semiarid Chaco forest.
Determining the relationships existing between the goat milk production and the NDVI in the forest with weather variables such as precipitations make it possible to generate predictive models to seasonal milk production which will favor milk producer and milky industry’s income planning.
The objective of this work was to relate goat milk production to the Normalized Difference Vegetation Index of the Chaco Forest and to the average precipitation in the 2016-2018 period.
MATERIAL AND METHODS
Study area
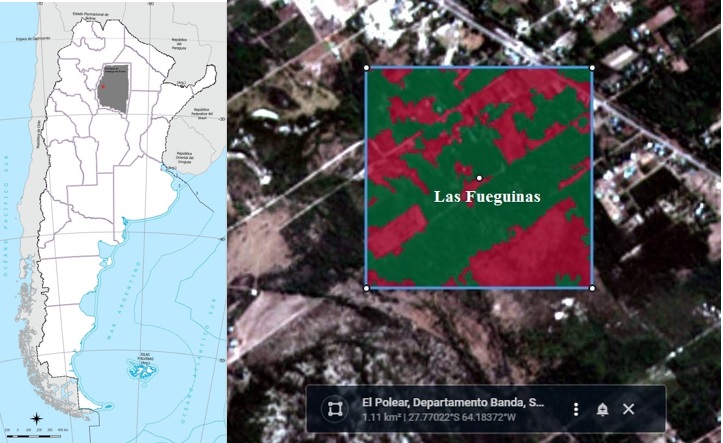
he study was conducted in a goat farm, located in El Polear, La Banda, Santiago del Estero, Argentina (Lat -27.769 y Long -64.182) (Figure 1). The farm belongs to the family farming system and there is no control of production, especially in aspects such as feeding, replacement or control of cattle.
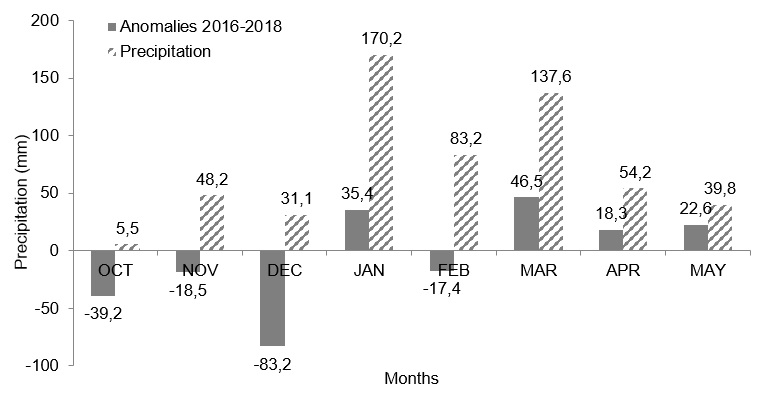
According to the National Weather Service (2020), the rainy season starts in October (44.7 mm) and finishes in April (35.9 mm); the accumulated annual precipitation reaches 629 mm, its maximum values occur in January (134.8). The average monthly temperature in January is 26.7 °C (summer) and 12.7° in July (winter). From decades now, the regions suffers from recurrent extreme climatic events like drought; according to Anyamba et al. (2002) the ENSO (El Niño/South Oscilation) heating has generated dramatic changes in the interannual precipitation pattern resulting in precipitations above the regular records in some regions and below such values in others. This becomes apparent in the abnormal precipitations occurred in the area under study within the period indicated (Figure 2).
Climatic data
The climatic data of the Santiago del Estero Aero-Station (Lat -27.76; Long -64.32) were provided by the Weather Information Center of the National Weather Service (2020). The monthly average precipitation for the period extending from August 2016 to July 2018 was accumulated to generate 12 values for the monthly accumulated precipitation (PP) (from August to July) (Figure 3). The slopes of the precipitation line were determined using simple linear regression (Lee & Wong, 2001; Wang et al., 2003).
Monthly average precipitation anomalies were made equation 1:
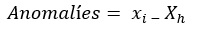 [1]
[1]with xi the average rainfall being a month and Xh the historical average precipitation (1961-2020) of that month.
Vegetation
According to the Secretary for the Environment and Sustainable Development of the Argentine Republic (2005), the predominant vegetation is the semiarid, xerophytic and open Chaco forest. The climax community or higher stratum is the forest of Schinopsis quebracho colorado and Aspidosperma quebracho. The medium stratum counts on species such as the Zizyphus, Cercidium, Celtis, Caesalpinea and Prosopis, among others. The shrubby stratum comprises species like the Acacia, Mimosa, Geoffroea, Prosopis, Atamisquea, among others, and herbaceous stratum including gramineus such as the Setaria, Gouinia, Digitaria, Eragrostis, Gymnopogon, Panicum, Heteropogon, Trichloris, Chloris, and dicotyledon like Ruellia, Justicia, Holocheilus, Trixis, Hyptis, among others.
Cattle and Milk recording
Cattle is composed by 85 Anglo Nubian x Criolla and Saanen x Criolla crossbred goats. The animals graze in areas with no division. While milking, goats have a supplement consisting of 390 g of alfalfa (Medicago sativa) and 265 g of maize (Zea maiz) per animal.
Milk production was determined by milk recording. The experiment was carried out from July 2016 to July 2018 and milk recording was performed by three supervisors according to the recommendations for A4 (ICAR, 2003). The milk obtained from each animal was weighed and registered.
A total of 1280 lactations were used from 85 healthy goats. The first control was carried out between days 10 and 20 after birth, with lactation being considered finished when milked milk was below 200 g.dia-1. Milk production was estimated by the Carré adaptation to the method of Fleischmann, since it is the ideal for the conditions of this experience (Vega et al., 1999).
The goat milk production under study was timely accumulated to generate 12 values monthly accumulated (from August to July).
The slopes of the milk production curves were determined using simple linear regression (Lee & Wong., 2001; Wang et al., 2003).
Time series NDVI Data
The time series of the Normalized Difference Vegetation Index (NDVI) of the Sentinel 2 Satellyte (MSI L2A) used in this work belong to the Earth Observing Systems-NASA project (https://eos.com/landviewer/). The NDVI (Rouse et al., 1974) was derived from equation 2.
 [2]
[2]The NDVI of the area of the Chaco forest being studied was extracted using the polygonal vector (1.1 km2) and resulted in 55 daily values of the NDVI in the period that ranges from 08.26.2016 to 07.27.2018. The residual noise of the NDVI’s time series was minimized using the average mobile softening technic (Atkinson et al., 2012). The NDVI values oscillate in the range of -1.0 and 1.0, the pixels with values equal to or less than one standard deviation were masked, these are related to bodies of water, saline soils and bare soil. The NDVI’s time series of the forest was averaged monthly and gave 12 NDVI MEAN (from August to July). The slopes of the NDVI line were determined using simple linear regression (Lee & Wong., 2001; Wang et al., 2003).
Statistical analysis
The variables were related by means of the Parson’s correlation coefficient (r) (Lee & Wong., 2001). The accumulated milk production (T-MILK) is the dependent variable y, and the NDVI and the PP are the independent variables x which were related by means of the simple linear regression method (α 0.05). The lineal models were tested based on the best adjustment of the coefficient of determination (R2), and by the lack of adjustment test which is an estimation of regardless the model (Balzarini et al., 2020).
RESULTS AND DISCUSSION
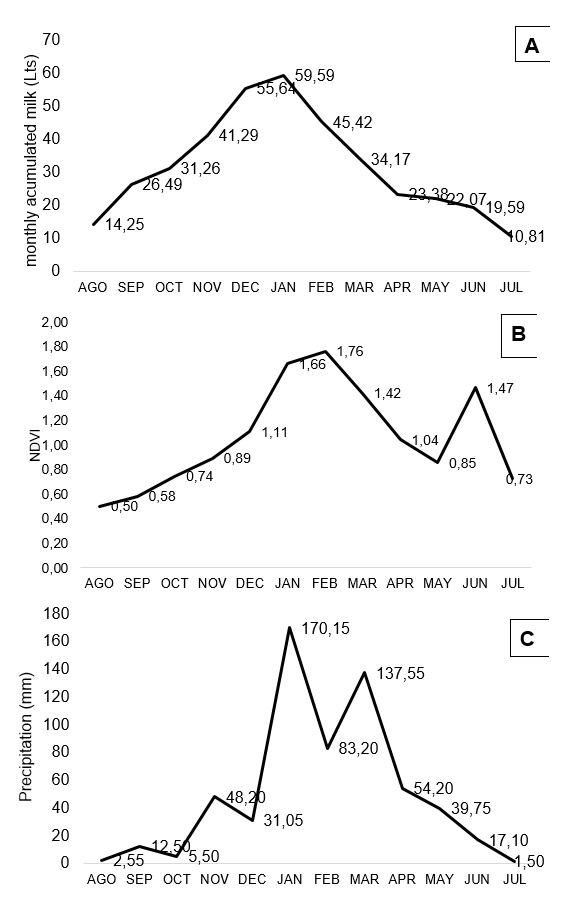
The accumulated milk yield (Y) along the period was 767.9 kg. Y has a very high coefficient of variation (57.06%), which coincides with other studies carried out in the region in establishments with similar breeding characteristics (Funes Álvarez & Paz Mótola, 1998; Paz et al., 2007); these results were the expected due to heterogeneity in feeding, structure and lack of control of the herd. More controlled productions present less variations (Garcés et al., 2004). Milk production (Figure 3) begins in August with a milk production of 28.5 kg and reaches the maximum value in January with 119.18 kg, at a rate of 18.5 kg.month-1 (R2=0.97). The production curve decreases from January to July at a rate of -15 kg.month-1 (R2=0.92). Higher milk production in summer compared to milk obtained in winter is common in goat production and has been reported by other authors (Chagra Dib et al., 2005). In winter, the natural pasture is in a state of vegetative rest and presents very low forage quality. In extensive goat production systems in the tropics and subtropics, seasonal climatic changes have a direct influence on milk production, reflected in the seasonal supply and availability of the pasture. (Chagra Dib et al., 2005).
The NDVI of the forest marks the start of either the growth season or the biomass production from August to December (Figure 3 B) at a slow growth rate of 0.15 NDVI per month (R2 0.98). The abnormal precipitations or drought in October (-39.2 mm), November (-18,5 mm), and mainly in December (-83.2 mm) affected severely green biomass production of the forest (Figure 2 and Figure 3 C). The initial increase of the NDVI would be related to an initial thermal regrowth of the forest; in this sense, Wang et al. (2003) determined strong straight relationships between the NDVI and the temperature at the beginning of the growth season. With the maximum peak of precipitation occurring in January (170.2 mm) (Figure 2 and Figure 3 C) the NDVI reaches the maximum peak in February (1.8 NDVI) and a December-February growth rate of 0.32 NDVI per month (R2=0.86) (Figure 3B). The senescence phase of the forest NDVI starts from February to May and shows a negative slope of -0.3 NDVI per month (R2=0.98) (Figure 3B). The biomass productivity peak occurred from May to June highlights due its growth rate of 0.6 NDVI per month (R2=0.99). According to Tiedemann (2011), the maximum peak of the Chaco Forest’s NDVI in humid periods occurs in May while in drought periods it does in July.
The maximum peak of production (15.52%) in the lactation curve occurred in January (Figure 3 A); this coincides with what Tiedemann et al. (2018, 2019) informed for the same region. The milk production curve was not affected by drought that is due to two factors: the one is the stability and biomass production of the forest because of the predominance of woody species of deep roots (Wang et al., 2003) and the strategic displacements of its lower strata phenophases (broadleaves and herbaceous) in drought times (Ray, 1995). The other is, according to Garcia Gonzalez & Cuartas (1992) the changes occurred in the feeding regime on the part of the goats during times of resource scarcity resulting in two behaviors: that of specialization in a given plant resource or the generalist grazing/browsing behavior. Degano et al. (2000) and Catan & Degano (2007) determined that the goat diet in the semiarid Chaco forest in the humid season is composed by 46% of broadleaves while in the dry season mainly by woody species and large amounts of woody mulch and leaf litter. In turn, Huston & Pinchak (1991) remarked that goats prefer dicotyledon leaves (herbaceous and woody) and that their proportions increase in the diet in drought times. Additionally, Pinto et al. (2019) in evaluating the forage offer of herbaceous, foliage and litter from a forest in Formosa, Argentina, determined that the highest availability of forage occurs in winter (439,44 kg.m.ha-1) and at the end of fall and during winter, deciduous trees make a large contribution of forage biomass as leaf litter.
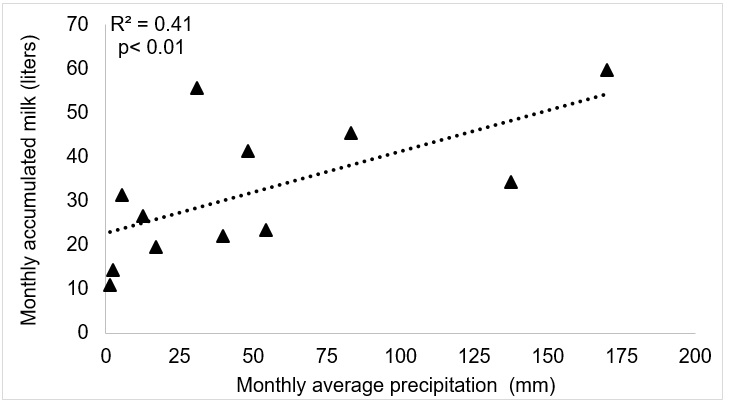
Significant direct relationships between the monthly accumulated milk and the monthly average precipitation (r=0.64; p<0.001) were found. The lineal model obtained (Equation 3) needed no adjustment and showed moderate to significative explaining power (R2=0.41; p<0.01) (Figure 4).
 [3]
[3]Preliminary works by Tiedemann et al. (2018) in the Robles Department, Santiago del Estero, Argentina, found strong and significant direct relationships (p<0.01) between the integrate goat milk production of the 2003-2009 period as to the average temperature (r=0.92) and the average precipitation (r=0.79) and inverse to Relative Humidity (r=-0.73).
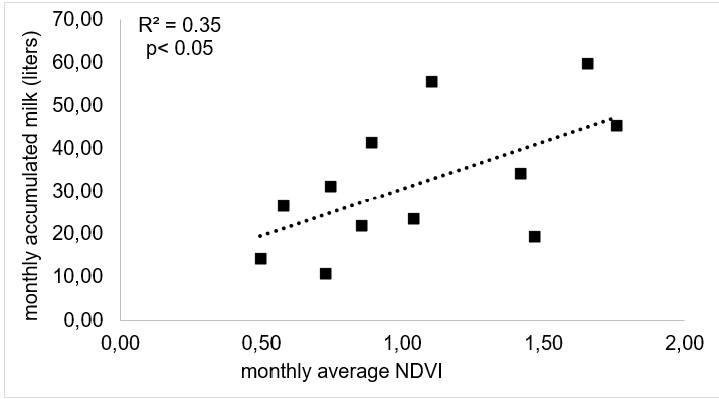
Significant direct relationships between the monthly accumulated milk and the monthly average NDVI of the semiarid Chaco forest were found (r=0.59; p<0.05). The lineal model obtained (Equation 4) needed no adjustment and showed moderate and significative explaining power (R2=0.35; p<0.05) (Figure 5).
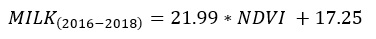 [4]
[4]
In turn, Tiedemann et al. (2019) related the September to February integrated goat milk production to the December to May NDVI (Sensor MODIS) of the Chaco forest. They found strong and significant non lineal relationships (R2=0.97; p<0.05) in the 2003-2009 period. The results obtained showed the marked dependence of goat milk production upon seasonal precipitations and upon the forage productivity of the semiarid Chaco forest. In this sense, Zerda & Tiedemann (2010) determined strong and significant direct relationships between the NDVI (Sensor Vegetation) of the forest corresponding to the twelve months of the year and the precipitations of September, October, November, December, March, April and May with a medium coefficient of determination (R2=0.77). The best relationship was that involving October precipitation with the NDVI of the forest of all the months of the year with a medium coefficient of determination (R2=0.96; p<0,001).
These results were corroborated by Tiedemann (2011) who related the NDVI (Sensor VEGETATION) of the Chaco forest in October and November to October (r=0.96; p<0.01) and November (r=0.98; p<0.01) precipitations.
CONCLUSIONS
The NDVI of the forest and, consequently, its total productivity was strongly affected by drought at the beginning of the growing season. The lactation curve was not affected by drought due to the stability of the deep-rooted woody species, the strategies of the lower strata facing drought and the adaptation to changes in the goat diet selectivity before forage fluctuations.
Winter NDVI peaks should be considered for new lines of research on their contribution to the energy reserves of the goat component at the beginning of wintertime.
The lineal models obtained make seasonal milk production predictable that facilitates planning and the making-decision process of both the producer and the agroindustry.
BIBLIOGRAFY
Anyamba, A, J.C. Tucker & R. Mahoney. 2002. From El Niño to La Niña: Vegetation Response Patterns over East and Southern Africa during the 1997–2000 Period. Journal of climate 15: 3096-3103.
Atkinson, P.M., C. Jeganathan, J. Dash & C. Atzberger. 2012. Inter-comparison of four models for smoothing satellite sensor time-series data to estimate vegetation phenology. Remote Sensing of Environment 123: 400–417.
Balzarini, M.G., L. Gonzalez, M. Tablada, F. Casanoves, J.A. Di Rienzo & C.W. Robledo. 2020. Manual del Usuario Infostat. Disponible en: https://www.researchgate.net/publication/283491340_Infostat_manual_del_usuario Último acceso: Mayo 2020.
Catan, A. & C.A.M. Degano. 2007. Composición botánica de la dieta de caprinos en un bosque del Chaco Semiárido (Argentina). Quebracho 14:15-22.
Chagra Dib, E.P., T.A. Vera, H. D. Leguiza & C. Valdivia. 2005. Factores que inciden en la producción de leche de cabras criollas en sistemas de manejo extensivo. XIX Reunión Asociación Latinoamericana de Producción Animal, Tampico, México. 5 pp. Disponible en: https://www.researchgate.net/profile/Tomas_Vera/publication/303693437_ /links/574de64108ae061b33038669.pdf Último acceso: Junio 2020.
Degano, C.A.M., A. Catan, R. Renolfi, D. Werenitzky & S. Correa. 2000. Dieta del Ganado caprino a monte, bajo tres cargas distintas de animales. Ecología 14: 251-257.
Field, C.B., J.T. Randerson & C.M Malmstriik. 1995. Global Net Primary Production: Combining Ecology and Remote Sensing. Remote Sensing Environment 51: 74-88.
Frau, F., N. Pece, G. Font & R. Paz. 2007. Calidad composicional de leche de cabras de raza Anglo Nubian en Santiago Del Estero. Tecnología Láctea Latinoamericana Nº 48. 4 pp
Frau, F., G. Font, R. Paz & N. Pece. 2012. Composición Físico-Química Y Calidad Microbiológica De Leche De Cabra En Rebaño Bajo Sistema Extensivo En Santiago Del Estero (Argentina). Revista de la Facultad de Agronomía 111(1).
Funes Álvarez, R. & R. Paz Mótola. 1998. Metodología para la tipificación de la producción lechera de caprinos en Santiago del Estero (Argentina). Archivos de zootecnia 47: 649–58.
Garcés, R., J. Boza, P. Acevedo, E. Brandl, R.M. Bruckmaier & J.L. López. 2004. Índice de persistencia y descripción de los primeros 100 días de cabras Sananen primíparas y multíparas mantenidas en confinamiento. Agricultura Técnica 64(3): 319–326.
Garcia Gonzalez, R. & P. Cuartas. 1992. Food habits of Capra pyrenaica, Cervus elaphus and Dama dama in the Cazorla Sierra (Spain). Mammalia 56(2): 195-202.
Huston, J.E & W.E Pinchak. 1991. Range Animal Nutrition. In: Grazing management. An ecological perspective. R.K. Heitschmidt & J.W. Stuth (Ed). Timber Press, Portland, Oregon, USA. pp. 27-63.
International Committee for Animal Recording(ICAR). 2003. Guidelines approved by the General Assembly held in Interlaken, Switzerland. 19–39 pp.
Lee, J. & D.W. Wong. 2001. Statistical Analysis with Arcview Gis. John Wiley & Sons, INC. New York, USA. 192 pp.
Le Houerou, H.N., R.L Bingham & W. Skerbek. 1988. Relationship between the variability of primary production and the variability of annual precipitation in world arid lands. Journal of Arid Environments 15: 1-18.
Martínez, M.G. & V.H Suárez. 2019. Lechería Caprina: producción, manejo, sanidad, calidad de leche y productos. Ed. INTA. 170 pp. www.inta.gob.ar/sites/default/files/inta_lecheria_caprina.pdf. Ultimo acceso: enero de 2020.
Paz, R.G., J. Togo & C. López. 2007. Evaluación de parámetros de producción de leche en caprinos (Santiago del Estero, Argentina). Revista Científica de la Facultad de Ciencias Veterinarias de la Universidad del Zulia 17(2): 161–165.
Pece, N., F. Frau & G. Font De Valdez. 2017. Cuenca lechera caprina de Santiago del Estero: Producción primaria e industrial. Desarrollo de nuevos productos lácteos. In: Aportes de la FAYA (UNSE) para el desarrollo agropecuario y agroindustrial del NOA. Tomo II: Cadena de valor en sistemas pecuarios y otros trabajos. 1 ed. A. Albanesi, J. Domínguez Núñez, S. Helman, M. Nazareno & S. Del Rodriguez (Ed). Orientación Grafica Editora, Santiago del Estero, Argentina.
Pinto, J.J., N.B. Varlamoff., G.R. Bono & V.S. Borelli. 2019. Determinación de la disponibilidad y análisis nutricional del forraje en un bosque xerofítico del Chaco Semiárido, departamento Bermejo, Formosa, Argentina. Revista Agronómica del Noroeste Argentino 39:31-35.
Ray, T.W. 1995. Remote Monitoring of Land Degradation in Arid/Semiarid Regions. Thesis by Doctor of Phillosophy, California Institute of tecnology, Pasadena, California. 371 pp.
Rouse, J.W., R.W. Haas, J.A. Schell, D.W. Deering & J.C. Harlan. 1974. Monitoring the Vernal Advancement and Retrogradation (Greenwave Effect) of Natural Vegetation. NASA/GSFCT Type III Final report, Greenbelt, MD, USA.
Salvador, A. & G. Martínez. 2007. Factores que Afectan la Producción y Composición de la Leche de Cabra: Revisión Bibliográfica. Revista de la Facultad de Ciencias Veterinarias, UCV, 48(2): 61-76.
Secretaria de Ambiente y Desarrollo Sustentable de Argentina. 2005. Informe Regional Parque Chaqueño. En: Primer inventario nacional de bosques nativos, Proyecto Bosques Nativos y Áreas protegidas, Argentina. 126 pp. Disponible en: https://www.argentina.gob.ar/sites/default/files/primer_inventario_nacional_-_informe_nacional_1.pdf Último acceso: Julio 2019.
Servicio Meteorológico Nacional. 2020. Centro de Información Meteorológica, Servicios climáticos. Disponible en: https://www.smn.gob.ar/descarga-de-datos Último acceso: Noviembre 2019.
Tiedemann, J.L. 2011. Dinámica espacial y temporal del Índice de Vegetación de Diferencia Normalizada en Santiago del Estero. Tesis Doctoral. Universidad Nacional de Córdoba, Córdoba, Argentina. 157 pp. Disponible en: https://fcf.unse.edu.ar/archivos/tesis/Tiedemann_res_tesis.pdf Último acceso: Mayo 2020.
Tiedemann, J.L., F. Frau & N. Pece. 2018. Producción de leche caprina estacional en función del Índice de Vegetación de Diferencia Normalizada y variables climáticas. XIII Jornadas de Ciencia y Tecnología de las Facultades de ingeniería del NOA, Santiago del Estero, Argentina. 341 pp. Ultimo acceso: marzo 2020.
Tiedemann, J.L., F. Frau & N. Pece. 2019. Producción estacional de leche caprina en función del Índice de Vegetación de Diferencia Normalizada del Bosque Chaqueño Semiárido. XIV Jornadas de Ciencia y Tecnología de las Facultades de ingeniería del NOA, Tucumán, Argentina. 335 pp. Disponible en: www.researchgate.net/publication/342098114. Ultimo acceso: marzo de 2020.
Vega, J.F., F. Peña & M. Sánchez. 1999. Estimación de la producción de leche por el método Fleischmann en caprinos. Archivos de Zootecnia 48: 347-350.
Wang, J., K.P. Price & P.M. Rich. 2003. Temporal responses of NDVI to precipitation and temperature in the central Great Plains, USA. International Journal of Remote Sensing 24(11): 2345-2364.
Zerda, H.R. & J.L. Tiedemann. 2010. Dinámica temporal del NDVI del bosque y natural en el Chaco seco de la Provincia de Santiago del Estero, Argentina. Ambiencia 6: 13-24.
Author notes
tiedemannjl@gmail.com

