Servicios
Servicios
Buscar
Idiomas
P. Completa
FORECASTING STORAGE CAPACITY USING EXPONENTIAL SMOOTHING METHOD
Vinícius de Arruda Silva; Carol Cardoso Moura Cordeiro; Marina Leite de Barros Baltar;
Vinícius de Arruda Silva; Carol Cardoso Moura Cordeiro; Marina Leite de Barros Baltar; Juliane Érika Cavalcante Bender; Juliano Bortolini
FORECASTING STORAGE CAPACITY USING EXPONENTIAL SMOOTHING METHOD
Revista Produção e Desenvolvimento, vol. 6, no. 1, 2020
Centro Federal de Educação Tecnológica Celso Suckow da Fonseca
resúmenes
secciones
referencias
imágenes

Abstract: ABSTRACT

Purpose: Analysis of the production and storage capacity of soybeans and corn in Mato Grosso (Brazil) and its projections until the year 2022.

Methodology/Approach: Data regarding Mato Grosso’s soy and corn production, area planted, and storage and yield capacity were organized for the years 1995 to 2018. Exponential smoothing models were then used to preview the grain storage balance for the period between 2019 and 2022.

Findings: Grain production is expected to grow 11.9%, while the increase in storage capacity is expected to be 9.7%. Therefore, the results showed that the gap between production and storage may increase by 118%, between the harvests of 2017/18 and 2021/22. Moreover, the deficit in storage capacity will represent 53% of the total harvest in 2021/22.

Research Limitation/implication: Interferences in the analyzed variables, such as economic, environmental, or technological events, may affect the forecasts’ outcomes.

Originality/Value of paper: The estimation combines exponential smoothing models with a non-parametric resampling technique.

Keywords: agribusiness, logistics bottlenecks, agriculture infrastructure.

Resumo: PREVISÃO DA CAPACIDADE DE ARMAZENAMENTO USANDO O MÉTODO DE SUAVIZAÇÃO EXPONENCIAL

Objetivo: Análise da produção e capacidade de armazenamento de soja e milho em Mato Grosso (Brasil) e suas projeções até o ano de 2022.

Metodologia/Abordagem: Organizou-se os dados da produção área plantada, produtividade de soja e milho para o estado de Mato Grosso, bem como a capacidade de armazenamento, para o período entre 1995 e 2018. Posteriormente, modelos de suavização exponencial foram utilizados para prever o saldo de armazenagem de grãos no estado de 2019 a 2022.

Conclusões: Espera-se um crescimento de 11,9% na produção de grãos e apenas 9,7% de incremento da capacidade de armazenagem, conforme projeções. Nesse sentido, os resultados evidenciaram que o distanciamento entre produção e armazenagem poderá crescer 118% entre a safra de 2017/18 e 2021/22. Ademais, o déficit será de 53% da safra total em 2021/22.

Limitação/implicação da pesquisa: Intervenções nas variáveis analisadas, tais como eventos econômicos, ambientais, ou tecnológicos, poderão afetar o resultado das previsões.

Originalidade/valor do trabalho: O trabalho combina os modelos de suavização exponencial com a técnica não paramétrica de reamostragem bootstrap.

Palavras-chave: agronegócio, gargalos logísticos, infraestrutura agrícola.

Carátula del artículo

Markets and Production Management

FORECASTING STORAGE CAPACITY USING EXPONENTIAL SMOOTHING METHOD

Vinícius de Arruda Silva
Universidade Federal de Mato Grosso, Brasil
Carol Cardoso Moura Cordeiro
Universidade Federal de Mato Grosso, Brasil
Marina Leite de Barros Baltar
Universidade Federal de Mato Grosso, Brasil
Juliane Érika Cavalcante Bender
Centro Federal de Educação Tecnológica de Minas Gerias, Brasil
Juliano Bortolini
Universidade Federal de Mato Grosso, Brasil
Revista Produção e Desenvolvimento
Centro Federal de Educação Tecnológica Celso Suckow da Fonseca, Brasil
ISSN: 2446-9580
Periodicity: Frecuencia continua
vol. 6, no. 1, 2020

Received: 16 May 2020

Accepted: 27 October 2020

Published: 30 October 2020


1. INTRODUCTION

Brazil is a world leader in the international grain trade, second country in soybean cultivation (Embrapa, 2019) and third in corn production (Conab, 2019c). In the 2018/2019 harvests, soybean yield was 114.8 million tonnes (Embrapa, 2019), while corn production was 80.8 million tonnes, representing approximately 31.7% and 8% of the world’s production, respectively. The state of Mato Grosso stands out in this scenario (Silva, 2012; Kappes, 2013; Oliveira et al., 2015). Those expressive values of grain production are result of profitable planting and increased domestic and international demand, in addition to the occurrence of favorable soil and climate for cultivation. Besides, investments in new technologies introduced in crops, such as biotechnology in more resistant seeds and more productive hybrids, machinery and agricultural management, have corroborated the growth of tilth in the country and the reduction of pests (Beckmann & Santana, 2017; Ceccon, 2018), as well as encouraging the biofuel production (Nastari, 2018; Milanez et al., 2014).

In view of the expressive grain production, attention must be paid to the logistics chain involved. The transport flow logistics plays an important role in minimizing the need of long-distance transportation and inventory costs, as demonstrated by Wang and Cheng (2009) and Berman and Wang (2006). In this regard, Islam et al. (2013) states that logistics involves transportation, cargo handling and storage in a system that must have integrated information, which also involves packaging and security.

Currently, transportation infrastructure problems have hindered the expansion of Brazilian agribusiness, with losses attributed to poor conservation of national highways and the use of unsuitable vehicles, considering that the road transport is the most used mode of transportation for the production flow. There are also deficiencies in the railway and waterway networks. These complications result in high rates of grain losses during transport (Costabile et al., 2016; Deliberador et al., 2019).

Another relevant point presented in the literature, concerns the national grain storage structure before transporting them to their proper destination. Storing the grain and transporting it to the consumption areas requires an extensive system of grain handling facilities (Boumans, 1985). According to Kussano and Batalha (2012), Brazilian storage units are inadequate, generating overload on roads and on port structures in short periods of time. A common situation in rural properties is the grain storage made in temporary warehouses, on the field. This practice, according to the authors, forces the producers to sell their production right after the harvest, in a period of low revenue prices and high freight costs. Other authors also discuss the problem of grain storage in the country, such as Baroni et al. (2017), Goulart and Perreira (2020) and Nogueira Junior (1989).

One example of the lack of units for grain storage and poor logistics in Mato Grosso occurred during the 2016/2017 harvest, where a 25.9 million tonnes deficit in storage capacity was identified due to one of the highest grain harvest in the state. The storage capacity was 33.4 million tonnes, while yield was 59.3 million tonnes (IMEA, 2019). According to the Mato Grosso Soybean Producers Association (APROSOJA, 2019), tonnes of corn were stored in open spaces, forming mountains of grain.

In this perspective, this paper aims to forecast the grain storage balance in the state of Mato Grosso until the year 2022 through statistical projections. It is believed that estimating exponential smoothing models for the time series of area and yield of corn and soybeans may contribute to understanding the grain storage capacity in the Brazilian state of Mato Grosso for the years 2019 to 2022. In addition to this introduction, the article presents a second section that displays the literature review. In the third section, materials and methods are presented, followed by results and discussions. Finally, in the fifth and last section, the conclusions.

2. LITERATURE REVIEW
2.1 Agribusiness Logistics

According to Barnard et al. (2016), there are two main areas in the agribusiness supply chain management: operations management and logistics management. The latter comprises the processes of planning, implementing and controlling the flow of goods and services, in addition to related information of efficiency and effectiveness until the products’ final destination. The term logistics seeks the system’s global optimization, involving the dynamization of procedures and the reduction of costs along the logistics chain (Ballou, 1993). Therefore, in agribusiness, logistics systems must consider the needs associated with transportation, storage and other activities related to the products (Wicki & Franc-Dąbrowska, 2013).

The main purpose of agribusiness logistics is to improve the movement of agricultural cargo in space, by means of suitable vehicles, and in time, by means of storage, in order to obtain the lowest possible cost and add value to products (Caixeta Filho, 2010). Transport is responsible for most of the logistics costs (Souza et al., 2018), hence improving the transportation infrastructure can significantly increase exports (Fuller et al., 2003).

The feedstocks and products’ flows in the production chains are defined by the greater efficiency criteria using the available resources, with distance and time being the main aspects of analysis (Caixeta Filho, 2010; CNT, 2018). A 2015 study presents Brazil as an agricultural powerhouse, in the referred year the sector was responsible for 23% of the country Gross Domestic Product (GDP), employing approximately 30% of the economically active population (Soliani, 2015).

The Brazilian state of Mato Grosso is currently the largest agricultural producer in the country (CONAB, 2018). Although the Brazilian state presents great opportunities for agricultural development, it possesses modest transportation infrastructure to link it to international markets, using mainly motor carriers to transport the production to export ports. Therefore, more efficient transport alternatives have been sought to change this scenario, such as intermodal rail terminals.

In Mato Grosso, the soybean and corn outflow takes place in two stages. First, crops are transported by motor carriers to the farm's warehouse, which is the producer’s responsibility. In sequence, stocks can be transported directly for export or to the processing industry. In the first case, the grains are transported by railroad, truck or waterway to the ports of export.

2.2 Grain storage

Harvest and post-harvest activities, including packaging, processing, storage and transport, can be very demanding due to supply spikes (Behzadi et al., 2018). Storage refers to the housing of the most diverse products in specific facilities, and its importance is directly related to transport logistics costs.

According to Santos and Pereira (2019), bulk products are stored in silos. On the other hand, the warehouses are dedicated to storing sacks of grains, demanding a series of precautions to maintain the products’ quality. Those solutions are used in order to allow consolidated shipments, which in turn can reduce transport costs, compensating the increased expenses due to the use of storage places (Pêgo, 2016).

Static storage refers to the warehouse’s capacity, in tonnes (Azevedo et al., 2008). The storage balance is given by the difference between static capacity and total yield. This difference has been causing hold-ups on roads, on ports and on warehousing areas.

On the other hand, dynamic capacity is the amount of potential grains that can be stored in a unit, considering the inventory turnover or the turnover of crops in annual agricultural yield. According to Maia et al. (2013), the dynamic capacity is calculated considering the static capacity and the turnover factor, which measures the stock turnover in the period of one year, this factor can be burdensome to determine, given that it needs to reflect the Brazilian reality.

Brazil has a total storage capacity of 166,236,233 tonnes, the southern region holds 39% of that capacity, while the midwest has 36% of it. Despite the expressive values, the growth in static capacity does not match the growth in production, reducing national competitiveness (Rocha et al., 2018). Furthermore, Gaban et al. (2017) argue that there is an uneven distribution among the leading regions in grain production and the areas with the greatest storage capacity. Several authors discuss storage problems in different Brazilian regions, showing the national importance of this issue, despite the peculiarities of each state (Oliveira et al, 2015; Neto et al., 2016; Souza and Lobo, 2017;Silva and Dalchiavon, 2018;Brandão et al., 2018;Gaban et al., 2017;Rocha et al., 2018). Oliveira and Silveira (2013), Oliveira et al. (2012) and Junior and Tsunechiro (2016) discuss how new market demands can bring greater complications to storage systems. Frederico (2010); Gentil and Martin (2014) and Martins et al. (2005) discuss the construction of storage units within the farms, Filippi et al. (2019) and Filippi & Guarnieri (2019) examine the viability of Rural Warehouse Condominiums.

2.4 Time-series analysis

Time series can be trivially defined as the record of observations of a phenomenon over time. Thus, a time series with observations over time can be represented by , or, simply, by , with . Therefore, a time-series can be decomposed into the trend components,, which defines a growing or decreasing pattern, seasonality, , referring to a pattern that is repeated in a determinable time interval and the random term, , or simply error. In general, it is established that is a random variable with mean equal to zero and constant variance.

These three components can be pooled in an additive or multiplicative model, resulting in different temporal patterns. For example, a purely additive model is of the type , or else, purely multiplicative . Other forms are also possible, such as additive trend and seasonality and multiplicative error, resulting in .

Exponential smoothing methods are statistical procedures for obtaining time series forecasts according to the components present in the time series. The simplest case, without trend and seasonality, is known as the simple exponential smoothing method; when there is only the trend component, the method is called Holt; when there is a trend and seasonality the name is Holt-Winters (Hyndman et al., 2008).

The Holt-Winters method (Holt, 1957; Winters, 1960) with additive seasonality is defined by the following recursive expressions (1), (2) e (3):

(1),

(2),

and

(3) with, the smoothing parameter and , e the smoothed values in the period e , with the seasonality period.

The forecast for the period is obtained by the expression (4):

is the forecast horizon and is the whole part of

When the effect of seasonality is multiplicative, the multiplicative Holt-Winters method, defined by the following expressions (5), (6) e (7):

(5)

(6)

and

(7) the quantities , and were previously defined.

The forecast for the period , using the multiplicative Holt-Winters method, is determined by (8):

(8), where and follow the same definition as the additive Holt-Winters method.

In the absence of the seasonal component, we have the Holt method established by the expressions (9), (10) e (11):

(9)

and

(10)

and predictions calculated by:

The simple exponential smoothing method (SES), in the case of absence of the trend and seasonality components, is defined by (12)

(12), with forecast calculated by (13)

The smoothing parameters, of all the exponential smoothing methods presented, can be estimated by minimizing the mean squared error (MSE).

Since residuals are defined by . Therefore, the values of the unknown parameters are calculated in such a way that they minimize the amount .
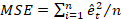
3. MATERIALS AND METHODS
3.1 Materials

The time series used in this paper are planted area (in hectares), productivity (in tonnes per hectare), yield (in tonnes) for soybeans, corn and total, grain storage capacity (in tonnes) and grain storage balance (in tonnes). All series are annual and correspond to the period from 1995 to 2018.

The information regarding planted area and productivity was obtained from IMEA (2019) and the storage capacity was retrieved from CONAB (2019). The other variables were calculated as follows: corn and soybean yield were determined by the products of planted area and productivity; total yield was computed as the sum of soy and corn production; the storage balance was obtained by the difference in storage capacity and total yield. All statistical analyzes were performed using the R software (R Core Team, 2020).

3.2 Methods

The time series of planted areas and corn and soybean productivity, and static grain storage capacity were modeled by the exponential smoothing methods described in the theoretical framework and detailed in Hyndman et al. (2008). Since there are a variety of possible models for each series, the model selection method presented and implemented in R language was considered (Hyndman et al., 2020).

The method of model selection by Hyndman et al. (2020) consists of estimating all possible models - simple smoothing, Holt, additive and multiplicative Holt-Winters -, and considering as the most appropriate model the one that results in the lowest value for the Akaike information criterion (Akaike, 1974). During this model selection process, the Box-Cox transformation (Box & Cox, 1964) was also applied.

After selecting the most appropriate model, using the technique of Hyndman et al. (2020), for each of the highlighted series, we proceeded by estimating future values over a four-year forecast horizon, which are: 2019, 2020, 2021 and 2022. The point and interval forecast method adopted in this work was proposed by Cordeiro & Neves (2014). This method combines the exponential smoothing methods with the non-parametric bootstrap. According to the results of Cordeiro and Neves (2014), this methodology results in forecast intervals with smaller ranges. The confidence level adopted in the estimation of the forecast intervals was 95% and 1,000 iterations were completed in the bootstrap resampling procedure.

After calculating the planted area and soybean and corn productivity forecasts, the 2019 to 2022 forecasts for the variables: soybean, corn and total yield were also calculated. Finally, the storage balance forecast was obtained by the difference in storage capacity and total production.

It should be noted that the projections are reliable for the expected average behavior, therefore abrupt interferences in production or storage are not considered. In other words, the models do not consider political, economic, climatic situations, among others, that may directly interfere yield and/or storage of the analyzed commodities.

4. RESULTS AND DISCUSSIONS
4.1 Grain storage balance from 1995 to 2018

The data provided by IMEA (2019) regarding the planted area and corn and soybean productivity from 1995 to 2018 in the state of Mato Grosso are shown in Table 1 and Figures 1 to 4. The production of these grains, which were calculated by the product of the planted areas and productivity are available in Table 1 and Figure 5.

Corn yield in Mato Grosso increased by almost 240% between 2007/08 and 2017/18 (Table 1 and Figure 1), from 7.9 million tonnes to 26.4 million tonnes. Regarding the planted area, for the same period, there was an increase of 2.7 million ha or 145%. The productivity, which was 4.3 tonnes/ha, reached 6.2 tonnes/ha. These increases are related to a set of investments made by companies and institutions focused on new cultivation technologies (Ceccon, 2018).

In the corn production data, shown in Table 1 and Figure 1, the largest annual increase happened between 2010/11 and 2011/12 harvests, which corresponds to 105% - that is, the yield more than doubled in one year. According to Silva (2012), this increase in corn yield in the state is due to the second-crop corn – known as safrinha. Silva (2012) and Kappes (2013) argue that the occurrence of Asian soybean rust, in the 2001/02 harvest, encouraged the early soybean cultivars, with sowing between the end of September and the beginning of October; in this way, safrinha corn benefited from the displacement of the soybean sowing season.

Table 1.
Planted area (in hectare), productivity (in tonnes per hectare) and yield (in tonnes) of corn and soybeans in the state of Mato Grosso, from 1995 (1994/1995 harvest) to 2018 (2017/2018 harvest).

Adapted from IMEA (2019).

The soybean production, between 2007/08 and 2017/18 harvests, grew around 81%, from 17.8 million tonnes to 32.3 million tonnes. This advance in production was driven by the increase in planted area, which was 9.5 million ha in the 2017/18 harvest. The sowing of improved cultivars and the control of weeds, pests and diseases also contributed to this scenario. On the other hand, Beckmann and Santana (2017) emphasize that agricultural modernization in Mato Grosso is low. Therefore, growth in soy production is still expected due to new technological developments.

Another factor for the good performance in soy production is presented by CONAB (2019a), which reports the positive association of production with the export of Brazilian soy due to the trade barrier between China and the United States, the good price of soy in the international market and the increase in domestic consumption.

Table 2 shows the total yield and static storage capacity from 1995 to 2018, as well as Mato Grosso’s storage balance deficit.

There has been an increase in grain production over the last ten years. The total yield growth is around 130%. Another factor verified throughout the presented data is that the static storage capacity does not match the high growth in production. Gaban et al. (2017) had already highlighted the lack of storage units for the total grain production. In fact, CONAB (2019a) outlines that in 2013/2014 harvest there was not enough infrastructure to store approximately 24% of the total national grain yield. For Mato Grosso, considering the same harvest highlighted by the authors, there was a lack of infrastructure to store 30.6% of the combined production of corn and soybeans. In 2017/2018, the deficit rose to 36%.

CONAB (2019a) points out that what is recommended by the Food and Agriculture Organization of the United Nations (FAO) is a storage of 1.2 times the annual grain production. Thus, the static capacity in 2017/2018 should be equivalent to 70.5 million tonnes. However, it is noted a deficit of approximately 21.2 million tonnes.

Table 2.
Total yield (in tonnes) and static storage capacity (in tonnes) of grains and storage balance (in tonnes) in the state of Mato Grosso, from 1995 (1994/1995 harvest) to 2018 (2017/2018 harvest)

Adapted from IMEA (2019) e CONAB (2019)

Oliveira et al. (2015) already pointed to a similar result when using a Geographic Information System to analyze data on yield, planted area and static capacity between the years 1990 and 2010 in Mato Grosso. The authors demonstrated that the warehouse structures are not sufficient to match the current soybean production in the state, as outlined in Table 2. It is worth noting that this issue is not unique to the state of Mato Grosso. Similar conclusions are drawn for the state of Goias in Neto et al. (2016), Minas Gerais by Souza and Lobo (2017), Tocantins by Silva and Dalchiavon (2018) and Brandão et al. (2018) for a region called Matopiba (agricultural hub that involves the states of Maranhão, Tocantins, Piauí and Bahia).

Gaban et al. (2017) adds that due to the scarcity of storage, the grains are transported immediately after harvest, compelling producers to accept high freight prices, which can cause a devaluation of their products. Rocha et al. (2018) complement that, for the soybean culture, storage allows producers to obtain additional income, using this operation as a commercial strategy, mainly for harvests that start in February.

4.2 Grain storage balance forecast from 2019 to 2022

Table 3 shows the parameters estimates of the exponential smoothing models for the time series planted area, corn and soybean productivity and static grain storage capacity in Mato Grosso from 1995 to 2018. The parameter estimates the Box-Cox transformation is also reported in Table 3, when there was a need for transformation.

It is noteworthy that all the time series presented a trend component, except for soybean productivity, and in none there was a seasonal component identified. This result indicates that corn and soybean planted areas, corn productivity, as well as the static grain storage capacity, are increasing over time, on average.

Table 3.
Estimates of the parameters of the estimated exponential smoothing models and the lambda parameter, λ, of the Box-Cox transformation for the time series planted area, corn and soybean productivity and static grain storage capacity, in the state of Mato Grosso from 1995 to 2018

The forecasts of the time series planted area, productivity and corn production, for a forecast horizon of four years, are available in Table 4. In this same table it is possible to observe the forecast confidence intervals at the level of 95%. Figures 1 and 2 show the planted area and corn productivity forecasts in dashed line in the aforementioned period, and the forecast confidence intervals at the 95% confidence level are dotted.

When observing the projections of the planted area, productivity and yield data, there is a clear upward trend in their values, with 58%, 24% and 96% respectively when comparing the 2017/18 crop and the forecast for 2021/22.

There is a growing acceptance of safrinha, considering that part of this has been destined to the production of corn ethanol. Second crop corn has been occupying around 30% of the area planted with soy in the state, practically twice as much as it was years ago (Silva, 2012). CONAB (2018) has identified in its reports the growth of the representativeness of this ethanol variety, projecting a demand of more than 4 million tonnes for this cereal in the future - the 2018/19 crop reached almost 2 million tonnes of corn. Although the demand is still low in relation to the total corn yielded in the region, this alternative is advantageous, according to Nastari (2018), since the prices are attractive in regions close to the production hubs and the logistical limitations found.

Table 4.
Forecast of planted area (in hectare), productivity (in tonnes per hectare) and production (in tonnes) of corn in the state of Mato Grosso, from 2019 (2018/19 harvest) to 2022 (2021/22 harvest). In parentheses the forecast confidence intervals at the 95% confidence level.


Figure 1.
Solid line: planted area (in hectare) of corn in the state of Mato Grosso, from 1995 (1994/1995 harvest) to 2018 (2017/2018 harvest). Dashed line: forecast of corn planted area in Mato Grosso, from 2019 (harvest 2018/19) to 2022 (harvest 2021/22). Dotted line: lower and upper limits of forecast confidence at the 95% confidence level.


Figure 2.
Solid line: productivity (in tonnes per hectare) of corn in Mato Grosso, from 1995 (1994/1995 harvest) to 2018 (2017/2018 harvest). Dashed line: corn yield forecast in Mato Grosso, from 2019 (2018/19 harvest) to 2022 (2021/22 harvest). Dotted line: lower and upper limits of forecast confidence at the 95% confidence level.

Milanez et al. (2014), when discussing the feasibility of applying safrinha as a raw material for biofuel, point to a deeper analysis on the adaptation of sugarcane ethanol production technologies in order to also work with corn, known as flex plants. The authors argue that, since there are large soy planting areas that are not yet used for second-crop corn cultivation, a wide potential for increasing regional production is perceived when a stable local consumer market develops. In addition, there is the possibility of reducing plants’ idleness that occurs during the sugarcane’s off-season (CONAB, 2018).

Considering the exponential smoothing models’ results for soybean planted area and productivity in the state of Mato Grosso (Table 3) the forecasts for the time series of planted area, productivity and yield between 2018/19 and 2021/22 harvests were calculated. These forecasts are available in Table 5, along with the forecast confidence intervals at the 95% confidence level. Figures 3 and 4 show the planted area and productivity forecasts in dashed lines and, in dotted lines, the forecast confidence intervals at the 95% confidence level.

Table 5.
Forecast of planted area (in hectare), productivity (in tonnes per hectare) and soybean production (in tonnes) in Mato Grosso, from 2019 (2018/19 harvest) to 2022 (2021/22 harvest). In parentheses, the forecast confidence intervals at the 95% confidence level.

For soybean productivity, it is significant to note that the most appropriate exponential smoothing model does not present components of trend and seasonality. This implies that, statistically, soybean productivity is in a period of consolidation. With this, soybean productivity is expected to be, on average, 3.13 tonnes/ha, and may vary between 2.99 to 3.29 tonnes/ha at the 95% confidence level. It should be noted that these forecasts results are expected if the agricultural production technology is maintained. In fact, data from CONAB (2019b) points to such behavior, the institution detected a reduction in the speed of increase in the soybeans’ planted area and in its average productivity, caused by the use of degraded pastures areas that were converted into planting areas, which, normally, have lower productivity.

The forecasts of total grain production, static capacity and storage balance for the years 2019 (2018/19 harvest) to 2022 (2021/22 harvest) are shown in Table 6. In brackets are shown the forecasts with 95% confidence level. In Figures 5to7 are available, in dashed line, the total yield forecasts, static storage capacity and storage balance and, in a dotted line, the forecast confidence intervals at the 95% confidence level.


Figure 3.
Solid line: planted area (in hectare) of soybeans in Mato Grosso, from 1995 (1994/1995 harvest) to 2018 (2017/2018 harvest). Dashed line: forecast of soybean planted area in Mato Grosso, from 2019 (2018/19 harvest) to 2022 (2021/22 harvest). Dotted line: lower and upper limits of forecast confidence at the 95% confidence level.


Figure 4.
Solid line: soybean productivity (in tonnes per hectare) in Mato Grosso, from 1995 (1994/1995 harvest) to 2018 (2017/2018 harvest). Dashed line: soybean productivity forecast in Mato Grosso, from 2019 (2018/19 harvest) to 2022 (2021/22 harvest). Dotted line: lower and upper limits of forecast confidence at the 95% confidence level

Table 6.
Forecast of total yield (in tonnes), static storage capacity (in tonnes) and storage balance (in tonnes) of grains in Mato Grosso, from 2019 (2018/19 harvest) to 2022 (2021/22 harvest). In parentheses the forecast confidence intervals at the 95% confidence level


Figure 5.
Solid line: total production (in tonnes) of corn and soybeans in the state of Mato Grosso, from 1995 (1994/1995 harvest) to 2018 (2017/2018 harvest). Dashed line: forecast of total corn and soybean production in the state of Mato Grosso, from 2019 (2018/19 harvest) to 2022 (2021/22 harvest). Dotted line: lower and upper limits of forecast confidence at the 95% confidence level.


Figure 6.
Solid line: static storage capacity (in tonnes) of grains in Mato Grosso, from 1995 (1994/1995 harvest) to 2018 (2017/2018 harvest). Dashed line: forecast of grain storage capacity in the state of Mato Grosso, from 2019 (2018/19 harvest) to 2022 (2021/22 harvest). Dotted line: lower and upper limits of forecast confidence at the 95% confidence level.


Figure 7.
Solid line: grain storage balance (in tonnes) in Mato Grosso, from 1995 (1994/1995 harvest) to 2018 (2017/2018 harvest). Dashed line: forecast of the grain storage balance in the state of Mato Grosso, from 2019 (2018/19 harvest) to 2022 (2021/22 harvest). Dotted line: lower and upper limits of forecast confidence at the 95% confidence level.

The data points to an increase close to 28 million tonnes in the total yield, while the growth of the static storage capacity is predicted to be around 3 million tonnes. Therefore, despite production and storage capacity showing upward trends, the gap between these indicators could widen by 118% between the 2017/18 and 2021/22 harvests. The deficit, therefore, will correspond to 53% of 2021/22 harvest total yield. The results obtained corroborate with Baroni et al. (2017) who used the least squares method to outline prospective storage scenarios for the period between 2017 and 2021 in Brazil, demonstrating the tendency of an increasing deficit in the North, Midwest and South regions.

The emergence of new market demands and advances in farming technology or biotechnology may also increase the existing and future deficit. Oliveira and Silveira (2013) and Oliveira et al. (2012) discuss the Cartagena Protocol on Biosafety impacts on space requirements, segregation and transportation of different types of modified grains, concluding that it affects production and flow logistics of the products. In this regard, Junior and Tsunechiro (2016) argue that there is an increasing demand on storage dividers in order to segregate transgenic and conventional grains. In addition, there is also a significant growth in the organic farming market.

Goulart and Perreira (2020) attribute the lack of storage infrastructure to the fact that financial resources were directed to short-term needs, mainly to finance agricultural production. For the authors, the capital for long-term investment, that can be invested in storage infrastructure, remained essentially in charge of the Brazilian Development Bank (BNDES). However, with the decline in public participation in private sector financing, alternatives for investments in storage infrastructure arise. Nogueira Junior (1989) affirms that Brazil's storage complex is archaic and has an obsolete structure. Also, in the author’s opinion, from a governmental point of view, it is a marginalized sector, since, historically, there were storage improvement proposals, but a small part of them were concluded.

According to Gentil and Martin (2014), competitive economies have significant rates of on-farm crop storage. For those farms without this type of storage infrastructure, two alternatives remain: selling the grains as soon as they are harvested, at low prices and with high freight costs, or stocking the product in third-party warehouses, paying high storage taxes for it (Goulart & Perreira, 2020; Martins et al., 2005). Thus, the construction of silos and warehouses on rural properties is understood as a good alternative for producers (Frederico, 2010;Gentil & Martin, 2014; Martins et al., 2005).

Filippi et al. (2019) points out to the viability of Rural Warehouse Condominiums as an alternative to tackle Brazil’s storage deficit. Smallholder farmers are organizing themselves to create their own warehouse structure, which consists of the construction of cooperative warehousing with static storage capacity varying from 180,000 to 450,000 sacks (Filippi et al., 2019). Through this solution, a complete storage infrastructure is possible through the sharing of property rights between associates, in proportion to their investment. In addition to the economic advantages, logistical improvements are reported, condo members benefit from not having to wait in queues when arriving to unload or load their cargo, as can happen in silos of third parties, cooperatives and companies (Filippi & Guarnieri, 2019).

In order to enable the implementation of storage systems in rural properties or even Rural Warehouse Condominiums, Goulart and Pereira (2020) present and discuss some financing alternatives which medium and smallholders farmers can have access, provided that payment capacity is verified: (i) real estate investment funding for logistical structures in the agrobusiness chain; (ii) financing of manufacturers of storage structures with the use of a rural product bill; (iii) finance portfolio, in which a credit risk liability agreement is established between the bank and the manufacturer.

It is known that transport costs can represent up to 50% of the commodities sale’s value (Souza et al., 2018). Additionally, Fuller et al. (2003) demonstrated the positive effect of improving transport infrastructure in terms of increased exports of soybeans and corn, highlighting Brazil’s role within international trade. In order to consolidate new export corridors and, as a consequence, secure more competitiveness for the Brazilian agribusiness, transport infrastructure improvements are necessary, such as the EF-170 project, known as Ferrogrão. This railway connects the grain producing region of the Brazilian Midwest to the Port of Miritituba, in Pará. In addition, mainly to Mato Grosso, Arco Norte ports (Ports of Porto Velho (RO), Manaus (AM), Miritituba (PA), Santarém (PA), Barcarena (PA), São Luis (MA) and Salvador (BA)) have proven to be a good alternative for the grain export system, due to their greater proximity to the producing areas and the possibility of using more suitable modes of transportation. For João et al. (2016) the use of these ports conjectures growth as they present more competitive solutions in terms of shipping rates and environmental impacts, integrating waterway and railway modalities.

5. CONCLUSIONS

Mato Grosso is one of the leading soybeans and corn-producing state in Brazil, presenting high indexes of planted area, productivity and yield. Shortcomings in terms of the state’s lack of transport infrastructure are widely discussed, which are usually focused on the mode of transportation used. However, the storage infrastructure, considered insufficient, should also be studied.

Through the data presented about the production, storage capacity and transport logistics of corn and soybeans in Mato Grosso, it is possible to visualize the prospects for growth and development of the sector in the state.

Due to the growing demand for these grains, it was concluded that the lack of storage is one of the crucial points for logistics in the state. According to production and storage forecasts for the next four years, it was found that from the 2018/19 to the 2021/2022 harvests there will be a 11,9% growth in yield and only 9,7% increase in storage growth. It should be noted that in order to end the storage deficit, it would be necessary to increase storage capacity by 18,7% per year, or 74,7% in the four-year period.

The deficit in static capacity has become one of the main obstacles for Mato Grosso’s agribusiness competitiveness, considering that the insufficiency of warehouses often causes grain losses or higher freight prices to export.

It is believed that the improvement of storage facilities and logistical strategies for storing could minimize costs and, consequently, maximize profits. Also, it is needed to develop short, medium and long-term strategies in order improve logistics and management mechanisms in the agribusiness sector and to strengthen public policies that contribute to this.

The study forecasts perspectives for the storage of agricultural bulk and demonstrates the need for investments in the warehousing sector, which can serve as a subsidy for possible policies and studies in the area. As discussed, the implementation of on-farm crop storage could be a possible solution to the discussed deficit. Thus, it is understood that further research will be necessary focusing on the viability of the alternative presented, or even the possible benefits from the union of small farmers in order to create Rural Warehouse Condominiums. In addition, the Mato Grosso’s macro-regions should be studied so as to identify those areas with the worst storage rates, as well as for determining the optimal locations for silos and warehouses within those.

Supplementary material
Appendices
Appendix

DECLARATION OF CONTRIBUTIONS TO THE ARTICLE – CrediT


6. REFERENCES
Akaike, H. (1974). A new look at the statistical model identification. IEEE Transactions on Automatic Control, 19(6), 716–723. https://doi.org/10.1109/TAC.1974.1100705
Aprosoja. (2019). Projeto de incentivo ao investimento em armazenagem de grãos em Mato Grosso. In Armazena MT. http://www.aprosoja.com.br/storage/site/downloads/comunicacao/publicacoes/armazena-mt59959f5f8f8a7.pdf
Azevedo, L. F., Oliveira, T. P., Oliveira, Porto, A. G., Silva, F. S. (2008). A capacidade estática de armazenamento de grãos no Brasil. Anais do Encontro Nacional de Engenharia de Produção, Rio de Janeiro, RJ, Brasil, 28.
Ballou, R. H. (1993). Gerenciamento da Cadeia de Suprimentos: Logística Empresarial. Atlas.
Barnard, F. L., Akridge, J. T., Dooley, F. J., Foltz, J. C., & Yeager, E. A. (2016). Agribusiness management (5a ed.). Routledge.
Beckmann, E., & Santana, A. C. (2017). Indicadores da modernização agrícola do Estado de Mato Grosso. Extensão Rural, 24(1), 100-119. https://doi.org/10.5902/2318179622992
Baroni, G. D., Benedeti, P. H., & Seidel, D. J. (2017). Cenários prospectivos da produção e armazenagem de grãos no Brasil. Revista Thema, 14(4), 55–64. https://doi.org/10.15536/thema.14.2017.55-64.452
Beckmann, E., & Santana, A. C. de. (2017). Indicadores da modernização agrícola do estado de Mato Grosso. Extensão Rural, 24, 100–119. https://doi.org/10.5902/2318179622992
Boumans, G. (1985). Grain handling and storage (1a ed.). Elsevier B.V.
Box, G., & Cox, D. (1964). An analysis of transformations. Journal of the Royal Society, 26, 211–252.
Brandão, T. P., Souza, A. G. V., Faria, L. O., Silva, C. dos S., Simão, K. G., Araújo, M. da S., & Bert, M. P. da S. (2018). O déficit na capacidade estática de armazenagem de grãos em MATOPIBA. Revista Agri-Environmental Sciences, 4(1), 23–31. https://doi.org/10.13037/gr.vol32n96.2944
Caixeta Filho, J. V. (2010). Logística para a agricultura brasileira. Revista Brasileira de Comércio Exterior, 103, 18–30.
Ceccon, G. (2018). Milho safrinha no cerrado brasileiro. Revista Plantio Direto e Tecnologia Agrícola, 5–8.
CNT. (2018). Plano CNT de transporte e logística 2018. http://planotransporte.cnt.org.br/#download.
CONAB. (2018). Diagnóstico da Produção de Etanol em Mato Grosso: Binômio Cana-de-açúcar/Milho.
CONAB. (2019a). Acompanhamento safra brasileira de grãos.
CONAB. (2019b). Perspectivas para agropecuária - Volume 7 - Safra 2019/2020.
CONAB. (2019c). Panorama do milho. https://www.gov.br/agricultura/pt-br/assuntos/camaras-setoriais-tematicas/documentos/camaras-setoriais/aves-e-suinos/2017/33a-ro/panorama-do-milho-tome-guth.pdfc
Cordeiro, C., & Neves, M. (2014). Forecast Intervals with Boot.EXPOS. In New advances in statistical modeling and applications (1st ed., pp. 249–256). Springer International Publishing. https://www.springer.com/gp/book/9783319053226
Costabile, L. T., Vendrametto, O., & Oliveira Neto, G. C. de. (2016). Comparativo de perdas de grãos no transporte rodoviário - Estudo de Caso. Revista Espacios, 37(15), 1–10. http://www.revistaespacios.com/a16v37n15/16371501.html
Deliberador, L. R., Mello, L. T. C. de, & Batalha, M. O. (2019). Perdas de Grãos no Transporte e Armazenagem: Uma Revisão Sistemática da Literatura com Análise Bibliométrica. Gepros: Gestão Da Produção, Operações e Sistemas, 14(5), 174–189. https://doi.org/10.15675/gepros.v14i5.2461
Embrapa. (2019). Soja em números (safra 2018/19). https://www.embrapa.br/soja/cultivos/soja1/dados-economicos.
Filippi, A. C. G., & Guarnieri, P. (2019). Novas formas de organização rural: os Condomínios de Armazéns Rurais. Revista de Economia e Sociologia Rural, 57(2), 270–287. https://doi.org/10.1590/1806-9479.2019.177593
Filippi, A. C. G., Guarnieri, P., Carvalho, J. M., Reis, S. A., & Cunha, C. A. da. (2019). New configurations in Brazilian agribusiness: rural warehouse condominiums. Journal of Agribusiness in Developing and Emerging Economies, 10(1), 41–63. https://doi.org/10.1108/jadee-12-2018-0178
Filippi, A. C. G., Guarnieri, P., & Cunha, C. A. da. (2019). Condomínios Rurais: revisão sistemática da literatura internacional. Estudos, Sociedade e Agricultura, 27(3), 525–546. https://doi.org/10.36920/esa-v27n3-4
Frederico, S. (2010). Desvendando o agronegócio: financiamento agrícola e o papel estratégico do sistema de armazenamento de grãos. GEOUSP - Espaço e Temp, 27, 47–61. https://doi.org/10.11606/issn.2179-0892.geousp.2010.74154
Fuller, S., Yu, T. H., Fellin, L., Lalor, A., & Krajewski, R. (2003). Transportation Developments in South America and Their Effect on International Agricultural Competitiveness. Transportation Research Record, 1820, 62–68. https://doi.org/10.3141/1820-08
Gaban, A. C., Morelli, F., Brisola, M. V., & Guarnieri, P. (2017). Evolução da produção de grãos e armazenagem: perspectivas do agronegócio para 2024/2025. Informe Gepec, 21(1), 28–47.
Gentil, L. V., & Martin, S. (2014). Armazenagem da produção é viável para o produtor rural? Revista Agroanalysis, 28–29.
Goulart, D. F., & Perreira, L. H. (2020). Soluções para os gargalos da agricultura. GVEXECUTIVO, 19(2), 4.
Holt, C. C. (1957). Forecasting trends and seasonals by exponentially weighted averages.
Hyndman, R., Athanasopoulos, G., Bergmeir, C., Caceres, G., Chhay, L., O’Hara-Wild, M., Petropoulos, F., Razbash, S., Wang, E., & Yasmeen, F. (2020). Forecasting functions for time series and linear models. R package. (8.12; p. 1). http://pkg.robjhyndman.com/forecast
Hyndman, R., Koehler, A. B., Ord, J. K., & Snyder, R. D. (2008). Forecasting with exponential smoothing (1st ed.). Springer-Verlag Berlin Heidelberg. https://www.springer.com/gp/book/9783540719168
IMEA. (2019). Relatório de mercado - Soja e milho. Relatório de Mercado. http://www.imea.com.br/imea-site/relatorios-mercado
João, A. M., Vettorazzi, A. C., Rocha, F. V., Bartholomeu, D. B., & Caixeta-Filho, J. V. (2016). Emissão de CO2 na logística de exportação de soja do Mato Grosso: o caso das exportações pelo Arco Norte. Encontro Nacional Sobre Gestão Empresarial e Meio Ambiente.
Junior, S. N., & Tsunechiro, A. (2016). Armazenagem de grãos no Brasil – ameaças e oportunidades. Eventos ABRAPOS, 568–572.
Kappes, C. (2013). Sistemas de cultivo de milho safrinha no Mato Grosso. XII Seminário Nacional Do Milho Safrinha, 1–21. https://www.cpao.embrapa.br/cds/milhosafrinha2013/palestras/5CLAUDINEIKAPPES.pdf
Kussano, M. R., & Batalha, M. O. (2012). Custos logísticos agroindustriais: avaliação do escoamento da soja em grão do Mato Grosso para o mercado externo. Gestão e Produção, 19(3), 619–632. https://www.scielo.br/pdf/gp/v19n3/13.pdf
Maia, G. B. da S., Pinto, A. de R., Marques, C. Y. T., Lyra, D. D., & Roitman, F. B. (2013). Panorama da armazenagem de produtos agrícolas no Brasil. Revista do BNDES, 40, 161–194. https://web.bndes.gov.br/bib/jspui/handle/1408/13445
Martins, R. S., Rebechi, D., Prati, C. A., & Conte, H. (2005). Decisões estratégicas na logística do agronegócio: compensação de custos transporte-armazenagem para a soja no estado do Paraná. Revista de Administração Contemporânea, 9(1), 53–78. https://doi.org/10.1590/s1415-65552005000100004
Milanez, A. Y., Nyko, D., Valente, M. S., Xavier, C. E. O., Kulay, L. A., Donke, C. G., Matsuura, M. I. da S. F., Ramos, N. P., Morandi, M. A. B., Bonomi, A., Capitani, D. H. D., Chagas, M. F., Cavalett, O., & Gouvêia, V. L. R. de. (2014). A produção de etanol pela integração do milho-safrinha às usinas de cana-de açúcar: avaliação ambiental, econômica e sugestões de polÌtica. Revista do BNDES, 41, 147–208.
Nastari, P. M. (2018). Etanol de milho tem futuro no Brasil. Revista Agroanalysis, 1, 26–27. http://bibliotecadigital.fgv.br/ojs/index.php/agroanalysis/article/viewFile/78264/74963
Neto, W. A. da S., Arruda, P. do N., & Bastos, A. da C. (2016). O déficit na capacidade estática de armazenagem de grãos no estado de Goiás. Gestão & Regionalidade, 32(96), 151–169. https://doi.org/10.13037/gr.vol32n96.2944
Nogueira Junior, S. (1989). Ensaio especial - armazenagem. Revista Agroanalysis, 13, 15–18.
Oliveira, A. L. R. da, & Silveira, J. M. F. J. da. (2013). Restructuring of the corn supply chain in Brazil: facing the challenges in logistics or regulation of biotechnology. International Food and Agribusiness Management Review, 16(4), 1–24.
Oliveira, Andrea Leda Ramos de, Silveira, J. M., & Alvim, A. (2012). Cartagena protocol, biosafety and grain segregation: the effects on the soybean logistics in Brazil. E3 Journal of Agricultural Research and Development, 2, 17–30.
Oliveira, M. A. de, Ferreira, R. C., Sibaldelli, R. N. R., Nascimento, S. P. do, & Júnior, A. D. (2015). Análise espacial da produção da soja e capacidade estática de armazenamento no estado do Mato Grosso. Revista de Estudos Sociais, 17(35), 238–257. https://doi.org/10.19093/res.v17i35.2486
Pêgo, B. (2016). Logística e transportes no brasil: uma análise do programa de investimentos 2013-2017 em rodovias e ferrovias. http://repositorio.ipea.gov.br/bitstream/11058/7420/1/RP_Logística_2016.pdf
R Core Team. (2020). R: A language and environment for statistical computing (p. 1). R Foundation for Statistical Computing. https://www.r-project.org/
Rocha, F. V. da, João, A. M., Santos, R. de M., & Caixeta Filho, J. V. (2018). A armazenagem de grãos no Brasil: qual a melhor estratégia para os exportadores? Revista de Economia e Agronegócio, 16(3), 366–386. https://doi.org/10.25070/rea.v16i3.7812
Santos, J. D. S., & Pereira, L. A. G. (2019). Logítica de transportes do agronegócio e exportações de soja no Centro-Oeste brasileiro. GEOAMBIENTE ON-LINE, 34, 131–154. https://doi.org/10.5216/revgeoamb.v0i34.52867
Silva, Rafael Alves da, & Dalchiavon, F. C. (2018). Déficit de armazenagem da produção agrícola do Tocantins. Revista IPecege, 4(1), 19–27.
Silva, Ricardo Arioli. (2012). Mato Grosso desenvolve cultivo de soja e milho de safrinha. Visão Agrícola, 67–69.
Soliani, R. D. (2015). An overview of agribusiness logistics in Brazil. Australian Journal of Basic and Applied Sciences, 9(31), 410–422.
Souza, M. , Pardiola, A. L., Cavequeia, L. F., Xavier, G. T., Santos, K, M., & Zambra, E. M. (2018). O sistema de transporte e escoamento da produção de grãos: um desafio à competividade do agronegócio Mato-Grossense. Revista de Gestão Do Agronegócio Da Unipampa, 3(1).
Souza, M. F., & Lobo, C. F. F. (2017). Caracterização e análise espacial do déficit de armazenagem em Minas Gerais. Cadernos Do Leste, 17(17), 119–133.
Wang, X., & Cheng, T. (2009). Logistics scheduling to minimize inventory and transport costs. International Journal of Production Economics, 121(1), 127-138. https://doi.org/10.1016/j.ijpe.2009.05.007
Wicki, L., & Franc-Dąbrowska, J. (2013). The role of IT systems in supporting logistics systems in agribusiness enterprises. Issues in Information Systems, 14(2), 127–138.
Winters, P. R. (1960). Forecasting sales by exponentially weighted moving averages. Management Science, 6(3), 324–342. https://www.jstor.org/stable/2627346?seq=1
Notes
Table 1.
Planted area (in hectare), productivity (in tonnes per hectare) and yield (in tonnes) of corn and soybeans in the state of Mato Grosso, from 1995 (1994/1995 harvest) to 2018 (2017/2018 harvest).

Adapted from IMEA (2019).
Table 2.
Total yield (in tonnes) and static storage capacity (in tonnes) of grains and storage balance (in tonnes) in the state of Mato Grosso, from 1995 (1994/1995 harvest) to 2018 (2017/2018 harvest)

Adapted from IMEA (2019) e CONAB (2019)
Table 3.
Estimates of the parameters of the estimated exponential smoothing models and the lambda parameter, λ, of the Box-Cox transformation for the time series planted area, corn and soybean productivity and static grain storage capacity, in the state of Mato Grosso from 1995 to 2018

Table 4.
Forecast of planted area (in hectare), productivity (in tonnes per hectare) and production (in tonnes) of corn in the state of Mato Grosso, from 2019 (2018/19 harvest) to 2022 (2021/22 harvest). In parentheses the forecast confidence intervals at the 95% confidence level.


Figure 1.
Solid line: planted area (in hectare) of corn in the state of Mato Grosso, from 1995 (1994/1995 harvest) to 2018 (2017/2018 harvest). Dashed line: forecast of corn planted area in Mato Grosso, from 2019 (harvest 2018/19) to 2022 (harvest 2021/22). Dotted line: lower and upper limits of forecast confidence at the 95% confidence level.

Figure 2.
Solid line: productivity (in tonnes per hectare) of corn in Mato Grosso, from 1995 (1994/1995 harvest) to 2018 (2017/2018 harvest). Dashed line: corn yield forecast in Mato Grosso, from 2019 (2018/19 harvest) to 2022 (2021/22 harvest). Dotted line: lower and upper limits of forecast confidence at the 95% confidence level.
Table 5.
Forecast of planted area (in hectare), productivity (in tonnes per hectare) and soybean production (in tonnes) in Mato Grosso, from 2019 (2018/19 harvest) to 2022 (2021/22 harvest). In parentheses, the forecast confidence intervals at the 95% confidence level.


Figure 3.
Solid line: planted area (in hectare) of soybeans in Mato Grosso, from 1995 (1994/1995 harvest) to 2018 (2017/2018 harvest). Dashed line: forecast of soybean planted area in Mato Grosso, from 2019 (2018/19 harvest) to 2022 (2021/22 harvest). Dotted line: lower and upper limits of forecast confidence at the 95% confidence level.

Figure 4.
Solid line: soybean productivity (in tonnes per hectare) in Mato Grosso, from 1995 (1994/1995 harvest) to 2018 (2017/2018 harvest). Dashed line: soybean productivity forecast in Mato Grosso, from 2019 (2018/19 harvest) to 2022 (2021/22 harvest). Dotted line: lower and upper limits of forecast confidence at the 95% confidence level
Table 6.
Forecast of total yield (in tonnes), static storage capacity (in tonnes) and storage balance (in tonnes) of grains in Mato Grosso, from 2019 (2018/19 harvest) to 2022 (2021/22 harvest). In parentheses the forecast confidence intervals at the 95% confidence level


Figure 5.
Solid line: total production (in tonnes) of corn and soybeans in the state of Mato Grosso, from 1995 (1994/1995 harvest) to 2018 (2017/2018 harvest). Dashed line: forecast of total corn and soybean production in the state of Mato Grosso, from 2019 (2018/19 harvest) to 2022 (2021/22 harvest). Dotted line: lower and upper limits of forecast confidence at the 95% confidence level.

Figure 6.
Solid line: static storage capacity (in tonnes) of grains in Mato Grosso, from 1995 (1994/1995 harvest) to 2018 (2017/2018 harvest). Dashed line: forecast of grain storage capacity in the state of Mato Grosso, from 2019 (2018/19 harvest) to 2022 (2021/22 harvest). Dotted line: lower and upper limits of forecast confidence at the 95% confidence level.

Figure 7.
Solid line: grain storage balance (in tonnes) in Mato Grosso, from 1995 (1994/1995 harvest) to 2018 (2017/2018 harvest). Dashed line: forecast of the grain storage balance in the state of Mato Grosso, from 2019 (2018/19 harvest) to 2022 (2021/22 harvest). Dotted line: lower and upper limits of forecast confidence at the 95% confidence level.


Buscar:
Contexto
Descargar
Todas
Imágenes
Non-profit publishing model to preserve the academic and open nature of scientific communication
Mobile reader generated through XML-JATS4R