

Evaluation, Public Management & Development
CITIES THAT ARE LOSING INHABITANTS: AN ANALYSIS OF THE BRAZILIAN REALITY
CIDADES QUE ESTÃO PERDENDO HABITANTES: UMA ANÁLISE DA REALIDADE BRASILEIRA
 Beatriz Rennó Biscalchim
Ana Paula Barreira aprodrig@ualg.pt
Beatriz Rennó Biscalchim
Ana Paula Barreira aprodrig@ualg.pt
Revista Produção e Desenvolvimento
Centro Federal de Educação Tecnológica Celso Suckow da Fonseca, Brasil
ISSN: 2446-9580
Periodicity: Frecuencia continua
vol. 6, no. 1, 2020
Received: 24 April 2020
Accepted: 26 July 2020
Published: 31 July 2020
Abstract:
Purpose: This article identifies the Brazilian cities that showed urban decline in the period between 1970 and 2010 based on the country's official census conducted by the IBGE (Brazilian Institute of Geography and Statistics). Based on this identification, analysis of the behaviors presented by the cities with population loss allows separate them according to the two theories that explain the loss of population: life cycle and persistent decline.
Methodology: The article compares the Brazilian situation with countries from other continents, namely Europe, which also showed population decline in the cities.
Findings: The results show a diversity of situations, whereby the population decline of cities is not a generalized phenomenon nor inevitable.
Implication: This analysis allows the discussion about whether the loss of inhabitants in some cities is an inevitable part of a country's development process in the sense that as countries increase their development indices also increases the number of cities with population loss.
Originality: This paper provides a comprehensive portrait of the lost of inhabitants in the Brazilian cities. The article is the first to analyze the population trajectory of all Brazilian cities, covering a period of four decades.
Keywords: shrinking cities, urban decline, population loss, demographic change, Brazil.
Resumo:
Propósito: O presente artigo identifica as cidades brasileiras que apresentaram declínio no período compreendido entre 1970 e 2010 com base nos censos oficiais do país realizados pelo IBGE (Instituto Brasileiro de Geografia e Estatística). Partindo dessa identificação, a análise dos comportamentos apresentados pelas cidades com perda populacional permite separa-las de acordo com as duas teorias que explicam a perda de população: ciclo de vida e declínio persistente.
Metodologia: O artigo compara a situação brasileira com países de outros continentes que também apresentaram um declínio populacional nas cidades, nomeadamente a Europa.
Resultados: Os resultados mostram uma diversidade de realidades e o declínio populacional das cidades não é um fenómeno generalizado nem inevitável.
Implicações: A analise permite discutir se a perda de habitantes em algumas cidades é ou não uma inevitabilidade do processo de desenvolvimento de um país, na medida em que um país ao aumentar os seus índices de desenvolvimento também aumenta o número de cidades com perda populacional.
Originalidade: Este artigo fornece um retrato abrangente da perda de habitantes nas cidades brasileiras. O artigo é o primeiro que analisa a trajetória populacional de todas as cidades brasileiras, compreendendo um período de quatro décadas. All
authors contributed to the writing and final review of the article. All authors
contributed to the conceptualization of the study, the
methodological–theoretical approach, literature review
and data analysis.
Palavras-chave: cidades em encolhimento, declínio urbano, perda de população, mudança demográfica, Brasil.
1. INTRODUCTION
In general, cities present different demographic development dynamics, and their trajectories follow periods of population growth and decline. These dynamics of population fluctuation are well defined by the theory of the urban life cycle (van den Berg, Drewett, Klaassen, Rossi, & Vijverberg, 1982), in which periods of population expansion alternate with declining populations, and are interpreted as a natural cycle. However, more recently, the theory of persistent decline has come to question this interpretation by arguing that an extreme event can put cities in a continuous process of population loss, with no possibility of returning to growth (Metzger, 2000).
In 2008, although more than half of the world's population lived in urban areas (United Nations Population Fund [UNFPA], 2007), the population decreased in a significant number of cities. Cities that are losing inhabitants have already been identified in various parts of the world, and that number continues to increase (Oswalt & Rieniets, 2006).
Understanding the dynamics of population loss is very important since this decline not only involves a reduction in the level of economic activity in cities, but also implies a decrease in available social capital, and this capital becomes more important when the capacity of local governments to deal with cities that are losing inhabitants also decreases (Panagopoulos, Guimarães, & Barreira, 2015).
This paper aims to identify the Brazilian cities that showed population loss with characteristics of life cycle and / or persistent decline between 1970 and 2010. To this end, we present a review of the literature on the subject, highlighting the two theories mentioned above that try to explain these behaviors. This article also presents a small comparison of the results obtained from Brazilian cities with the realities presented by European cities. It is useful to look at cities in other regions of the world that have already undergone urban transition in order to learn from their experiences (Martine & Mcgranahan, 2010). Through this comparison, we will try to understand whether the loss of inhabitants in some cities is an inevitable part of a country's development process, and if the number of such cities increases as the country increases its development indices.
The paper is divided into five sections. The first section presents a literature review on the topic of cities with population decline, as well as the theories that explain it: life cycle and persistent decline. The second section describes the process of population decline in countries on other continents. The third section contains a brief history of the economic transformations that have occurred in Brazil, which is necessary to understand the factors that explain Brazilian population dynamics. The fourth section presents the methodological procedures used in this paper in order to identify the Brazilian cities showing population loss. Finally, the fifth section comprises the final considerations, presenting a panoramic view of each region of Brazil.
2. LITERATURE REVIEW
Investigations have demonstrated that in 2008, the world reached an unprecedented milestone: more than half of the human population lived in urban areas (UNFPA, 2007). However, as humanity becomes increasingly urban, a significant number of cities are losing inhabitants (Rodríguez-Pose, 2018). Cities with declining populations are now a reality in all parts of the world (Oswalt & Reiniets, 2006; Wolff & Wiechmann, 2018)
Therefore, understanding the reasons underlying this population decline in cities as well as their consequences becomes increasingly important, because when people are lost, not only does the level of economic activity in a city reduce, but also the amount of available social capital (Kooiman, Latten, & Bontje, 2018; Giffoni, Gomellini, & Pellegrino, 2019). This capital becomes more important when the capacity of local governments to deal with this population loss also declines (Panagopoulos et al., 2015; Mallach, 2017; Pallagst, Fleschurz, & Said, 2017; Galster, 2019; Park & LaFrombois, 2019; Sousa, 2019).
The literature shows us that the topic of growth of cities is more popular in academic discussions than population decrease (Audirac, 2018a). The concept of population decline has emerged in the literature since 1980 (Beauregard, 2009; Audirac, 2018b). The two theories proposed to explain population loss are the theories of life cycle and persistent decline.
The life cycle of urban development shows that a city goes through periods of growth, stagnation, and contraction in its trajectory (van den Berg et al., 1982). These fluctuations in cities in the context of their population dynamics are discussed as natural processes. However, when an extreme event puts a city in a continuous process of population loss, with no possibility of growth, the city finds itself in a persistent decline (Metzger, 2000). Nevertheless, it does not mean that the city losing its inhabitants will inevitably disappear, nor does it mean that it will be able to reverse this situation (Power, Plöger, & Winkler, 2010; Panagopoulos & Barreira, 2012; Haase, Wolff, & Rink, 2018). Thus, the factors of attraction and repulsion of cities are decisive in the behavior of population dynamics (Barreira, Nunes, Guimarães, & Panagopoulos, 2019).
The causes for population decline
First, it is important to consider the concept of decline. In the present study, as in the study presented by Guimarães, Barreira, & Panagopoulos (2015), we use the definition of Turok & Mykhnenko (2007), where in population decline is understood as the loss of inhabitants in urban areas, with many intertwined factors behind it (Guimarães et al., 2015).
There are diverse causes for population decrease, not only in Brazil, but worldwide. The first of these is the aging of the population, accompanied by a decrease in fertility, which has occurred to levels well below those necessary for generational replacement in all OECD countries (OECD, 2003). In European populations, this demographic transition took longer and this process started with fertility rates below those observed in Brazil at the beginning of its decline (Carvalho, 1997). This decline in fertility has been occurring for the past 40 years in Brazil. According to the Demographic Health Survey, the total fertility rate in Brazil fell from 6.3 in 1960 to a replacement level below 1.8 in 2006 (Martine & Mcgranahan, 2010). This decrease in fertility is one of the factors responsible for low population growth (Carvalho, 1997).
Brazil and the other Latin American countries are undergoing a process of rapid aging. Investigations show that a significant decrease in the population under 15 years of age occurred in Brazil between 1991 and 2020, with the decline being from 35% to 21.5%. However, the relative size of the adult or working-age population increased from 60% to 70% (Carvalho, 1997). Thus, Brazil will go through a demographic boom until 2025. According to Anderson & Schneider (2015), this period can offer the country above-average economic growth rates, since the economically active population will reach 70% in this period. However, a number of factors are necessary for this demographic bonus to be fully utilized, for example, low unemployment, increased education levels, and adequate infrastructure, among others (Anderson & Schneider, 2015). In the context of the current Brazilian reality, this will require greater efforts by the country's government.
Another important factor in population decline in cities is migration (Turok & Mykhnenko, 2007). Migratory dynamics are defined by factors of attraction and repulsion to and from a city. These migrations can be triggered by several reasons such as economic transformations, the environmental consequences of urban expansion, suburbanization, and the appearance of satellite cities (Guimarães et al., 2015; Panagopoulos et al., 2015). Economic transformations include deindustrialization, economic cycles, macroeconomic trends, and globalization, among others (Guimarães et al., 2015; Blažek, Květoň, Baumgartinger-Seiringer, & Trippl, 2019).
These changes alter the profiles of employment, habitability, and education, among others (Guimarães et al., 2015). Therefore, cities with a higher degree of economic development attract the young and adult population more because they possess better conditions and access to employment (Barreira, Ramalho, Panagopoulos, & Guimarães 2017; Wolff, Fol, Roth, & Cunningham-Sabot, 2017). The degree of attractiveness of the most economically developed cities is of particular importance in the context of population decrease, because young people tend to leave the less attractive cities early, when compared with the elderly, thus perpetuating the cycle of decline (Ubarevičienė & van Ham, 2017; Barreira et al., 2019; Haacke, Enßle, Haase, Helbrecht, & Lakes, 2019). In Brazil, economic factors are the main cause for the loss of city inhabitants. Section three describes the economic changes that have occurred in Brazil over the years. This comprehensive analysis helps us better understand the migratory dynamics of the population of the Brazilian regions.
A special migratory pattern is suburbanization. Although this topic is much debated, its definition is not consensual. However, for this article, the concept of suburbanization proposed by Hesse (2006) is adequate. Suburbanization is, in general, migration from the city center to its surroundings, with residents looking for more spacious or affordable houses. In Europe, the reasons for the declining population are diverse, but the most common are related to the process of suburbanization and deindustrialization (Nelle, Großmann, Haase, Kabisch, Rink, & Wolff, 2017).
In Brazil, this pattern has also been identified mainly in large metropolises such as São Paulo. The urban growth of the city of São Paulo was rapid, without proper planning, and with strong real estate speculation, which consequently led the majority of the population to seek distant and more accessible places to live (Martine & Mcgranahan, 2010).
Another cause for migration is the existence of so-called satellite cities. Cities subject to this effect lose residents to nearby cities that are better equipped with services such as health and education (Merrilees, Miller, & Herington, 2013).
Finally, environmental conditions such as heat waves, lack of rain, frosts, and pollution, among others, can determine migration and consequently reduce the population of cities (Panagopoulos et al., 2015; Jaroszewska, 2019).
3. POPULATION DECLINE IN EUROPEAN COUNTRIES
In order to understand the process of urban decline in Brazil, it is important to compare this reality with countries that have already undergone urban transition in order to learn from their experiences. Thus, we can also see if the loss of inhabitants in some cities is an inevitable part of the development process of a country, wherein this loss increases as the country increases its development rates. Table 1 shows some European countries that have shown negative urban population growth rates in the last 10 and 20 years.
| EUROPEAN COUNTRIES | |||||
| LAST TEN YEARS | LAST TWENTY YEARS | ||||
| COUNTRIES | 1991 | 2001 | 2011 | 2001-2011 | 1991-2011 |
| BULGARIA | 8.669.269 | 7.928.901 | 7.504.868 | -5,35 | -13,43 |
| GERMANY | 79.753.227 | 82.440.309 | 81.751.602 | -0,84 | 2,51 |
| ESTONIA | 1.567.749 | 1.366.959 | 1.294.455 | -5,30 | -17,43 |
| LATVIA | 2.667.870 | 2.364.254 | 1.074.605 | -12,25 | -22,24 |
| LITHUANIA | 3.701.968 | 3.486.998 | 3.052.588 | -12,46 | -17,54 |
| HUNGARY | 10.373.153 | 10.198.315 | 9.937.628 | -2,56 | -4,20 |
| ROMANIA | 23.192.274 | 21.833.483 | 21.355.849 | -2,19 | -7,92 |
The analysis of population loss must be compared with these countries’ evolution of GDP (Gross Domestic Product) per capita, as it is an indicator that helps us understand a country’s degree of economic development. The higher the GDP per capita, the more developed the country. Table 2 shows the GDP of European countries per capita.
| GDP PER CAPITA – EUROPEAN COUNTRIES | |||
| COUNTRIES | 1991 | 2001 | 2010 |
| BULGARIA | : | 2.300 | 3.500 |
| GERMANY | 23.400 | 26.600 | 29.100 |
| ESTONIA | : | 6.200 | 8.400 |
| LATVIA | 4.100 | 4.000 | 5.900 |
| LITHUANIA | : | 4.400 | 7.100 |
| HUNGARY | : | 7.400 | 8.800 |
| ROMANIA | : | 2.900 | 4.500 |
| UNIT | Euro per inhabitant | ||
Looking at the tables, we can see that countries with high levels of development, like Germany, had a negative urban population growth rate, but despite this evolution, as shown in Table 2, the country's GDP per capita continued to increase. This shows us that despite population loss, the country has high economic development, which compensates for the negative growth rate of the urban population. Although there are countries that show economic growth and have cities with declining populations, other countries such as Denmark and Finland have high levels of economic development but do not have any city with a declining population (Urban Audit). This dual reality shows that economic development does not necessarily imply the loss of population in cities.
Comparing the reality of European countries that have already undergone urban development with the figures presented by Brazil, the expectation is that the Brazilian GDP will continue to grow and the population growth rate will decrease, which may mean that in the near future, the population of a larger number of Brazilian cities will decline.
4. ECONOMIC AND DEMOGRAPHIC TRAJECTORY IN BRAZIL
Before analyzing the cities that have lost population in Brazil, it is important to understand more deeply some of the main economic transformations that the country has experienced, as these transformations may be correlated with the explanations of migration and the population loss presented by some Brazilian cities.
We start with the last great economic cycle of the colonial period - coffee production in the second half of the 19th century. Its production was mainly concentrated in the southeast region of the country, more precisely, in the states of Rio de Janeiro and São Paulo; consequently, the region became the country's economic hub, attracting many immigrants seeking employment in coffee plantations. This last great economic cycle is defined by Martine & McGranahan (2010) as the starting point of the country's early urbanization process.
The economic crash of 1929 caused a decline in the country’s coffee industry. However, this crisis did not mean that the Brazilian economy was in decline; on the contrary, the basic conditions (population and capital concentration) led Brazil to establish a new source of economic dynamism and urban concentration, industrialization (Martine & Mcgranahan, 2010), a phenomenon that intensified since 1950.
Industrialization marked the Brazilian economy, migrations, and demography, as there was an intense migratory flow to the cities, especially of the rural population, which led to an urban concentration motivated by the demand for industrial labor. Therefore, Baeninger (2011) considers industrialization the main determinant of the country's internal migrations, which marked the urbanization process in Brazil.
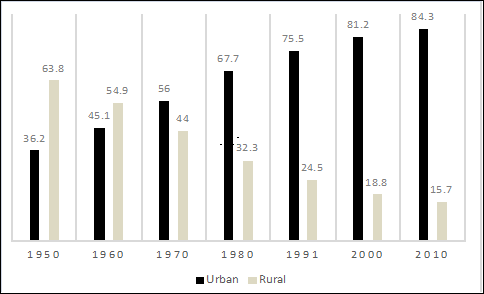
Martine & McGranahan (2010) claim that the country, therefore, underwent an “early urban transition” in 1950, with 36% of Brazilians already living in urban areas at that time, unlike African (15%) and Asian (17%) urban populations. These figures reveal the rapid urbanization process that the country has undergone. In Europe and North America, urbanization levels at the time had reached 51% and 64%, respectively (Martine & Mcgranahan, 2010). In addition to urban concentration, the decline in the mortality rate and high levels of fertility led to new rates of demographic growth in Brazil, where the population rose from 41 million inhabitants in 1940 to 70 million in 1960.
The 1960s were marked by important political and social transformations, notably the 1964 military coup, which led to the imposition of conservative modernization, which focused on technical, agricultural, and industrial improvements (Martine & Mcgranahan, 2010). Another important event of the period was the transfer of the country's capital to Brasilia, which is located in the Center-West region, resulting in a large migratory flow.
All these processes show a clear and progressive intensification of urbanization and population concentration in the most economically attractive cities. In a few years, Brazil has undergone an urbanization process that had taken a long time in developed countries (Martine & Mcgranahan, 2010).
The 1970 census was the first to identify a greater urban population than rural population (Figure 1), and it revealed the beginning of a generalized process of decreased fertility in Brazil as well (Rigotti & Cunha, 2012). This period saw the beginning of the end of the trend of accelerating demographic growth.
Additionally, it is during this period that there was a decrease in the relative importance of the main areas of immigration (with the exception of Maranhão, Minas Gerais, Espírito Santo, Santa Catarina, and Rio Grande do Sul). Rio de Janeiro lost importance as a migration area, but São Paulo continued to play an important role as a pole of population attraction during the period.
In the 1980s, the country recorded the worst economic performance in its history, and according to Martine (1994), it was marked by two processes: the reduction of the population concentration due to industrial decentralization and relocation to smaller cities, which started in the previous decade, and a reduction of population growth due to the definitive fall in the fertility rate. Martine (1994) highlights five reasons for the decrease in population concentration: delayed effects of industrial decentralization; adoption of patterns of behavior associated with counter-metropolization; cumulative effects of a long process of interiorization, which resulted in a more balanced urban network; impacts of the crisis on the reduction of the migratory movement; and the impact of falling fertility on the growth rate of migrants.
Migrations from the 1990s to the present day are marked by the reduction of long-distance flows, migratory recovery of spaces with negative migratory levels, mainly in the northeastern states, and the emergence and consolidation of migrant absorption hubs. All these factors are associated with the spatial decentralization of industry. The Southeast still presents positive levels of migration, and the Northeast, negative levels, but with numbers much less noticeable than in the previous decades (“migratory recovery”).
With this brief overview of the country's economic trajectory, it is possible to understand which regions have the greatest degree of migratory attractiveness and how the population and economic dynamics behaved over the years in Brazil. These factors may explain the reasons for the population loss registered in some Brazilian cities, which will be presented in the following sections.
5. MATERIAL AND METHODS
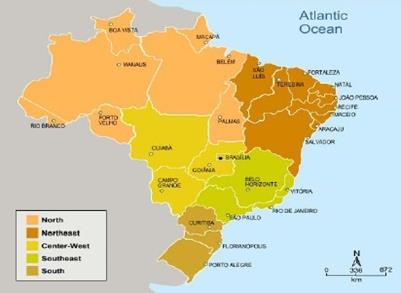
Brazil is the fifth largest country in the world. Its population in 2010, according to IBGE (Brazilian Institute of Geography and Statistics), was 190.732.694 inhabitants; of these, 84% [i] live in urban areas. In the same year, Brazil had 5.565 cities spread across five regions. Figure 2 identifies the regions, the Brazilian states, and their capitals.
The first step in the investigation was to identify which Brazilian cities showed population decline. For this, we researched the cities that presented this decline in the IBGE official censuses between 2000 and 2010. The data collected for the Brazilian cities took into account only the urban population.
We identified 377 cities that showed a decline in the number of inhabitants between 2000 and 2010, distributed among the five regions of Brazil. After this first screening, we expanded our analysis to their population history from 1970 to 2010. [ii] In this way, we were able to identify that between 1970 and 2010, five cities showed persistent decline, that is, they presented three or more consecutive periods of decline, 53 cities presented life cycle behavior, and 319 cities faced a recent loss of inhabitants. Table 3 separates cities with population decline by type of behavior and by region of Brazil, and Table 4 shows the loss of inhabitants, in absolute numbers, of the 377 cities with population decline by region of the country.
| REGION | LIFE CYCLE | PERSISTENT DECLINE | RECENT DECLINE |
| NORTH | 2 | _ | 23 |
| NORTHEAST | 6 | _ | 86 |
| SOUTHEAST | 24 | _ | 60 |
| CENTER-WEST | 10 | 2 | 61 |
| SOUTH | 11 | 3 | 89 |
| REGION | URBAN POPULATION IN 2000 | URBAN POPULATION IN 2010 | ABSOLUTE DIFERENCE |
| NORTHEAST | 845.346 | 788.143 | -57.203 |
| NORTH | 166.956 | 154.897 | -12.059 |
| SOUTHEAST | 1.390.931 | 1.249.160 | -141.771 |
| CENTER-WEST | 396.063 | 358.863 | -37.200 |
| SOUTH | 1.449.876 | 1.396.657 | -53.219 |
| TOTAL | 4.249.172 | 3.947.720 | -301.452 |
After identifying the cities that showed behavior in accordance with the life cycle theory or the persistent decline theory, the analysis focuses on the core reasons for this population loss in each region. The following section is dedicated to this analysis.
6. RESULTS AND DISCUSSION
Center-West
The Center-West region consists of the states of Goiás, Mato Grosso, Mato Grosso do Sul, and the Federal District. The relocation of Brazil’s capital from Rio de Janeiro to Brasília in 1960 caused major change in the region. The construction of roads and railways was intense, and it generated an increase in the population. The total area of the region is 1.612.077,2 km², and is the second largest Brazilian region by territory. The economy of the Brazilian Center-West is based on the primary sector with livestock (the largest cattle herd in the country), agriculture, and mineral exploration, and the tertiary sector with the major development of civil construction.
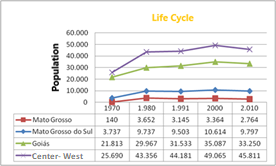
The Center-West had 466 cities in 2010 (IBGE). Of these, 73 showed a decrease in population between 2000 and 2010, with 10 of them presenting life cycle behavior between 1970 and 2010. Two cities showed persistent decline between 1980 and 2010. Of the states in the region, only Brasília had no cities with population decline. Mato Grosso do Sul and Mato Grosso presented only one city in each state with an evolution pattern of the life cycle type, namely, Camapuã and Porto dos Gaúchos. The state of Goiás had eight cities presenting the life cycle evolution, namely, Amorinópolis, Aurilândia, Fazenda Nova, Israelândia, Moiporá, Santa Cruz de Goiás, Santa Rosa de Goiás, and São Miguel do Araguaia, and two cities with persistent decline between 1980 and 2010, Formoso and Goiás.
Among the factors that explain these results, economic transformations are the most striking. The construction of Brasília motivated migrations to the country’s new capital. In addition, the region was also highly sought after for mining. This exploitative activity, however abundant, fluctuates, so the population attracted by mining varies according to the investments made by large mining companies.
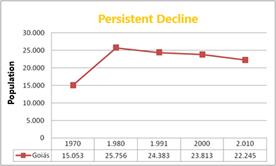
The city of Goiás, which also presented persistent decline, was the capital of the respective state until 1937, when it was transferred to Goiânia. In 2001, the city was recognized by UNESCO as a Historical, Cultural, and Environmental Heritage site of Humanity for its architecture and cultural traditions. The relocation of the state capital was one of the major causes of population loss in the city, causing an economic and social crisis (Siqueira & Vianaa, 2013).
In addition to the economic transformations, we can say that the city of Santa Rosa de Goiás presented as a satellite city as it is located in the metropolitan region of the state capital, which may explain its life cycle dynamics and, to a degree, the attractiveness of the capital. Below, Figure 3 presents the population values of the states of the Center-West that presented a population evolution of the life cycle and persistent decline types.
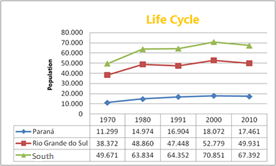
South
The South region is composed of three states: Paraná, Santa Catarina, and Rio Grande do Sul. With an area of 576.409,6 km², it is the smallest region in Brazil. Although the tertiary sector generates most of the region's economic income, the South is characterized by major activity in several areas. It is the second largest industrial center in the country, predominantly in the textile and automobile industries. In the primary sector, it has activities in agriculture, where it accounts for more than half of Brazil's grain production.
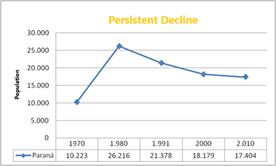
In 2010 (IBGE), the Southern region had 1.188 cities. Of these, 103 presented population loss between 2000 and 2010; 11 of these cities showed life cycle behavior between 1970 and 2010, and three cities presented persistent decline from 1980 to 2010. Of the three states that make up the region, only Santa Catarina did not have cities with population loss from 2000 to 2010.
The state of Paraná has four cities where the life cycle phenomenon was observed between 1970 and 2010: Francisco Alves, Rio Bom, Santa Mariana, and Guapirama. Three cities showed persistent decline between 1980 and 2010: Formosa do Oeste, Grandes Rios, and São João do Ivaí. The state of Rio Grande do Sul presented seven cities with the life cycle pattern between 1970 and 2010: Cambará do Sul, Dona Francisca, General Câmara, Iraí, Marcelino Ramos, Rio Pardo, and Santa Barbara do Sul.
Economic changes, namely the search for job opportunities, explain these migrations. The inhabitants of the South region of the country moved to nearby cities with better conditions of life, work, and study, among others. Figure4 presents the population values of the states of the South region that presented a population evolution of the life cycle and persistent decline types.
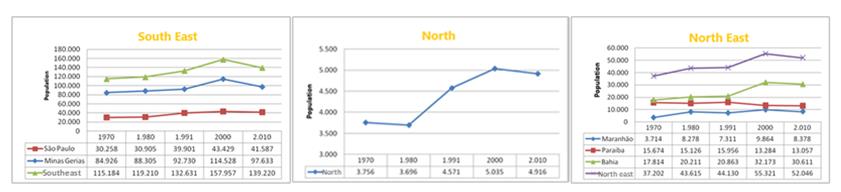
Southeast
The Southeast region is the richest and most populous in Brazil. Its states are Espírito Santo, Minas Gerais, Rio de Janeiro, and São Paulo. Despite being the most populous region in the country, it occupies only 11% of the national territory. The economy is based on the secondary sector, with a strong presence of the automobile industry, household appliances, machinery, metallurgy, and technology; the tertiary sector is the second biggest employer in the region. The primary sector is also present with mechanized agriculture in the interior of Minas Gerais and São Paulo, and mineral exploration in Rio de Janeiro. In 2010 (IBGE), the region had 1.668 cities. Of these, 84 cities showed a decrease in population between 2000 and 2010 (IBGE), with 24 of them displaying life cycle behavior between 1970 and 2010, and none showing persistent decline behavior. Only the states of Minas Gerais and São Paulo had cities with behavioral patterns of the life cycle type between 1970 and 2010. The states of Rio de Janeiro and Espírito Santo showed only a recent decline (between 2000 and 2010).
The state of Minas Gerais had 18 cities with the life cycle pattern: Biquinhas, Bom Jardim de Minas, Cedro de Abaeté, Estrela do Indaiá, Joanésia, Dores do Indaiá, Marilac, Monjolos, Morro da Garça, Nanuque, Resplendor, Rio Manso, Rubelita, São João do Oriente, Serra da Saudade, Tapiraí, Umburatiba, and Vargem Bonita. The state of São Paulo had six cities with the life cycle pattern: Aparecida d´Oeste, Gália, Irapuru, Muruntinga do Sul, Piquete, and Populina.
The Southeast region is the richest and most developed in the country. Therefore, the region attracts the most immigrants from all parts of Brazil. For this reason, internal migration in the region occurs between cities in the Southeast and is motivated mainly by economic factors, namely the search for better jobs and life opportunities. Analyzing the cities in the region, we noticed that many of them became independent at an early stage, that is, they separated from other cities and became autonomous, but this process of independence did not consider the future socioeconomic viability of these new cities. This is the case in the city of Monjolos in Minas Gerais (Tameirão & Nogueira, 2013). In addition, cities like Joanésia, Rio Manso, São João do Oriente, and Piquete were affected by the satellite effect because they are located in metropolitan regions of their states. This may explain the population decline in these cities and the degree of attractiveness of their respective capitals. Figure 5 shows the population values of cities in the Southeast that presented a behavioral pattern of the life cycle type.
North
The Northern region of Brazil is the most extensive, with 3.869.637 km², and it includes seven states: Acre, Amapá, Amazonas, Pará, Rondônia, Roraima, and Tocantins. In addition to being the largest territorial region, the two largest states in Brazil are also located there: Amazonas and Pará. The region's economy is based on activities in the primary sector such as plant and mineral extraction. Agriculture and livestock are also prominent in the region. In the secondary sector, however, there are a few isolated industries, usually subsidized, related to agricultural products or extraction. These industries brought strong migration to the North of the country thanks to the creation of the Manaus Free Trade Zone.
According to the last census conducted in 2010 by IBGE, the Northern region had 449 cities. Of these, 25 cities showed population loss from 2000 to 2010 (IBGE, 2000 and 2010), with only two cities showing life cycle behavior between 1970 and 2010. No city in this region presented persistent decline during the period studied.
The two cities with life cycle behavior are located in the state of Tocantins: Araguacema and Nazaré. The explanatory factors for the population loss of these two cities are directly connected with economic transformations. The North region is one of the regions that lost the most population to other states, mainly the Southeast region, due to its better economic conditions. Figure 5 aggregates the population values of these two cities with life cycle behavior in the North region.
Northeast
The Northeast region is the third largest region in Brazil, and it contains the largest number of states, nine: Alagoas, Bahia, Ceará, Maranhão, Paraíba, Pernambuco, Piauí, Rio Grande do Norte, and Sergipe. Its total area is 1.561.177 km². The region's economy is based mainly on the secondary sector, sugar production and oil refining in particular. This intense industrialization occurred due to the departure of industries from the Southeast to the Northeast. The primary sector also plays a part in the economy with agriculture, livestock, and mineral extraction.
The region contained 1.794 cities in 2010 (IBGE). Of these, 92 cities showed population loss from 2000 to 2010 (IBGE), and of these, 6 cities showed life cycle behavior between 1970 and 2010. No city had a persistent decline in population. Only three states in the region displayed a life cycle pattern of behavior: Bahia, with the cities of Conceição do Almeida, Contendas do Sincorá, Gongogi, and Una, Maranhão, represented by the city of Poção da Pedra, and finally, Paraíba, with the city of Rio Tinto.
Economic transformations largely explain the loss of inhabitants in the region. These transformations have been occurring since 1940, when the coffee cycle began in Brazil. The Southeast region developed the most during this period, attracting, for this reason, many migrants from all regions of Brazil, but mainly the Northeast. In 1970, the Federal Government launched social and economic incentives in order to boost the region, but this development occurred in an irregular manner since it depended on several poorly planned political and social factors (Silva, 2012).
The Northeast is the region that loses the most population to other states, but this situation has been changing because there is a return flow to the region, motivated by industrialization, which began to move from the Southeast region. The fact that the city of Rio Tinto in Paraíba is located in the metropolitan region of the state capital, João Pessoa, may explain the population loss of the city, given the degree of attractiveness of the capital, which is in accordance with the process described by Marine & McGranahan (2010) of rapid and intense urbanization in Brazil. Figure 5 shows the population values of cities that presented life cycle behavior in the Northeast region.
7. CONCLUSION
Brazil is a vast country that has undergone a rapid and recent urbanization process, a consequence of industrialization. This process was a principal determinant of internal migration in the country, where cities with a higher level of attraction captured a large number of citizens, forming large urban agglomerations, while less attractive cities began to lose inhabitants.
These cities with declining populations are a reality worldwide, and in Brazil, they have been identified in some states. Numerically, approximately 7% of Brazilian cities showed an urban decline, and they represented a loss of 9% of inhabitants in the 377 cities identified with population loss between 2000 and 2010. In comparison, in 18 European countries with cities that are losing population (considering those with more than 60 thousand inhabitants), 21% of those cities (183 cities) showed a population decline between 2001 and 2011 (Urban Audit). This corresponds to a loss of 4% of the number of inhabitants. Although direct comparisons cannot be made because the picture presented in this article for Brazil includes small cities and the data available for Europe does not, the number of residents who left European cities was around 1.65 million, while in Brazil, the cities lost only approximately 300 thousand inhabitants. Therefore, it can be considered a phenomenon that has affected Europe in a much more accentuated way, with Brazil still at an early stage in this process of demographic transition.
Among the primary stimuli for the Brazilian results were economic transformations. These transformations also primarily cause migration, since the population moves to regions with better conditions of habitability, life, services, and employment, among others.
Still dealing with economic transformations, we can highlight the appearance of satellite cities; a phenomenon also identified in the case of Brazil. These cities lose residents to nearby cities that are better equipped with public services, among others.
The sharp drop in the birth rate can be added to all these causes. By 2025, 70% of Brazil’s population will be at working age, but after that period, the age pyramid will be inverted and the Brazilian population will become older.
This scenario of low Brazilian population growth foresees a future where more Brazilian cities may experience population loss. Therefore, thinking about strategies to reduce this decline is very important for cities, since they receive state funding, namely the Municipality Participation Fund, which is calculated based on the number of inhabitants of each city. Therefore, retaining the population is a conditioning factor for the survival of some Brazilian municipalities.
Despite this, looking at the panorama presented by the countries of Europe and comparing it with the development process that Brazil is undergoing, we can state that the more developed the country, the greater the probability of finding cities losing inhabitants, although this is not inevitable. Despite the negative population growth rates of some European countries--a consequence of economic transformations, migration, and the fall in the fertility rate, among other factors--some of these countries continued to show GDP growth per capita at constant values, that is, despite population loss, countries continued to grow.
Looking at Brazil’s future, we can anticipate that although more cities will experience population loss, the country's economic development rates should continue to increase. To ascertain comprehensively how the population in Brazil will evolve, further investigation on the subject will be necessary. This paper is just a first step toward presenting a general panorama of the demographic evolution of Brazilian cities, and it offers insight into the future population prospects of the country. A more detailed investigation will complement the present analysis and allow for further discussions on the topic, which will assist in future decision-making.
Acknowledgments
The authors are pleased to acknowledge financial support from Fundação para a Ciência e a Tecnologia (Grant UIDB/04007/2020).
6. REFERENCES
Anderson, J. S. N., & Schneider, S. (2015). Brazilian demographic transition and the strategic role of youth. Espace populations sociétés, 2–3, p.20. https://doi.org/10.4000/eps.5774.
Audirac, I. (2018a). Introduction: Shrinking Cities from marginal to mainstream: Views from North America and Europe. Cities, 75, 1–5. https://doi.org/10.1016/j.cities.2017.10.012.
Audirac, I. (2018b). Shrinking cities: An unfit term for American urban policy? Cities, 75, 12–19. https://doi.org/10.1016/j.cities.2017.05.001.
Baeninger, R. (2011). Migrações internas no Brasil século 21: evidências empíricas e desafios conceituais. In J. M. P. Cunha (Eds.), Mobilidade espacial da população: desafios teóricos e metodológicos para o seu estudo (pp. 71–93). Campinas: Núcleo de Estudos de População – Nepo/Unicamp.
Barreira, A. P., Nunes, L. C., Guimarães, M. H., & Panagopoulos, T. (2019). Satisfied but thinking about leaving: The reasons behind residential satisfaction and residential attractiveness in shrinking Portuguese cities. International Journal of Urban Sciences, 23(1), 67–87. https://doi.org/10.1080/12265934.2018.1447390.
Barreira, A.P., Ramalho, J. J. S., Panagopoulos, T., & Guimarães, M. H. (2017). Factors driving the population growth and decline of Portuguese cities. Growth and Change, 48(4), 853–868. https://doi.org/10.1111/grow.12205.
Beauregard, R. A. (2009). Urban population loss in historical perspective: United States, 1820-2000. Environment and Planning A, 41(3), 514–528. https://doi.org/10.1068/a40139a.
Blažek, J., Květoň, V., Baumgartinger-Seiringer, S., & Trippl, M. (2019). The dark side of regional industrial path development: towards a typology of trajectories of decline. European Planning Studies. https://doi.org/10.1080/09654313.2019.1685466.
Carvalho, J. A. M. (1997). Demographic dynamics in Brazil recent trends and perspectives. Brazilian Journal on Population Studies, 1, 5–23. Disponível em: http://www.abep.nepo.unicamp.br/docs/rev_inf/rebep_ingles_n1/vol1ing_n1_1997e1998_1artigo_5_23.pdf.
Galster, G. (2019). Why Shrinking Cities Are Not Mirror Images of Growing Cities: A Research Agenda of Six Testable Propositions. Urban Affairs Review, 55(1), 355–372. https://doi.org/10.1177/1078087417720543.
Giffoni, F., Gomellini, M. & Pellegrino, D. (2019). Human capital and urban growth in italy, 1981–2001. Review of Urban & Regional Development Studies, 31(1–2), 77–101. https://doi.org/10.1111/rurd.12100.
Guimarães, M. H., Barreira, A. P., & Panagopoulos, T. (2015). Shrinking cities in Portugal – Where and why. Revista Portuguesa de Estudos Regionais, 40(3), 23–41. Disponível em: http://www.apdr.pt/siteRPER/numeros/RPER40/40.2.pdf.
Haacke, H., Enßle, F., Haase, D., Helbrecht, I., & Lakes, T. (2019). Why Do(n’t) People Move When They Get Older? Estimating the Willingness to Relocate in Diverse Ageing Cities. Urban Planning, 4(2), 53–69. https://doi.org/10.17645/up.v4i2.1901.
Haase A., Wolff M., Rink D. (2018) From Shrinkage to Regrowth: The Nexus Between Urban Dynamics, Land Use Change and Ecosystem Service Provision. In: Kabisch S. et al. (eds) Urban Transformations. Future City, vol 10. Springer, Cham. https://doi.org/10.1007/978-3-319-59324-1_11
Hesse, M. (2006). Suburbanization. In P. Oswalt (Ed.), Atlas of Shrinking Cities (pp. 96–97). Hatje Cantz: Ostfildern.
Jaroszewska, E. (2019). Urban shrinkage and regeneration of an old industrial city: The case of Wałbrzych in Poland. Quaestiones Geographicae, 38(2), 75–90. https://doi.org/10.2478/quageo-2019-0023.
Kooiman, N., Latten, J., & Bontje, M. (2018). Human Capital Migration: A Longitudinal Perspective. Tijdschrift voor economische en sociale geografie, 109(5), 644 – 660. https://doi.org/10.1111/tesg.12324.
Mallach, A. (2017). What we talk about when we talk about shrinking cities: The ambiguity of discourse and policy response in the United States. Cities, 69, 109–115. https://doi.org/10.1016/j.cities.2017.01.008.
Martine, G. (1994). A redistribuição espacial da população brasileira durante a década de 80. Texto para discussão, n. 329, IPEA: Brasília.
Martine, G. & Mcgranahan, G. (2010). Brazil´s early urban transition: what can it teach urbanizing countries? International Institute for Environment and development (IIED), UNFPA.
Merrilees, B., Miller, D., & Herington, C. (2013). City branding: A facilitating framework for stressed satellite cities. Journal of Business Research, 66(1), 37–44. https://doi.org/10.1016/j.jbusres.2011.07.021.
Metzger, J. T. (2000). Planned abandonment. The neighbourhood life-cycle theory and national urban policy. Housing Policy Debate, 11(1), 7–40. https://doi.org/10.1080/10511482.2000.9521359.
Nelle, A., Großmann, K., Haase, D., Kabisch, S., Rink, D., & Wolff, M. (2017). Urban shrinkage in Germany: An entangled web of conditions, debates and policies. Cities, 69, 116–123. https://doi.org/10.1016/j.cities.2017.02.006.
OECD (2003). Low Fertility Rates in OECD Countries: Facts and Policy Responses. OECD Social, Employment and Migration Working Papers, Paris.
Oswalt, P. & Rieniets, T. (Eds.) (2006). Atlas of Shrinking Cities. Hatje Cantz Publishers.
Pallagst, K., Fleschurz, R., & Said, S. (2017). What drives planning in a shrinking city? Tales from two German and two American cases. Town Planning Review, 88(1), 2815–2828. https://doi.org/10.3828/tpr.2017.3.
Panagopoulos, T., Guimarães, M. H., & Barreira, A. P. (2015). Influences on citizens, policy preferences for shrinking cities: a case study of four Portuguese cities. Regional Studies Regional Science, 2(1): 140–169. https://doi.org/10.1080/21681376.2015.1010225.
Park, Y. & LaFrombois, M. E. H. (2019). Planning for growth in depopulating cities: An analysis of population projections and population change in depopulating and populating US cities. Cities, 90, 237–248. https://doi.org/10.1016/j.cities.2019.02.016.
Power, A., Plöger, J. & Winkler, A. (2010). Phoenix cities. The fall and rise of great industrial cities. Joseph Rowntree Foundation. Policy Press: Bristol – UK. https://doi.org/10.2307/j.ctt9qgqch.
Rigotti, J. I. R., & Cunha, J. M. P. (2012). A migração interna nos últimos 50 anos: (des)continuidades, rupturas e recrudescimentos. XI Reunión Nacional de Investigación Demográfica em México, Sociedad Mexicana de Demográfia (SOMEDE): Águas Calientes.
Rodríguez-Pose, A. (2018). The revenge of the places that don’t matter (and what to do about it). Cambridge Journal of Regions, Economy and Society, 11(1), 189–209. https://doi.org/10.1093/cjres/rsx024.
SEDHS (Secretária de Estado de Desenvolvimento Humano e Social) (2012). O que é transferência de renda? Disponível em: http://www.sedest.df.gov.br/direitos/o-que-e-transferencia-de-renda.html.
Silva, C.M. (2012). O fluxo migratório baiano: uma análise a partir de indicadores socioeconômicos. III Simpósio Cidades Médias e Pequenas da Bahia, Feira de Santana – BA.
Siqueira, M. R, & Vianaa, M. L. T. W. (2013). A dimensão política do desenvolvimento do município brasileiro de Goiás – GO (1937–2001). XXVII Simpósio Nacional de História, Natal – RN.
Sousa, S. (2019). Local planning attitudes: Comparative content analysis of municipal director plans of shrinking Portuguese cities. Bulletin of Geography. Socio-economic Series, 44(44), 81–91. https://doi.org/10.2478/bog-2019-0017.
Tameirão, K. A., & Nogueira, M. (2013). A Problemática do Desenvolvimento Socioeconômico nos Pequenos Municípios: Estudo de Caso da Pequena Cidade de Monjolos/MG, Brasil. In 14º Encontro de Geógrafos da América Latina Lima (pp. 1–20). Lima: Egal.
Turok, I., & Mykhnenko, V. (2007). The trajectories of European cities, 1960-2005. Cities, 24(3), 165–182. https://doi.org/10.1016/j.cities.2007.01.007.
Ubarevičienė, R. & van Ham, M. (2017). Population decline in Lithuania: who lives in declining regions and who leaves? Regional Studies, Regional Science, 4(1), 57–79. https://doi.org/10.1080/21681376.2017.1313127.
UNFPA (2007). State of world population 2007. Unleashing the potential of urban growth. United Nations Population Fund, Thoraya Ahmed Obaid, Executive Director.
van den Berg, L., Drewett, R., Klaassen, L. H., Rossi, A., & Vijverberg, C. H. T. (1982). Urban Europe: A Study of Growth and Decline. Pergamon Press: Oxford.
Wolff, M., Fol, S., Roth, H., & Cunningham-Sabot, E. (2017). Is planning needed? Shrinking cities in the French urban system. Town Planning Review, 88(1), 131–145. https://doi.org/10.3828/tpr.2017.10.
Wolff, M., & Wiechmann, T. (2018). Urban growth and decline: Europe’s shrinking cities in a comparative perspective 1990–2010. European Urban and Regional Studies, 25(2), 122–139. https://doi.org/10.1177/0969776417694680.
Notes

