


Articles
ADVANTAGES AND DIFFICULTIES OF TRANSPORT BY CHARTER AS AN ENABLER OF UNIVERSITY EDUCATION IN NORTHEAST BRAZIL
VANTAGENS E DIFICULDADES DE TRANSPORTE POR FRETAMENTO COMO UM FACILITADOR DA EDUCAÇÃO UNIVERSITÁRIA NO NORDESTE DO BRASIL
Revista Produção e Desenvolvimento
Centro Federal de Educação Tecnológica Celso Suckow da Fonseca, Brasil
ISSN-e: 2446-9580
Periodicity: Frecuencia continua
vol. 3, no. 1, 2017
Received: 03 March 2017
Accepted: 29 April 2017
Abstract: This paper reveals the travel characteristics; direct and indirect costs and travel times; users? perceptions with respect to reliability, comfort and safety; and impact on the quality of academic performance for students of UFPE (Centro Acadêmico do Agreste), located in Caruaru, Brazil, which has 3,000 students from 70 cities. Almost 50% of these students live in cities located within 100 km of Caruaru and commute for three hours on average (round-trip). These trips are mostly performed on non-regular intercity transport, chartered by users or municipalities. This kind of transport, apparently inadequate in operational terms, makes access to higher education possible for a significant proportion of students, keeping them residents of their hometowns.
Keywords: Accessibility, Commute, Charter Transport, Transport to Campus.
Resumo: Este artigo revela as características de viagem, custos diretos/indiretos e tempos de viagem, percepções dos usuários da UFPE com relação à confiabilidade, conforto e segurança, e impacto sobre a qualidade do desempenho acadêmico de estudantes do Centro Acadêmico do Agreste, localizado em Caruaru, Brasil, que tem 3.000 estudantes de 70 cidades. Quase 50% desses estudantes vivem em cidades localizadas dentro de 100 km de Caruaru para três horas e comutar em média (ida e volta). Estas viagens são, em sua maioria, realizadas por transporte interurbano não regular, fretado por usuários ou municípios. Em termos operacionais, estes tipos de transporte aparentam inadequados, mas tornam possível o acesso ao ensino superior de porção significativa de estudantes, mantendo-os moradores de suas cidades natais.
Palavras-chave: Acessibilidade, deslocamento, Transporte por fretamento, Transporte ao Campus.
1. INTRODUCTION
Higher education grew massively in most countries throughout the 20th century. In many developing countries the growth has been even faster during the last decades. The opening of new university campuses in developing countries resulted in an increase in the number of students residing off-campus. Those commuter students are disadvantaged when compared to their on-campus counterparts. They tend to spend more travelling time; which could otherwise be used productively in studying for instance. External factors, such as congestion and unreliable public transport systems, may result in some students arriving late, tired or missing lectures ( MBARA; CELLIERS, 2013). Brazilian public university education has a past characterized by centralization ? it was generally located in large urban centres, with a limited amount of courses offered ( MARTINS, 2002). Access to higher education institutions represented a major obstacle to be overcome by students living in areas remote from these centres due to, among other things, travel expenses and living and other costs during the period in college.
Over the past ten years, however, the internalization of public higher education?s educational structures has been followed by an increase in new places, showing that higher education has become a priority of the national education policy. It has without doubt changed the dynamics of access to university for young people in the interior of Brazil. Since the Federal Government?s establishment of a programme called REUNI, 126 new university campuses have been created in the country. In 2002, Brazil had 174 public university campuses; this number had reached 274 by the end of 2010. Today, federal universities operate in 237 municipalities. The number of places offered grew from 109,200 in 2003 to 222,400 in 2010 ( BRAZIL, 2010). From 2001 to 2010, enrollments in high courses in public and private institutions (including distance courses) more than doubled, from 3,036,113 to 6,379,299 ( BARROS, 2010). This new reality, however, is still poorly studied in the literature on transport accessibility to rural campuses.
This decentralization of public higher education, made it possible for the Universidade Federal de Pernambuco, which until then had only one campus, in the State capital, Recife, to expand its operations to the hinterland. It were opened two new campuses: the Centro Acadêmico do Agreste (CAA) in Caruaru, 140 km from Recife, and the Centro Acadêmico de Vitória (CAV) in Vitoria de Santo Antão, 60 km from Recife. The regional character of these new campuses reveals, as a key issue, the importance of studying the accessibility conditions of students, understanding their needs and perspectives, their socioeconomic background and the spatial distribution of their origins.
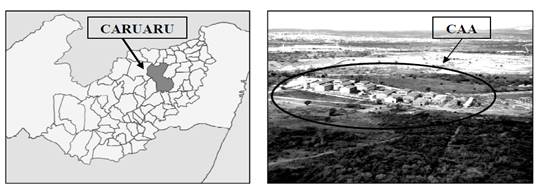
The Agreste Region where the CAA Campus is located occupies a surface of 24,000 km2, which represents about 25% of the State of Pernambuco total territory ( Figure 1). It has a population of approximately 1.8 million inhabitants (25% of the state population) distributed in 71 municipalities. Caruaru, the largest city in the region, has a population of about 320,000 inhabitants (18% of the total), 89% of them living in urban areas ( IBGE, 2010).

This region is characterized by contrasts due to the wide socioeconomic diversity of its population. According to the classification proposed by the Secretaria de Assuntos Estratégicos - SAE in the last Brazilian Census ( BRAZIL, 2010), the Agreste region has 53% of its population considered as middle class, almost the same as the national average. However, the average ratings for the poor and very poor varies, being approximately 44.8% of the Agreste population compared to 34% of whole Brazil.
CAA Campus in Caruaru serves students from about 70 cities of Pernambuco. About 50% of these students live in cities within 20 to 100 km of the campus and make daily round trips of two to three hours? duration. The public transport network available for regular intercity trips does not attend to student needs in terms of quantity of supply and adequacy of schedules. For students who do not own private vehicles it remains the possibility of solving their travel needs and demands to campus, through alternative modes of transport like chartered vans and buses.
CAA Campus is located close to an intersection of two major federal highways (BR-232 and BR-104) and is additionally served by a network of state complementary roads, allowing easy access from many different localities. This road network operates in general at a reasonable level of service and presents good spatial distribution. In this region, the use of vans, buses and adapted vehicles, which operate as non-regular means of public transport, is very popular, mainly for intercity trips. Due to this popularity, the convenience of time scheduling, its affordability for users and its economic viability for situations of small and dispersed demand, the use of this means of transport, mainly chartered, has become the main solution to students? mobility needs.
Currently, trips to CAA Campus mostly use non-regular intercity transportation chartered by users or municipalities. This type of transport, which is apparently operationally inadequate, makes access to higher education possible for a significant proportion of students within the region, keeping them residents of their hometowns as well as reducing their families? expenses.
In taking a deeper look at these issues, the aim is to improve the transport conditions for students who live outside the city of Caruaru in their operational and institutional aspects. This paper aims to outline public transport policies to support the internalization of higher education in Brazil ? such as, for example, the provision of subsidies for transport and the implementation of appropriate regulation of this means of transport.
Further, it reveals the reasons for and consequences of the choice to use chartered transport as a means of access to the CAA Campus on the part of about 47.5% of the 3,000 students who attend classes in the day and evening periods.
Interviews were carried out with a sample of students and questions about the impact on school performance as a result of transport conditions, with respect to reliability, comfort and travel safety, were undertaken. The answers to these questions will enable UFPE managers to propose to transport authorities, measures to increase efficiency in the operation and regulation of public transport. Additionally, the research results may highlight ways to improve the financial assistance that the university provides to students from low-income families.
This paper is structured in six sections. Following this introduction, there is a brief literature review on issues related to commuting to university campuses. In sequence, a description of the region where the Centro Acadêmico do Agreste (CAA) is located, and where the empirical work was undertaken. Then a brief characterization of the CAA as a trip generator site is presented. The fourth section describes the method used in the survey. The results are shown in sequence. The final section outlines the main conclusions.
2. LITERATURE REVIEW
In the last two decades, there has been an expressive growth of higher education institutions world-wide. This growth has not only been limited to new university campuses, but an expansion of existing ones as well. In the present century, in most of the world?s wealthier nations, the proportion of the population undertaking higher education has grown by 20%. In many developing countries and emerging economies, the growth has been even stronger ( WILLIAMS, 2011). For instance, China, India, South Africa and Brazil have experienced unprecedented growths in their Higher Education sectors in the last decades. Student enrolment in China increased from two million in 1997 to the current 27 million, reaching the highest ranking in the world (WU; ZHENG, 2008, apud MBARA; CELLIERS, 2013). India, with more than 700 public and private universities and almost 20 million university students, has experienced an annual growth rate of approximately 6% since 1985 ( DREDUCATION, 2013). In South Africa, the population of students in public universities increased from about 495,000 in 1993 to almost 900,000 in 2013. This represents a nearly 82% increase in student numbers since the advent of democracy (UNIVERSITY WORLD NEWS, 2016). In Brazil the number of students in universities grew almost 75% in the period from 2004 to 2014 ( BRAZIL, 2014). This unique growth in quantity of university students has undoubtedly generated lodging restrictions, forcing a great part of students to live outside campus.
According to Horn and Berktold (1989), almost 86% of university students in the United States are defined as commuter student. They commute to campus for several reasons, as they may have competing responsibilities outside the classroom, such as family, home, and work interests. Transportation problems are a main part of commuter concerns. Some are due to limited parking availability; some to classes at difficult scheduled times to attend. Also, because of long commutes to school, these students may find difficulty attending such classes, which are more easily accessible for residential students. Similarly, in South Africa, the University of Johannesburg in 2010 had only 6,000 students living in the campuses from a student population of approximately 48,000. Hence, approximately 78% of students have to travel to the university for lectures. Their travel time to the campus take an average of 38 min ( MBARA; CELLIERS, 2013).
Due to the fact that some academic activities may be planned during weekends, early mornings or late evenings, such times are inconvenient to commuter students, who may have to adjust their travelling schedules. Therefore, these students are more susceptible to meet problems in adapting schedules and attending classes at such times. Furthermore, late evening classes also may represent a security risk to them (ibid). Tinto (1994) deduced that commuter students are disadvantaged when compared to the campus residents. He inferred that commuters spent less time on campus creating relationships with other students and professors and clearly had less opportunity to engage in quality interactions. Thereby, these students are less likely to make a decisive dedication to their studies. Besides the limited social contact opportunities, they also spend a considerable amount of time travelling. This is worthless time and does not add any value to their learning experiences ( MBARA; CELLIERS, 2013).
There are also numerous external factors, such as congestion and unreliable public transport systems, which may result in some students arriving late, tired or missing lectures altogether with adverse effects on their learning. A survey by Kasayira; Chipandambira e Hungwe (2007) in a medium sized university in Zimbabwe found that transport is included in the five most common clusters of stressors, together with financial problems, lack of study material, poor accommodation and food. Transport were rated as most common and most difficult by both sexes as well as by resident, non-resident students and students in different academic years. The student?s strategy to cope with this problem has been walking and the use of alternative modes.
Mbara & Celliers (2013), in a survey in four metropolitan campuses of University of Johannesburg reports that, students made an average of five trips per week in several modes: walking (33%) was the most common, followed by bus (25%), minibus (21%) and car (14%). Rail, metered taxi, bicycle and motorbike use was small. Almost 77% of students used one mode of transport making direct journeys. Eighteen percent of them used two modes, 4.5% used three modes and less than 1.0% used more than four modes to reach the campus. The quantity of students who exceeded four modes was insignificant.
Travel and waiting time are important to measure quality of service. Students took an average of 38 min traveling to the campuses. Notwithstanding these relatively modest average-traveling times, there were students residing outside metropolitan area, whose travelling time exceeded five hours. Students who used public transport experienced longer waiting times. Average waiting times for taxi, bus and rail were 15 min, 24 min and 26 min respectively (ibid).
During the focus group discussions, some students stated that long journeys sometimes leads to being late for lectures, increasing the level of fatigue, and consequently affecting concentration (ibid). Table 1 summarises the major problems and solutions cited by the students:
| Challenges | Solutions |
| No direct services between place of residence and campus | Direct bus from residential areas to campus |
| Traffic congestion | Students discounts on public transport |
| Waiting in queues for long periods | City to provide infrastructure for cyclists |
| Arriving late for lectures, tests and exams | More dedicated bus lanes |
| Harassment from taxi drivers | Increase on-campus accommodation |
| Inefficient public transport | Reduced fares to students |
| Crime and robbery by thugs | Increase number of buses |
| Safety and security problems, especially for female | Provide public transport from campus do train stations |
| Erratic trains and bus schedules | |
| Accidents, notably by taxis | |
| High public transport fares | |
| Overcrowded and uncomfortable taxis | |
| Malfunctioning traffic lights and road blocks |
Despite the clear differences observed in many studies, according to Jacoby (1986), university staff in general do not perceive the needs of commuter students, as they usually do not include their demands into policies, programs, and actions. Commuter students tend to be treated equally as residential students, like a homogeneous group. Many of the frustrations and problems facing university personnel who are instituting programs for commuter students are related to the lack of recognizing the diversity and singularity of this important group.
3. CAA CAMPUS AS A TRIP GENERATOR
In general, university campuses are considered major trip attractors. An intense activity generates significant congestion levels in the vicinity of urban campuses, which tend to increase. To solve this externality, some major components must be considered in a comprehensive campus transport plan, such as, traffic management, safety and security, accessibility, mobility, and parking facilities ( ALDRETE-SANCHEZ; SHELTON; CHEU, 2010).
CAA Campus is situated on the northern edge of the urban area of Caruaru, 8 km from the city centre and 140 km from Recife, the state capital of Pernambuco, Brazil. The campus is served by only one regular bus line, with a maximum of four hourly operations connecting it to the city centre. The CAA Campus currently offers 10 graduation courses and three postgraduate programmes, attended by about 3,000 students. In addition, 180 professors and 60 administrative people work compound the campus staff.
The CAA has characteristics of a trip generator site, defined as a location where activities are developed in size and scale, capable of exerting great attractiveness to the population and producing a significant number of trips (MAIA et al., 2010). Trips generated by educational institutions such as CAA occur on a regular and programmed basis. The most significant trips for these institutions are those undertaken by its regular users: students, professors and administrative staff. Normally the peak hours coincide with the peak times of moving from home to the workplace via the access roads and transportation systems ( PORTUGAL et al., 2012). In Figure 3, three peak periods of different intensity can be observed at the CAA site, which correspond exactly with the beginning and ending of class shifts.
The boundaries of a trip generator site?s influence area are determined by variables such as size of facilities and places offered access roads and transport networks, geographic city density, physical barriers, travel times and distance travelled and costs involved in reaching destinations. Usually, a contour line highlighting isodistances and/or the isochronous is adopted ( PORTUGAL; GOLDNER (2003); KNEIB (2004); SILVA (2006); KNEIB et al. (2010)), as defined forward:
Isochrones: lines that connect points with equal travel time to the project site. These lines are drawn based on travel times of the major routes providing access to the site, considering the time taken in the normal flow of vehicles and observing the speed limit of the road;
Isodistances: circular lines, representing a given distance (in kilometres) to the location of the trip generator site.
Figure 4 shows the city and access network around Caruaru and CAA, highlighting the isochrones with time journeys varying from 30 minutes to two hours and 30 minutes, and then encompassing almost all of the trips attracted. The data shown were obtained in an origin and destination survey held in 2011 ( ANDRADE et al., 2011) with a sample of campus users (students, professors, administrative staff and service providers).
The travel time distribution (one way) in all modes of transport to CAA shows that more than half of the trips are carried out in less than one hour, and that 80% of those trips take less than 90 minutes. The longer trips with more than two hours of travel time represent only 8% of total trips (see Figure 5). Regarding the distribution of distances, observed in Figure 6, almost 57% of the students? travel distances were less than 20 km (originating in the Caruaru area); about 80% of trips were of distances below 60 km and only about 10% of trips exceeded 100 km.
It is also observed in Figure 4 that trips are more strongly concentrated in cities crossed by highways with better mobility levels, such as BR-232 (Recife, Gravatá, Bezerros, Belo Jardim and São Caetano), BR-104 (Toritama, Taquaritinga do Norte, Santa Cruz do Capibaribe and Agrestina) and BR-423 (Cachoeirinha, Lajedo and Garanhuns).
One of the reasons that justify the feasibility of a travel attraction over greater distances, as in the case of CAA, is the high average speed of journeys and the flexibility of travelling from point to point in accordance with a schedule suitable to the user?s demand.
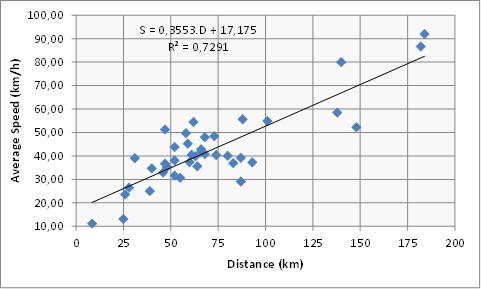
Figure 7 shows that despite variations when considering all modes of transportation, the average speed increases at a rate of 3.5 km/h with every 10 km of increase in travel distance to the CAA. For example, the average travel speed for a distance of 20 km (within Caruaru and surroundings) is 24 km/h, while for a distance of 140 km (from the Metropolitan Area of Recife) the average speed is about 67 km/h. Shorter distances with a high percentage of urban traffic induce low operational speeds, while larger distances on unobstructed highways and without intermediate stops produce trips of acceptable travel times, enabling, under this particular approach, students to continue living in their place of origin.
The distribution of CAA trips? origins demonstrates the regional character of this campus. From the study held in 2011 by Andrade et al., it can be seen that the CAA Campus is accessed daily by 55% of students living in Caruaru, with a transport distance of less than 20 km, and by 45% of students from the other 41 cities, with transport distances ranging from 20 to 40 km (10% of the total), 41 to 60 km (15%) and 61 to 80 km (6.5%). Furthermore, 10% of the students travel over 100 km every day. The average travel distance calculated from the sample was 35.5 km.
Initial consideration of the types of vehicles that access the campus provides the observation that despite the high prevalence (73.2%) of individual transport vehicles (cars and motorcycles) compared to public transport vehicles (regular urban buses, chartered buses and vans); they correspond to only 23% of users. Public transport, in turn, represents 22.8% of the vehicle total but carries 76.7% of CAA users. This means that the majority of users access the CAA Campus travelling predominantly in public transport vehicles.
Another important aspect is that the number of trips to the CAA by chartered bus or chartered vans represents 82% of total access by public transport vehicles, compared to about 18% by regular urban bus services, as can be seen in Table 2. When analysing the number of passengers travelling by the various collective modes, the figure rises to 44.3% using urban and/or regular interurban transport and 55.7% chartered vehicles.
| Private Car | Taxi | Motorcycle | Motorcycle taxi | Urban Bus | Chartered Bus | Chartered Vans | Other | Total | |
| Vehicle | 543 | 5 | 142 | 27 | 39 | 49 | 127 | 6 | 938 |
| Percentage | 57.9% | 0.5% | 15.1% | 2.9% | 4.2% | 5.2% | 13.5% | 0.6% | 100% |
| Users | 487 | 3 | 119 | 3 | 893 | 350 | 772 | 3 | 2,630 |
| Percentage | 18.5% | 0.1% | 4.5% | 0.1% | 34.0% | 13.3% | 29.4% | 0.1% | 100% |
As shown in Table 3, the distribution of modal choices in relation to distance travelled in home-school trips reveals that use of private transport and transport by regular bus service is concentrated basically on shorter trips. It also shows that 70% of the students who use chartered buses live in cities with greater transport demands, with distance varying from 40 to 80 km. The use of chartered vans is well distributed across all travel distances because it depends more on the size of the demand; therefore one can argues that small vehicles are best suited to meet low transportation demands of smaller communities.
| Distance (km) | Private Car | Motorcycle | Urban Bus | Chartered Bus | Chartered Van |
| < 20 | 75.0% | 91.6% | 85.8% | 13.8% | 24.5% |
| 21 to 40 | 3.4% | 2.8% | 7.6% | 9.5% | 18.6% |
| 41 to 60 | 5.4% | 5.6% | 4.7% | 41.2% | 22.8% |
| 61 to 80 | 1.3% | - | 0.4% | 28.4% | 9.7% |
| 81 to 100 | 2.7% | - | 0.3% | 5.8% | 2.5% |
| > 100 | 12.2% | - | 1.1% | 1.0% | 21.9% |
| Average (km) | 12.2 | 12.4 | 14.4 | 52.4 | 59.4 |
Chartered transportation to CAA, and its division between buses and vans (low capacity passenger vehicles), can be further classified by the number of seats offered. This subdivision characterizes the diversity of sizes in the region?s transportation market, emphasizing situations of greater or lesser spatial concentration of demands. Table 4shows the percentage use distribution of these vehicles by type and the quantity of available seats per vehicle.
| Passenger vehicle type | Percentage ? vehicle used | Number of seats available |
| Standard bus | 23.75% | 3?50 |
| Micro bus | 10.25% | 15?25 |
| Van | 57.25% | 10?15 |
| Jeep Toyota (modified) | 8.75% | 8?12 |
These tables show the importance of chartered transport to the case study analysed due to the diversity of locations where the users live, with consequent demand dispersion on routes and schedules appropriate to small groups of students. This peculiarity is the key aspect related to the accessibility of the CAA campus and makes this distinct from other studies reported on the literature, which focus mainly on university campuses located in greater urban agglomerations or metropolitan areas.
4. METHODS
The quantitative and qualitative method is based on a sample survey of users of non-scheduled charter transport, and aims to discover their socioeconomic profile, the reasons for their modal choice and the characteristics of travel concerning transport costs and type of vehicles used. Additionally, the research identifies the user?s perceptions of the quality and convenience of the transport service, and the impacts that this type of transport may have on their regularity, punctuality, assiduity and physical and emotional motivation to participate in academic activities.
To answer these questions, a questionnaire was developed to be applied exclusively to students who were users of charter transport. The sample size of this qualitative study was based on quantitative research into the accessibility of the CAA campus conducted by Andrade et al. (2011). At that time, three surveys were conducted. One counted vehicles by type and another counted people accessing the campus; both of these were undertaken over three days from 7:00am to 22:30pm. The third included interviews to discover the trip?s characteristics, such as origin, transportation modes used and hours of leaving home, arrival at and departure from CAA.
The 2011 survey has guaranteed results within a confidence interval of between 93 and 94% and statistical error between 6 and 7%. Interviews were conducted with 806 campus users in general. Among the respondents, 42.7% reported using modes of charter transportation. Thus, within the same confidence interval, new qualitative research with a sample of 345 students was programmed. However, during the survey, a strike began at the CAA and the number of interviews was reduced to 265. Despite this problem, the research reached a confidence level of 90%, within a statistical error margin of 10% (as demonstrated below), which is considered acceptable for its intended purpose.
 (1)
(1)Where:
n = sample size for a finite population, calculated equal to 266
N = population size = 345 students using transportation by charter
s = standard deviation = 39 km (distance travelled variable obtained in the survey)
za/2 = 1,645 (critical value to 90% of confidence level)
E= statistical error margin (10% of the mean of 35 km, also obtained in the survey)
The structure of the survey questionnaire was divided into topics and is presented below:
In order to identify student users of chartered transportation, interviews were conducted upon their arrival at the campus. To better distribute the sample, we chose at random two individuals arriving in small vehicles (vans and Toyotas), three in medium vehicles (minibuses) and up to five in larger vehicles (standard buses). The number of interviews conducted was proportionally divided based on the number of students enrolled for an academic period (60% at night and 40% during the day).
5. RESULTS AND DISCUSSIONS
The household income of users of chartered transport to CAA differs strongly from the household income distribution in the Agreste region. While 74.4% of the region's population has a family income of up to two times the Brazilian minimum wage, only 12.7% of students lie in this income group. Furthermore, the average household income for this group is more than twice the average of the general population?s income. This may be explained by the fact that there is a strong correlation between the level of formal education and the family income. The household income of CAA students is generally among the higher income group in the region.
Another interesting finding is that the chartered transport users are well distributed over all income levels. This fact allows to reach a preliminary conclusion that the choice of this modes is based more on convenience than on the financial capacity to support private modes of transport, mainly for those whose families earn more than six or seven times the Brazilian minimum wage (15.3%; see Table 5).
| Household Income Distribution | ||
| Chartered Transport Users | Population in General | |
| < 1 Minimum Wage | 4.98% | 44.80% |
| 1.1 to 2 Minimum Wage | 7.69% | 29.64% |
| 2.1 to 3 Minimum Wage | 33.94% | 11.64% |
| 3.1 to 4 Minimum Wage | 12.67% | 8.08% |
| 4.1 to 5 Minimum Wage | 19.46% | |
| 5.1 to 6 Minimum Wage | 5.88% | 5.80% |
| 6.1 to 7 Minimum Wage | 7.24% | |
| > 7.1 Minimum Wage | 8.14% | |
| Average in Minimum Wage | 3.75 | 1.80 |
Among users of chartered transport, almost 70% pay the transport operator from their own resources, 14% have payment provided by their municipalities and 16% have their costs paid by the university through a special assistance fund for students.
It can be observed that only one third of students from families with incomes of up to three times the Brazilian minimum wage who are users of chartered transport receive transport assistance. To meet the long-distance transportation demand in this income range, it is estimated that financial support is needed by 660 students, which is equivalent to one quarter of the students enrolled at CAA. As in 2012, the UFPE was granting transport aid of between R$ 50 and R$ 150 for 642 CAA students and about 200 students (approximately 14% of total chartered transport) benefit from transportation provided by the municipalities, the amount of support offered by the programme is sufficient to meet the current demand.
Despite the sufficient financial support for the students? transportation needs, it has been verified that some students in the relevant income range do not receive it. It is possible that less needy people are benefiting, to the detriment of others who should be entitled to receive support.
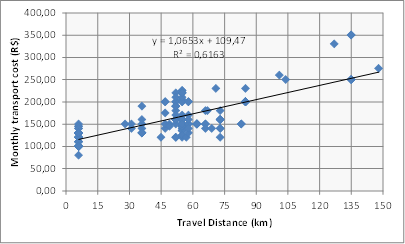
In analysing the costs of transport for the CAA students, as observed in Figure 8, it can be seen that even the highest monthly amount of transport aid provided (R$ 150) is, on average, not sufficient to cover distances of over 60 km, which concentrate about 35% of chartered transport demand. Smaller values of between R$ 50 and R$ 100 only cover part of the students? mobility costs, independent of the distance travelled.
In the survey, chartered transport users considered the following aspects most relevant: modal choice, operational travel attributes such as regularity, point-to-point travel, scheduling convenience and safety. The hierarchy of these and other attributes, especially those regarding costs, depends on the user's situation with regard to how they pay their travel expenses. However, the importance attributed to travel costs depends neither on the student?s family income nor on transport distance, allowing the interpretation that the choice is based on the only viable alternative.
To prove the practical unfeasibility of daily use of private transport to CAA based on the economic profile of the students that lives outside Caruaru, one can compare the private average costs per kilometre to chartered transport costs based on the same travel distance. If a distance of 50 km is presumed, the cost per kilometre of transport by charter is R$ 0.08 (from the formula in Figure 8). The estimated cost per kilometre of R$ 1.20 for private cars takes into consideration the use of a standard vehicle with a purchase price of R$ 35,000, depreciated to R$ 27,500 after three years of use, running 10,000 km/year, considering an opportunity cost equivalent to an annual yield of 8%, insurance, maintenance and licensing costs of R$ 3,500 a year, fuel price at R$ 2.50/l and an average consumption of 9.2 km/l. Based on these parameters for a transport distance of 50 km, the monthly expense of private transport is estimated at R$ 2,400, which represents approximately four times the Brazilian minimum wage or 15 times more than the cost of transport by charter per passenger. Even if these costs were shared by four students, the cost of private transport would still be almost four times higher. Observing the distribution of income among students who use chartered transportation, it is seen that only 8.14% (with incomes exceeding seven times the minimum wage) would be able to afford the cost of travelling daily to CAA via private transport.
The differences in average speed, at 56 km/h for a private car and 42 km/h for transportation by charter, which were captured in the survey show, for example, that the time saving on a 50 km trip, which stands at around 17 minutes, obviously does not compensate for the large differences in travel costs between the two modes. This fact makes the option of a chartered transport even more advantageous, mainly due to the relatively low average CAA student?s household income.
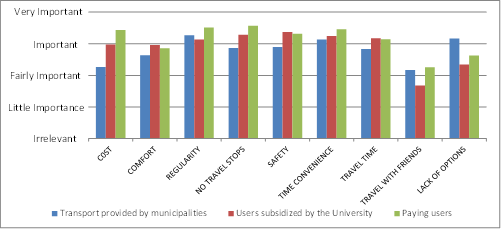
For economic reasons, the level of importance given to the issue of transport costs is less relevant for non-paying users (transportation provided by the municipality) than for those receiving student aid (partial funding). This last group ascribed less relevance to costs than those who pay the full trip costs (compare the histogram bars of Figure 9).
The three groups of chartered transportation users ordered the four attributes considering their importance in terms of modal choice, as follows:
Transportation provided by the municipalities: regularity, schedule convenience, lack of options and safety;
Transportation subsidized by the student assistance programme: Safety, no travel stops, schedule convenience and regularity;
Transportation paid by the user: no travel stops, regularity, schedule convenience and costs.
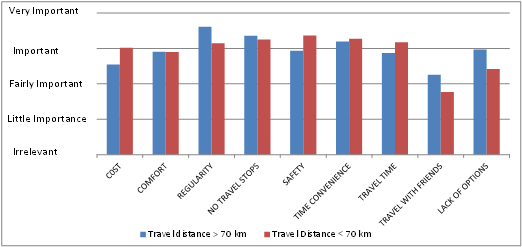
In analysing the attributes that influenced modal choice, considering the distance of 70 km from CAA, it can be seen that there is not a great discrepancy between the groups (see Figure 10). Regularity, non-stop travel and the lack of other options are considered slightly more relevant for long trips, while aspects of cost, safety and travel time have greater dominance in choices regarding journeys of smaller distances.
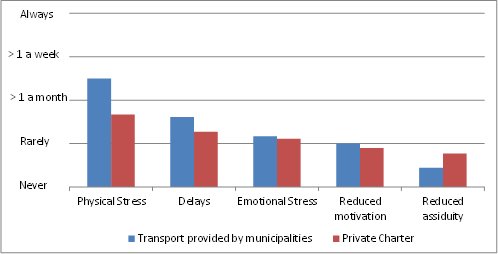
In general, the students surveyed reported that use of chartered transport rarely produces delays and emotional stress or reduces attendance and motivation to pursue studies. Nevertheless, physical stress is the condition most often reported by users as a result of the type of transport chosen. For 30% of users, the trips produce physical stress always or almost always; 23% of the respondents reported this occurring at least once a week.
Despite the importance ascribed to regularity in modal choice, about 15% of users reported the frequent occurrence of lateness in service and 18% said it occurred sporadically. From these figures, one can see that for almost 2/3 of students, the trips are always completed within the scheduled time. This fact explains the importance ascribed to the regularity of non-stop travel to achieve the desired transport efficiency.
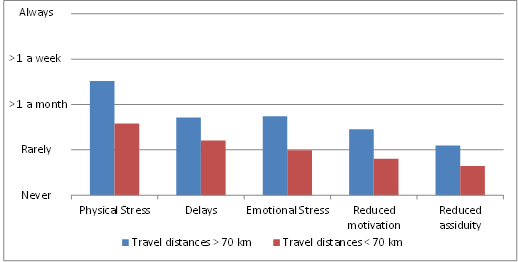
Larger transport distances produce different consequences with regard to the choice of transport by charter, as can be seen in Figure 12. This leads to a conclusion already expected: that there are limitations in the transport distance for daily trips, to the achievement of user satisfaction on efficiency and effectiveness based on the type of transport chosen.
Physical and emotional stress or reduced motivation to attend class are quite often reported for travel times of over 3 hours and 30 minutes (round-trip) and for travel distances of over 70 km. Impacts on students' academic performance (medium to high) were commonly reported for travel times of up to three hours (round-trip) and distances exceeding 60 km.
6. CONCLUSION
The research results on the modal split in access to the CAA campus demonstrate the great importance of informal transport by chartered bus or van to the viability of university education, especially for students living outside the city of Caruaru. This is a mobility characteristic not previously observed in accessibility studies regarding higher education institutions in Brazil, which usually focus on large urban centres. These features sh
ould be repeated in other regional campuses located in hinterland Brazil, making the methods and results of this work also useful for similar situations.
In CAA, transportation by charter is not only used as it is the more viable and practical alternative of transport available, but also because it is the cheapest option and is compatible with the per capita income profile of the students in the Agreste of Pernambuco.
Therefore, considering the overall content discussed above, the majority of users ascribe high value to attributes related to the effectiveness of the chartered transport and report that its consequences for school performance are acceptable, especially for travel distances below 70 km.
Despite the relative acceptance of the transportation conditions offered, this research indicated the need for a better understanding of students? concepts of safety and comfort of travel, since a considerable proportion of the vehicles currently used are old and poorly maintained. An issue of interest may be to recognize possible improvement for the transport service offered. The need to introduce a framework of regulation to the service may also be another issue to be considered. Further studies can be undertaken on the appropriateness of students? transport assistance programmes and rules of eligibility and real market service charged by operators.
Acknowledgments
The authors acknowledge the support of CNPq, National Council for Scientific and Technological Development - CNPq Brazil.
REFERENCES
ALDRETE-SANCHEZ, R; SHELTON, J.; CHEU, R.L., Integrating the transportation system with a university campus transportation master plan: a case study, Report 0-6608-2, Project 0-6608, 2010, Texas transportation institute
ANDRADE, M. O.; MEIRA, L. H.; and MAIA, M. L. O transporte fretado para a viabilização da acessibilidade a um campus regional no interior do Nordeste. Anais... XXV ANPET ? Congresso de Pesquisa e Ensino em Transportes. Belo Horizonte, Brazil, 2011.
BARROS, A. S. X. Expansão da educação superior no Brasil: Limites e possibilidades. Educ. Soc., Campinas, v. 36, n. 131, p. 361-390, 2015
BRASIL. Perguntas e respostas sobre a definição de classe média. SAE ? Secretaria de Assuntos Estratégicos. Brasília, Brazil, 2010. Available in <www.sae.gov.br/site/?=p13431>. Accessed in June 2014.
BRASIL, Ministério da Educação, Portal da Educação. Disponível em http://www.brasil.gov.br/educacao/2015/12/numero-de-estudantes-universitarios-cresce-25-em-10-anos. Accessed in 28/02/2017.
CONDEPE-FIDEM. Cadernos municipais: Base de Dados do Estado (BDE). Agência Estadual de Planejamento e Pesquisas de Pernambuco ? Condepe-Fidem. Recife, Brazil, 2011a. Available in <www.bde.pe.gov.br/estruturacaogeral/filtroCadernoEstatistico.aspx>. Access in July 2015.
CONDEPE-FIDEM. PIB Municipal de Pernambuco. Agência Estadual de Planejamento e Pesquisas de Pernambuco ? Condepe-Fidem. Recife, Brazil, 2011b. Available in <www2.condepefidem.pe.gov.br/c/portal/layout?p_l_id=PUB.1557.63>. Accessed in July 2015.
DREDUCATION. Statistics on Indian Higher Education 2012-2013, 2013. Available in http://www.dreducation.com/2013/08/data-statistics-india-student-college.html. Accessed July 2015
HORN, L.J.; BERKTOLD, J. Commuter Students ? Commuter Students Challenges, Education Encyclopedia ? State University.com, 2002. Access in 09 November 2013, from http://www.education.stateuniversity.com/pages/1875/Commuter-Students.html
IBGE. População Residente, Total, Urbana Total e Urbana na Sede Municipal, em Números Absolutos e Relativos, com Indicação da Área Total e Densidade Demográfica, Segundo os Municípios ? Pernambuco - 2010. Instituto Brasileiro de Geografia e Estatística ? IBGE. Brasília, Brazil, 2010. Available in <www.ibge.gov.br/home/estatistica/populacao/censo2010/tabelas_pdf/Pernambuco.pdf>. Accessed in July 2014.
JACOBY, B. The student-as-commuter: developing a comprehensive institutional response. (Report No. 7). Washington, D. C.: George Washington University Clearinghouse on Higher Education. 1989, ERIC Identifier: ED319297.
JACQUES, M. A. P.; BERTAZZO, A. B. S.; GALARRAGA, J.; HERZ, M.; PINTO, I. M. D. Estabelecimentos de Ensino. Cadernos Polos Geradores de Viagens Orientados à Qualidade de Vida e Ambiental. Rede Íbero-Americana de Estudo em Polos Geradores. Rio de Janeiro, Brazil, 2010.
KASAYRA, J. M; CHIPANDAMBIRA K. S; HUNGWE C. Stressors faced by university students and their coping strategies: a case study of Midlands State University students in Zimbabwe, 2007. DOI: 10.1109/FIE.2007.4417807 Conference: Frontiers In Education Conference - Global Engineering: Knowledge Without Borders, Opportunities Without Passports.
KNEIB, E. C. Caracterização de Empreendimentos Geradores de Viagens: Contribuição Conceitual à Análise de seus Impactos no Uso, Ocupação e Valorização do Solo Urbano. Doctoral Thesis, Engenharia de Transportes, Universidade de Brasília. Brasília, Brasil, 2004.
KNEIB, E. C.; LEMOS, D.; ANDRADE, E.; AND PALHARES, M. Caracterização dos Polos Geradores de Viagens. Cadernos Polos Geradores de Viagens Orientados à Qualidade de Vida e Ambiental. Rede Íbero-Americana de Estudo em Polos Geradores. Rio de Janeiro, Brazil, 2010.
MARTINS, C. B. A formação de um sistema de ensino superior de massa. Revista Brasileira de Ciências Sociais, v.17, n.48, p.197-203, February 2002. Available in <www.scielo.br/pdf/rbcsoc/v17n48/13956.pdf>. Accessed in July 2015.
MBARA, T.C., CELLIERS, C. Travel patterns and challenges experienced by University of Johannesburg off-campus students. Journal of Transport and Supply Chain Management, v.7, n.1, Art. #114, 2013. http://dx.doi.org/10.4102/jtscm.v7i1.114.
PORTUGAL, L S.; GOLDNER, L. G. Estudos de polos geradores de tráfego e de seus impactos nos sistemas viários e de transportes. São Paulo, Brazil, 2003.
SILVA, L. R.; KNEIB, E. C.; SILVA, P. C. M. Proposta Metodológica para Definição da Área de Influência de Pólos Geradores de Viagens Considerando Características Próprias e Aspectos Dinâmicos do seu Entorno. Engenharia Civil UM, nº. 27, 2006. Available in <www.redpgv.ufrj.br>. Accessed in April 2014.
TINTO, V. Leaving College: Rethinking the causes and cure of student attrition, The University of Chicago Press ? Second Edition 312 pages, 1994.
WILLIAMS, G. Will Higher Education be the Next Bubble to Burst?, The Europa World of Learning, 2011. Access in 18 May 2012, from http://www.educationarena.com/pdf/sample/sample-essay-williams.pdf

