Abstract: This paper analyzes the main challenges of the design and implementation of sustainable urban mobility plans (SUMP) after law 12,587 in 2012, called the National Urban Mobility Policy (PNMU, in Portuguese). With the new law, municipalities with a population of 20,000 inhabitants or more, as well as those required by law to draw up master plans, are now compelled to elaborate mobility plans. However, only 171 of almost 3,400 municipalities required to prepare the plans had done so by 2015, the first deadline, later extended to 2018. This paper examines a set of municipalities in the Rio de Janeiro metropolitan area and tries to understand what are the main challenges to achieving the goal of sustainable mobility and what are the main differences between the European and the Brazilian governmental perspectives in the subject. A survey on the main barriers was applied to five local entities, and to the state and national level entities. Four methods of hierarchization were applied. Among the factors that stand out most are the lack of resources to elaborate the plan, lack of integration between levels of government and problems with the training and the availability of personnel in the responsible agencies of the municipalities.
Keywords: challenges in the mobility plan,government perspective,Brazilian National Urban Mobility Policy.
Resumo: Este artigo é um esforço para analisar os principais desafios da elaboração e implementação de planos de mobilidade urbana sustentável (SUMP) após sancionamento da lei 12.587 em 2012, denominada Política Nacional de Mobilidade Urbana (PNMU). Com a nova lei, os municípios com população superior a 20.000 habitantes, bem como os exigidos por lei para elaborar planos diretores, agora são obrigados a elaborar planos de mobilidade. No entanto, apenas 171 de quase 3.400 municípios obrigados a preparar os planos os possuiam até 2015, o primeiro inicial, posteriormente estendido até 2018. Este artigo analiza um conjunto de municípios da região metropolitana do Rio de Janeiro e tenta entender quais são os principais desafios para alcançar o objetivo da mobilidade sustentável e as principais diferenças entre as perspectivas governamentais européias e brasileiras sobre o assunto. Um questionário sobre as principais barreiras foi aplicada em cinco entidades locais, e nas entidades estaduais e nacionais. Foram utilizados quatro métodos de hierarquização. Entre barreiras mais críticas destacam-se a falta de recursos para elaborar o plano, a falta de integração entre os níveis de governo e problemas associados a capacitação e falta de pessoal nas secretarias municipais.
Palavras-chave: desafios nos planos de mobilidade, perspectiva governamental, Política Nacional de Mobilidade Urbana.
Articles
THE GOVERNMENTAL PERSPECTIVE IN URBAN MOBILITY PLAN-MAKING: THE CASE OF THE PERIPHERAL MUNICIPALITIES OF RIO DE JANEIRO METROPOLITAN AREA
A PERSPECTIVA GOVERNAMENTAL DA ELABORAÇÃO DE PLANOS DE MOBILIDADE: O CASO DE MUNICÍPIOS PERIFÉRICOS DA REGIÃO METROPOLITANA DO RIO DE JANEIRO
Received: 22 September 2017
Accepted: 04 October 2017
In 2012, Law 12,587, which established the National Urban Mobility Policy (PNMU, in Portuguese), was sanctioned by the Presidency ( BRASIL, 2012). This legal milestone represented for the country the need for paradigm shifts in Brazilian cities: among other characteristics, it includes a mandatory periodic planning that assigns greater importance to active and public modes of transportation. This obligation theoretically eliminated the detachment of municipalities in relation to transport and mobility planning, which would turn this activity, often carried out as mere responses to demands, into an act to be consolidated.
Under this new law, municipalities with more than 20,000 inhabitants, in addition to all the ones required to draw up a master plan, should also develop an urban mobility plan by April 2015. Thus, the number of municipalities with the requirement to draw up urban mobility plans has passed from 38 ( IPEA, 2012) to more than 3,000 (MINISTÉRIO DAS CIDADES, 2015). This obligation already existed due to the fact that Law No. 10,257/01, the City Statute, already required the drawing up of transport master plans, similar to mobility plans, for cities with more than 500,000 inhabitants ( BRASIL, 2001). In view of this obligation, in 2007 the Ministry of Cities (Ministério das Cidades, in portuguese) prepared a document that would be the seed of the current guide, PlanMob - Reference book for the design of an Urban Mobility Plan ( MINISTÉRIO DAS CIDADES, 2007). According to Vieira (2012), this document presented a precise technical, practical and conceptual framework, which highlighted the importance of feasibility studies, popular participation, and so on. However, it was pointed out that the guide did not determine a standard procedure to be followed and it was also mentioned as a deficiency the absence of revision techniques, which were mandatory every ten years.
Still, according to data from the Basic Municipal Information Research ( IBGE, 2012), of all municipalities with more than 20,000 inhabitants, 16.12% did not have the specific structure for a transport management body of any kind, 74.52% had no municipal transportation plan and were not involved in the design of it, and 90.95% did not have a municipal transport fund. Regarding such data, it may be inferred that most Brazilian cities are not prepared to implement Law 12,587/12. In effect, the PNMU compelled municipalities to draw up plans by a maximum deadline of April 2015 if they were to receive federal budgetary resources for urban mobility. This obligation was initially postponed to 2019 by means of a Provisional Measure and in 2016 a new text was issued extending the deadline to April 2018.
It is important to note that although the data presented above indicates, at the local level, the lack of government structure for drawing up the plans, there are also problems related to the mobility plans already elaborated. When Oliveira (2014) analyzed the Belo Horizonte 2012 Mobility Plan, he observed the non-compliance with some guidelines of the PNMU, e.g. those related to mechanisms for the monitoring and evaluation of the pre-determined goals, and the lack of popular participation in the process. It is important to point out that the Belo Horizonte plan was designed between 2007 and 2010, i.e. prior to the sanctioning of the policy. Even so, this fact is worrisome, for it implies that even local governments of major cities, which have access to technical and financial capacity could not follow the guidelines of the Policy.
It should be noted that the increase in income and ownership of private cars, coupled with the decentralization of our cities, has dramatically increased the number of trips in much of the world. In addition to being more frequent in number, these trips are also becoming increasingly longer and consist of cars with a single occupant ( CERVERO, 1998). Due to the quasi-natural nature of this vicious cycle, the strengthening of unsustainable transport, the sprawl of Brazilian cities, the challenge of offering services and utilities where they are needed, and the June Journeys, a set of riots in June 2013 triggered by dissatisfactions with public transport, transportation was added as a fundamental right in the Federal Constitution in 2015 ( BRASIL, 2015).
In view of the problems presented and the recurrent dissatisfaction with the status quo of the State's passivity over transport and mobility planning, the importance of studying the process of planning to underpin the sustainable development of cities is essential so that there is no misapplication of resources dedicated to the area. Due to this consideration, this paper aims to identify the main barriers to the design and implementation of sustainable urban mobility plans (SUMP) in the context of the National Urban Mobility Policy. It also attempts to turn away from more commonly studied themes of transport policies, such as application tools and computational methods. Rather, it evaluates the government perspective, which is rarely a pressing issue of academic works on transportation planning and mobility ( MARSDEN AND REARDON, 2017).
In order to focus on the most critical barriers a survey was designed based on the main challenges to the planning of sustainable urban mobility in European countries that have passed by similar situation. European documents were selected for two reasons. The first is that Europe has extensive know-how in sustainable urban mobility planning. Secondly, it is in the interest of identifying the main differences between two scenarios, Brazilian and European, and identifying possible opportunities for policy-transfer based on studies such as Bray, Taylor, Scrafton (2011); Macário and Marques(2008); Marsden and Stead (2011); O?Dolan and Rye(2012); Timms (2014) and Wang (2010). Due to the extent and scope of a survey of this type, the questionnaire was applied to a small and restricted group of participants selected from entities directly related to the elaboration and implementation of these plans (municipal, metropolitan and federal public bodies).
This paper is divided into five parts apart from this introduction. The structure used follows the logical and chronological reasoning of the elaboration of this work, in which the second section deals with the selection process of the analyzed entities, the views from the ones who have provided answers, and how the characteristics of the entities they are part of can, and should, affect the answers of the surveys. The third part deals with the acknowledgement of which are the main barriers, also called challenges, to the sustainable urban mobility. The fourth section deals with the applied methodological procedure, i.e. the structure of the survey, the scale used and the procedures for analyzing the answers given. And finally, the fifth and sixth section present the results, discussions and conclusions of the paper.
As the expectation of applying the survey was to characterize the problems related to the elaboration and implementation of urban mobility plans, the selection of a region whose municipalities have demonstrated deficient mobility was essential. When analyzing data for the metropolitan areas of Belo Horizonte, São Paulo, Rio de Janeiro, Federal District, Curitiba, Porto Alegre, Salvador, Recife, Fortaleza and Belém, for the year of 2013, it is observed that practically all of them have an average work-home travel time exceeding 30 minutes (except Porto Alegre, which has 29.5 minutes) ( PERO and STEFANELLI, 2015). More specifically, Rio de Janeiro with 50.2 minutes and São Paulo with 45.7 minutes are the metropolitan areas that have the worst average travel time. Analyzing the distribution of these times by income, the regions of the Federal District and Curitiba are the ones with the highest percentage difference between the richest decile and the poorest decile, with Salvador and Rio de Janeiro being the regions with the lowest percentage differences. Nevertheless, it was also noticeable that, although Rio de Janeiro has little difference among its citizens in terms of average travel time, the best average travel time of the Rio de Janeiro metropolitan area is higher than all others, except for São Paulo's poorest decile. In view of this fact, a specific group from the Rio de Janeiro metropolitan area (RMRJ, in Portuguese) was chosen to apply the survey.
The Rio de Janeiro metropolitan area is geomorphologically limited by a chain of mountains that reach more than 2,200 meters high. It is bordered on the north by the Sea mountains and northwest by the Macaws? mountains. The region has as some of its icons the Guanabara Bay in the center and a plain area between the sea and the coastal massifs called the Baixada Fluminense ( MODELAR A METRÓPOLE, 2016). The area is formed by 21 municipalities and has a population of more than 12,000,000 inhabitants, the second largest of Brazil. It?s influence on territorial management, specifically on federal and business management, makes the region a National Metropolis in the study of urban hierarchies ( IBGE,2008), tied with Brasília and losing only to São Paulo.
In socioeconomic aspects, Rio de Janeiro metropolitan area is unique due to a historical factor: it comprises two former capitals. The municipality of Rio de Janeiro was the capital of Brazil and the state of Guanabara until the consolidation of the transfer to Brasilia in 1970 and Niterói was the capital of the state of Rio de Janeiro until the merging of the states of Guanabara and Rio de Janeiro in 1975. These losses of status resulted negative impacts that can be felt until now, as federal district and capital of the state of Guanabara, Rio de Janeiro possessed the privilege of collecting taxes without the burden to automatic distribute to other municipalities. This fact, associated with the disordered population growth in Brazilian cities in the 60s generated a precariousness of the periphery that is greater than what is experienced in any other Brazilian metropolitan areas. This happened because both peripheric municipalities and Rio de Janeiro received a population whose goal was to work in the city of Rio, but the peripheric municipalities were not entitled to the public resources generated by this population in the companies they worked because the city of Rio de Janeiro and its periphery belonged to different states. That is, while the percentage growth of the population was similar in the peripheral municipalities and in Rio de Janeiro, which results in an increase in the fiscal expenditure, the increase of public revenue markedly favoured the state of Guanabara, the Rio de Janeiro Federal District ( IETS, 2016).
Indeed, it is shown in Figure 1, in which the average travel times and travel flows in the metropolitan area of Rio de Janeiro are presented, the continuity of a diagnosis that is already quite old. Niterói and Rio de Janeiro are metropolitan trip attraction centres, generating high dependence of the peripheric municipalities of each side of the bay for its nearest pole. This dependence shows itself in the form of a large number of trips over one hour, especially in the municipalities of the Baixada Fluminense and east of Guanabara Bay.
Other relevant factors to selecting the study group from the metropolitan area of Rio de Janeiro were the ease of communication, since the state government already had a specific entity for metropolitan management, called the Metropolitan Chamber, which was elaborating a strategic plan that had mobility at its centre. Other factor was that in 2015 a consortium was assigned to draw up plans for the mobility between some municipalities in the metropolitan region and other locations of the state of Rio de Janeiro, in compliance with Law 12,587/12. This consortium is called PROMOB, a partnership that was initially formed by the municipalities of Queimados, Nova Iguaçu, Belford Roxo, Mesquita, Nilópolis and São João de Meriti. The agreement was later expanded due the entry of Magé, Itaboraí and São Gonçalo, totaling the nine current municipalities, as seen on Figure 2.
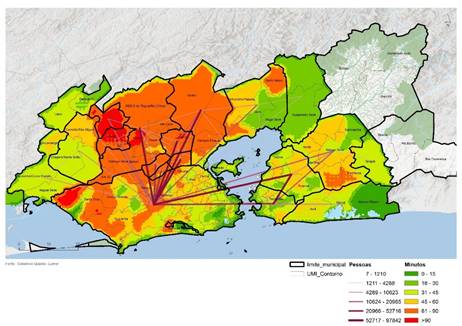
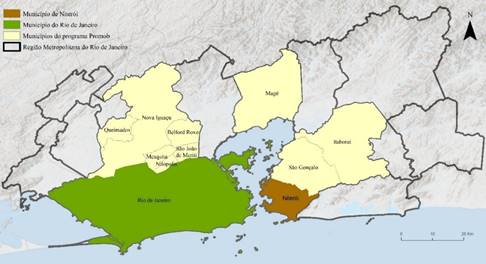
Figure 2
Municipalities of the Promob program and the municipalities of Rio de Janeiro and Niterói.
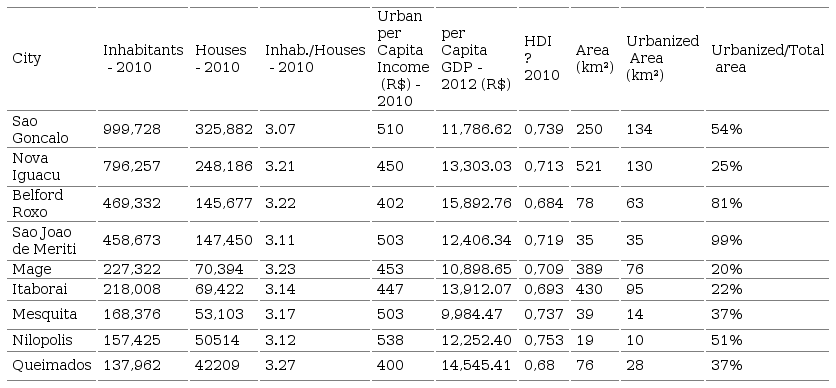
The nine participating municipalities have similar socioeconomic characteristics as can be seen in table 1. In a cluster analysis of more than 3,000 Brazilian municipalities required to draw up mobility plans, eight of the nine municipalities of the program are associated with the same group, with only Nova Iguaçu associated with another. Concerning common characteristics, the group that comprises those eight municipalities is mostly composed by cities that belong to metropolitan regions and have socioeconomic factors, such as HDI, number of cars per capita, and percentage of the population with access to sidewalks, close to the national average. The grouping that contains Nova Iguaçu is also formed mostly by municipalities that are part of metropolitan regions, but whose variables are above the national average. The majority of the latter grouping consists of state capitals (among the capitals, only Palmas - TO, Boa Vista - RR, Macapá - AP, Florianópolis - SC, Porto Velho - RO and Aracajú ? SE, of the 26 states do not belong to this group).
The concept of sustainable urban mobility and related themes are being increasingly studied in the academic literature. In a survey of the term ?sustainable mobility? in the Web of Science database, it?s notable the exponential behavior of publications and citations since 1992. Despite this, little has been discussed about the perspective of governments, which are the main agent of public policies, on the challenges for a sustainable urban mobility plan. Due to this, and in order to better understand the governmental vision, governmental reports, works of specific commissions or papers that discussed or analyzed these documents were given greater relevance for the review of the barriers. The selected texts deal only with observed barriers and the selected journal articles deal with complementary issues not reported in the documents obtained, such as the implementation of sustainable policies in Brazil or in the Latin American region.
May (2015) carried out an extensive bibliographical review on the barriers to the elaboration and implementation of an efficient sustainable urban mobility plan, some of these studies will be presented in this section, as well as new documents. ATKINS (2007) and DISTILLATE ( MAY, PAGE AND HULL, 2008; TRICKER AND HULL, 2005) performed studies during the three implementation phases of the so-called Local Transport Plan (LTP) in United Kingdom cities during the 2000s. These three phases are defined by the way national guidelines were implemented. The first and second phases (LTP1 and LTP2) are characterized by a situation with prescriptions and guides to be followed by cities. The third (LTP3) was characterized by a situation where there was national orientation, but the cities had considerable flexibility, while the last phase (Post-LTP3) was one in which cities had total capacity, and therefore, they did not need guidance. IMPACT ( Gudmundsson, 2007), a study similar to DISTILLATE and Atkins, was conducted in Sweden to obtain the main barriers to the Scandinavian approach to sustainable urban mobility planning.
Concerning the European continent as a whole, the studies of the European Conference of Ministers for Transport (ECMT, 2002, 2006) were part of a fifteen-year program that carried out case studies and applied questionnaires in various cities about their competencies in implementing sustainable mobility planning. The ELTISplus project ( ELTISPLUS, 2012,2014) has grouped the identified barriers according to three levels: the barriers encountered in countries with already well-established sustainable planning, the barriers in countries that are mobilizing for sustainable planning and those in countries that have not yet adopted sustainable mobility planning. Due to the objective of this paper, only barriers related to countries that are still mobilizing for the development of sustainable planning were analyzed, since they resemble the current Brazilian scenario.
Lindau, Hidalgo and de Almeida Lobo (2014), studying the implementation of BRT systems, identified problems related to technical and institutional capacity, lack of alignment among stakeholders, bias for planning individual motorized modes, opposition of local bus operators and lack of popular participation. Miranda et al. (2009) carried out a study on Brazilian barriers and noted some shortcomings that compromised the elaboration of adequate plans, among which it is highlighted that technicians and managers did not have sufficient knowledge, that the country did not have the necessary legal arrangement for the promotion of mobility policies, and the planners' priority for the motorized individual mode.
Furthermore, Banister (2005) reports that there are forces that prevent a policy/measure from being implemented. These forces, called barriers, can be divided into six categories: resource barriers, related to the adequate quantity of an input (e.g. time or money); institutional and policy barriers, which concern problems of coordination between different levels of government, between areas of the same government, and general administrative issues of the entities; social and cultural barriers, which include public acceptance of the measures; legal barriers, which consist of the legal framework to adopt necessary policies; the barriers of side-effects, which are those whose implementation can generate so many externalities that their implementation becomes impracticable; and the physical barriers, related to the space constraints or the topography of the area.
For this paper, a group of thirty barriers were selected from the literature review, from the authors? experience and from expert insights on the field. They were divided into challenges of resources, institutional, political, legal, academic and physical problems. Resource barriers have been associated with inputs for designing and implementing a plan, such as money, time and personnel. Institutional barriers were associated with issues of technical capacity of institutions, while the political ones were about integration of entities, and the ability to dialogue and find a consensus towards more sustainable visions of possible opposing forces The legal barriers were related to legal protection of actions, the academic ones to the absence of possible solutions in the literature, and the physical ones concern the urban constraints of space and geomorphology.
The proposed methodological procedure was based on a review on the elaboration of questionnaires defined by Malhotra and Birks (2007), which indicate six tasks typically present in the preparation of a survey, namely:
- 1. Define the necessary information;
- 2. Decide the general design of the survey (exploratory or conclusive);
- 3. Define techniques for measuring responses;
- 4. Prepare and make previous tests;
- 5. Specify the qualitative or quantitative approach by defining the sample size;
- 6. Develop the plan to analyze the obtained data.
The desired information was the determination of the most critical barriers for the planning of sustainable urban mobility in the perspective of the local planner of peripheric municipalities in the study area. Based on risk analysis, which considers an action as critical the greater its cost and its possibility of occurrence, it was thought more coherent to assess the criticality of the barriers by highlighting two aspects, the relevance of the barrier (how important it is to solve that problem) and its difficulty (how difficult it is to solve that problem). It is necessary to keep in mind that the application of a survey is a time optimization problem, in which the interviewer needs to obtain the highest number of consistent responses subject to the shortest possible time. Given the large number of barriers to appraise and the nature of the interviewees, a brief and conclusive questionnaire was essential.
As for the characteristics, exploratory surveys differ from the conclusive ones in the phrasing of the question. Exploratory questionnaires tend to have a flexible structure, with open questions, and those with a conclusive character are on the opposite side. This latter type has a rigid structure, closed questions and is recommended for quantitative analysis. Since the barriers were raised through previous bibliographic review and low availability of respondents, it was more consistent to apply a conclusive survey.
As for the scale used, Stevens(1946) seminal paper defined them in four types: nominal, ordinal, interval and ratio. Nominal variables only identify the element, an example would be the numbering of athletes on a football team. The ordinal variables, as the name itself suggests, imply order information, i.e. the element A is greater than B, while B is greater than C and therefore A is greater than C, but it is not known how further apart they are. Interval scales are similar to ordinal ones, however each point in the scale has equal distance between its adjacent ones. Finally, the ratio scales are those that have point 0, i.e. the non-existence of the measured property, which allows a comparison of more complex averages and statistical analysis procedures, due to the existence of a clear reference point.
Due to its popularity, mainly for measurements in the area of ??psychology and its suitability in obtaining the feeling of the interviewees ( Hartley, 2014), a scale similar to Likert?s was used. This scale consists of a set of statements in which respondents must declare their agreement according to levels ranging from strongly agree to strongly disagree. The sums or averages of the responses of each set are made to represent the total value of the item ( Harpe, 2015). Over the years, this scale has been modified to better suit the needs of researchers, not only it has been structured with affirmative phrases, but it has also indicated the level of importance of each item. Therefore, the term "Likert scale" is not recommend, but rather "Likert-type scale" or "Likert item" ( Uebersax, 2006). Thus, the two aspects of the barriers were divided into five levels of evaluation. The relevance was divided from "very relevant" to "very irrelevant", the neutral value being "neither relevant nor irrelevant", and the difficulty to solve was divided into "very difficult" to "very easy", the neutral value being "neither easy or difficult ".
In addition to the municipalities participating in the consortium, the federal and state governments were also selected to answer. The main purpose of adding these entities was to verify possible different views among different levels of government. Then, surveys were sent by e-mail to the technicians responsible for mobility planning in the nine municipalities participating of the PROMOB, plus the Ministry of Cities, the federal entity responsible for urban mobility in Brazil, and the Metropolitan Chamber/RJ, the state entity responsible for drawing up the integrated urban development plan and responsible for metropolitan area integration, totaling 11 interviewees. Local and state entities also received a printed version of the survey, but preferred to answer it online.
The choice of Likert-type scale has its positive and negative aspects. Because it is a widely used scale in the social sciences, it is established and grounded as an efficient scale in understanding the people?s judgements. Its biggest negative point lies in its statistical permissiveness. Since it is an ordinal scale, the linearity between the adjacent values ?? (i.e. Good is ?one unit? below Very Good) is not guaranteed, and therefore should be adopted as a premise in all analyzes. In spite of this, Agresti (2010) recommends several analysis that can be applied to ordinal variables using as few assumptions as possible.
First, before analyzing the answers themselves, it is recommended to analyze the reliability of the measuring instrument, the scale. One of the most used forms is through the analysis of internal consistency by means of Crohnbach's alpha ( CRONBACH, 1951; PALLANT, 2005). The alpha index can be understood as an estimate of how uniformly the items with the same measurement scale contribute to the unweighted sum of the instrument, varying from 0 to 1. Thus the smaller the sum of item variances relative to the total variance of the subjects, the coefficient approaches 1 and more reliable is the instrument ( MAROCO and GARCIA-MARQUES, 2006). There is no consensus regarding the value considered satisfactory for alpha, but in its review of the use of this index, it was observed Peterson (1994) that values ??from 0.7 or 0.8 are the most used and accepted as satisfactory.
In relation to the hierarchization of the barriers, some ways to estimate scores with ordinal variables are demonstrated in Agresti (2010). The simplest and most consistent way consists of using cumulative probability to obtain the median of the answers. Alternatively, the author state that values ??can be defined for items of the scale by treating it as an interval scale, and calculating the average of the respondents. Considering the simplicity in obtaining the results computationally, both methods will be applied. The values ??used to translate the terms of the Likert-type scale were from 1 up to 5 for the two aspects, values ??that are widely used and accepted in the analyzed literature.
After the statistical treatment of the scales, four hierarchical analyzes of the barriers were applied. The first two were carried out with the combination of the respondents, that is, for the N combinations of the set C of respondents, we calculated the mean and median for the
 combination of respondents. The variables were standardized and the hierarchization was performed from the frequency in which the barriers, within the set N of combinations, satisfied, at the same time, the restriction of positivity in both the axes of relevance and difficulty.
The other two methods are based on Risk-Adjusted Mean (RAM) analysis proposed by
Gosavi (2015), inspired by a similar model used in artificial intelligence applications (
Gosavi, 2006,2014). The model initially consists of applying weights to different characteristics of the same element. Assuming p (i) is the weight associated with a given characteristic of the barrier (relevance or difficulty) in the characteristics universe I, where 0 ? p (i) ? 1 for all i and
 , the interviewee's assessment of a barrier will be given by the equation
(1).
, the interviewee's assessment of a barrier will be given by the equation
(1).
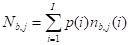 (1)
(1)In which N
b,j is the final score for the barrier b given by the interviewee j belonging to the set J of de interviewed and
 is the aspect?s final score of the b barriers given by the interviewee j. Then the mean of the responses by the expression
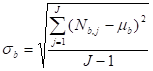
(2) and the standard deviation by the expression
(3)are calculated.
is the aspect?s final score of the b barriers given by the interviewee j. Then the mean of the responses by the expression
(2) and the standard deviation by the expression
(3)are calculated.
 (2)
(2)
 (3)
(3)The RAM analysis can be described as a model that penalizes the central tendency of the measure by its variance. It assumes that the greater the variance, the smaller the consensus on the measure, and the smaller the criticality should be. That is, by assuming that two barriers have the same mean, the one with the highest standard deviation is ranked below the one with the least deviation, for the applied penalty decreases its overall importance. Thus, expression (4) is applied to perform this penalty, where ? is a positive constant ranging from 0.1 to 0.3, depending on the extent of the desired penalty.
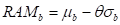 (4)
(4)From a total of eleven respondents, Nilópolis, Queimados, Itaboraí and São João de Meriti did not answer, totaling a response rate of 64%. In general, it was noticed that there was practically no variation between the answers given by the representatives, especially concerning the relevance of the barriers. Almost all barriers were considered important or very important. As for the difficulty, the variation was slightly higher. Thus, a positive aspect of the methodology applied was that the hierarchizations were highly sensitive to variance.
The first analysis was that of internal consistency, calculated by Cronbach's Alpha. The found Alpha value was 0.821, greater than the commonly used acceptance limit of 0.7. This result indicates that the measurement scale is coherent, since the relation of the variance of the items by the variance of the respondents' totals is small, indicating that all the respondents measured or understood the constructs in the same way. A common analysis in Cronbach's alpha evaluation is the analysis of how the alpha increases when a given construct is excluded from analysis. According to the investigation, no variables, if excluded, would increase the alpha value to above 0.9, which would raise the internal consistency of the survey to a level considered excellent in most studies, thus, no variable was excluded of the final analysis.
Regarding the hierarchy of barriers, four methods were applied, as presented in the section 2. The medians method is very similar to the means method, differentiating only by the measure of central tendency. In Figure 3, the results of the median analysis for two barriers ("Obtain resources for infrastructure implementation " and "Obtain resources to subsidize public transport operation", respectively) are seen. Since 127 combinations of respondents were possible, each point in the figure is the standardized median of one of these combinations. The median and mean hierarchization are determined by the probability of a barrier being considered critical, i.e. the probability is calculated by the frequency of points that are in the positive quadrant of both relevance and difficulty divided by the total frequency of points. By the method, it is perceived that barrier B5, "Obtain resource for infrastructure implementation", is much more critical than barrier B6, "Obtain resources to subsidize public transport operation", as the probabilities of being considered critical are of 100% and 31,5%, respectively.
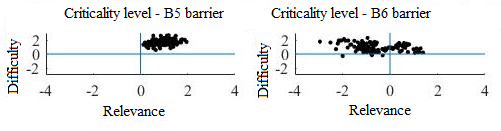
Figure 3
Example of median analysis graph
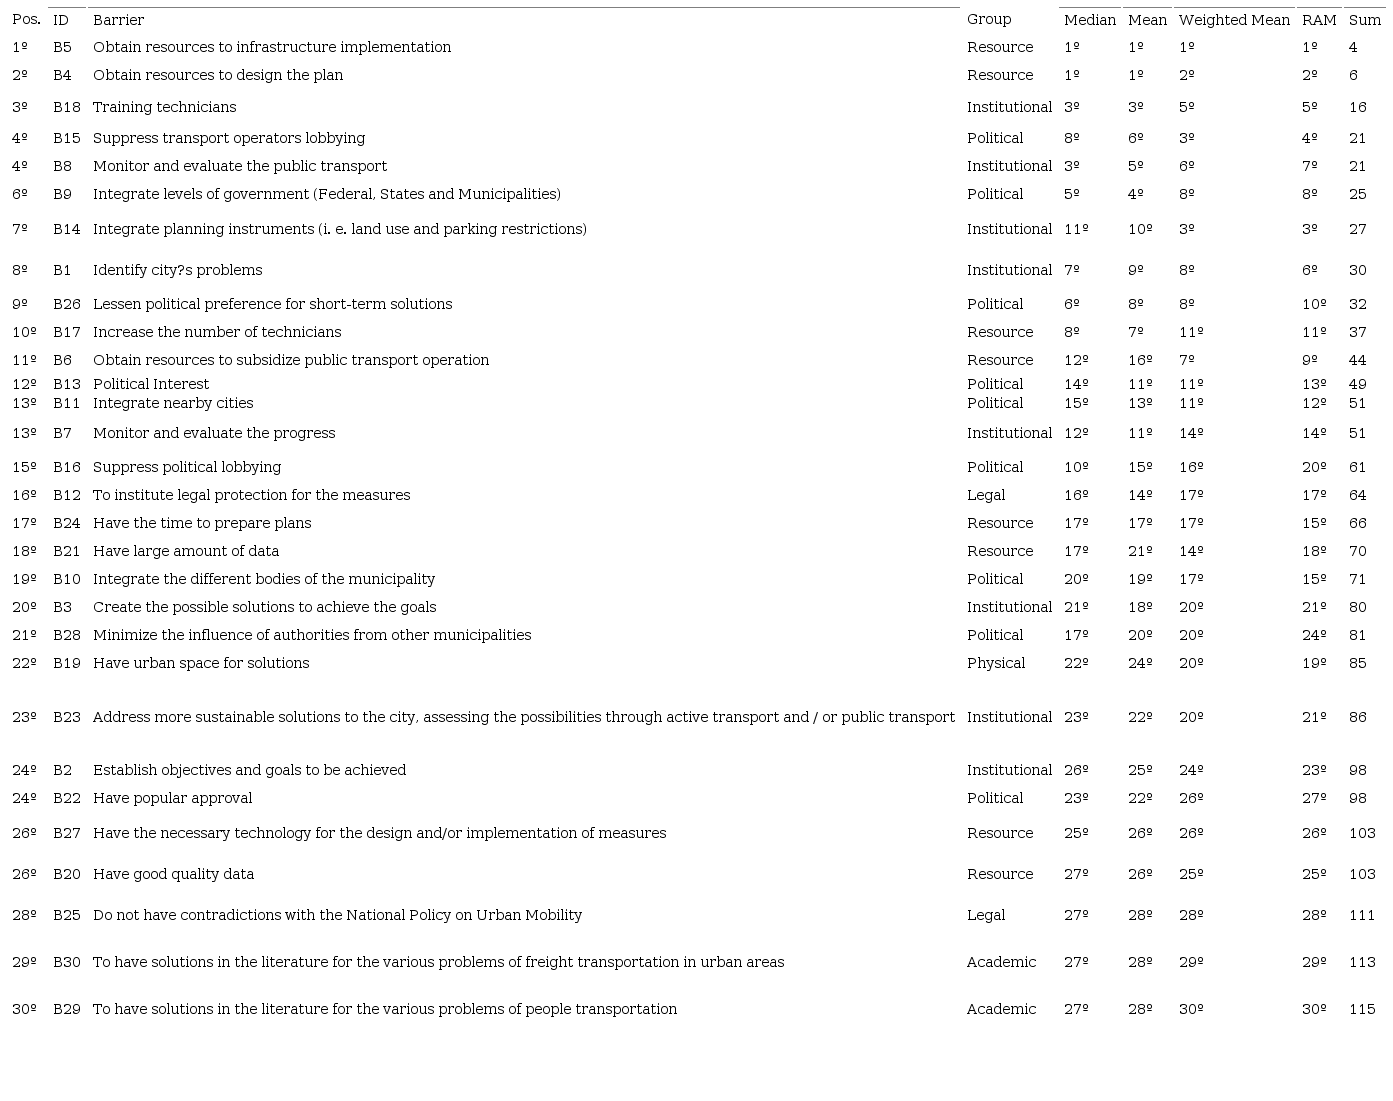
The other set of analyzes for hierarchical classification was the weighted mean and the risk adjusted mean (RAM). For this analyzes, we considered that the group of characteristics of relevance and difficulty have the same weight in relation to the final average, so p (relevance) = p (difficulty) = 0.5 in equation (1). Due to the small variance of the responses, for the calculation of the risk-adjusted mean, the adopted ? was 0.3, indicating a higher penalty for barriers with higher standard deviation in the responses. In Table 2 we have the summary of the ranking for each of the four methods applied. The final rank of each barrier was given by the sum of its position on each of the four models.
Hierarchical Results Summary
To better understand the extent of the differences amongst the methods, we analyzed the variation of responses in all of them. In Figure 4, a graph of the positions of each barrier is presented by the two methods that had the largest variance, the median and the RAM. It is important to emphasize that when two barriers presented the same degree of criticality, they were classified in the same position. Although it is not possible to break the tie by using the applied methods, it is possible to verify that they are classified above others and, therefore, must count in the hierarchal classification. Take barriers B4 and B5, for instance, which tied first in the method of the medians. As previously stated, although it is impossible by this method to define which is the most important, it is known that both are more critical than the B8 barrier and, therefore, this is the third more critical, and it is necessary to adopt this position. As the RAM method applies a penalty on the means according to the standard deviation, it ends up by sorting the barriers by their measured variance, resulting in small deviations of the function y = x in Figure 4. However, with some exceptions, there is little difference among the methods.
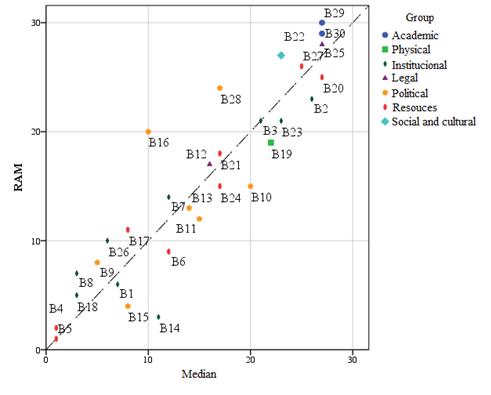
Figure 4
Positions by Median and RAM methods
In order to aid the analysis of the barriers, a method of internal clustering was used to cluster those into three groups of smaller variances. The first group is formed by the ten most critical barriers, which are: "B5 - Obtain resources to infrastructure implementation", "B4 - Obtain resources to design the plan", "B18 ? Training technicians", "B15 - Suppress transport operators lobbying", "B8 - Monitor and evaluate the public transport", "B9 - Integrate levels of government (Federal, States and Municipalities)", "B14 - Integrate planning instruments (i. e. land use and parking restrictions)", "B1 - Identify city?s problems", "B26 - Lessen political preference for short-term solutions" e "B17 - Increase the number of technicians ".
Of the three barriers directly related to financial resources, two were considered the most critical of the challenges. In this regard, much is discussed about municipal problems in relation to obtaining the necessary financial autonomy. Santos, Costa e Andrade (2001) say that the in the constitution of ?88 was the milestone of the decentralization process, in which, after 24 years of centralized planning processes and policies during the dictatorship, the idea of ??democracy and decentralization were strongly associated. The authors believe, however, that the decentralization was associated in the form of financial transfers to the municipalities, from federal and states levels, what was noticeable in the large number of municipalities whose main source of revenue are ICMS (Tax on Goods and Services Circulation) and IPVA (Property tax on motor vehicles) transfers and of the FPM (Municipal Participation Fund). In effect, it is not uncommon to conclude that the constitution of 1988 provided the political autonomy of municipalities without giving the necessary financial autonomy. Another relevant aspect to highlight is a snowball effect in which municipal entities, because financial constraints, are not technically able to collect their own resources through their own taxes, such as the IPTU (Urban Land and Territorial Tax).
The only barrier of the financial resource subgroup not established as one of the most critical was B6, "Obtain resources to subsidize public transport operation". Analyzing the reason for its ranking in depth, one may deduce that the obtainment of resources for this purpose was not considered "relevant" for the improvement of urban mobility, especially if compared with the other barriers of financial resources. This result is different from that obtained in Europe by Tricker and Hull (2005), in which this is one of the most serious barriers. In fact, there is no tendency in Brazil in terms of municipal subsidies to public transport, and it is difficult to see positive examples of such actions in the context of Brazilian municipalities. This difficulty is even manifested in the absence of an understanding of primary issues such as what and how to subsidize, and which resources to use. On the other hand, there is an apparent consensus in Europe on the need for the fare subsidy: they have extensive know-how on how to obtain and where to apply the necessary resources, coupled with the understanding of the related positive externalities, all of which result in subsidy rates usually between 45% and 70% ( EMTA, 2015).
Institutional barriers, i.e. those related to the technical capacity of local planners, were the most present among the most critical. Among them, the one with the highest ranking was barrier B18 - Training technicians. In this regard, two points should be highlighted. The first is sample-related, for most local planners, involuntarily, could tend to evaluate the more recurrent problems of everyday life as more serious. The second is the understanding that this is a really significant group of barriers and that therefore it should be analyzed more broadly and in depth. Regarding this second point, some elements should be highlighted. One is the existence of many programs and guidelines produced by the Ministry of Cities. Of particular note is the Capacities (capacidades.gov.br/) program, in which local technicians can be trained in urban issues, such as financing and drawing up plans, online. Still, discussions about institutional, especially training, problems should not be restricted to the existence of guides and programs that meet the demand of the technicians who request them. They require a full discussion, which should consider the role of universities in society, i.e. the teaching of transportation at technical, undergraduate and graduate levels, and the relationship between academia and public entities in Brazil.
The political barriers are also highlighted as among the most critical. These represent the actions of integration, dialogue and persuasion, which, alongside the barriers of resource, had the second largest distribution among the top 10. In this group, there are two somewhat dependent barriers, "B15 - Suppress transport operators lobbying" is tied with the institutional barrier "B8 - Monitor and evaluate the public transport". In this regard, two interesting aspects are that the lobby of transport operators was much more critical than the political lobby in all methods. Another aspect is that, in reality, an activity prior to the repression of the political lobby was considered more critical, that of arousing the interest of the political sphere to the subject.
Finally, the last barrier in the group of the ten most critical was "B17 - Increase the number of technicians". This barrier, which is essentially one of resources because it is an input, is directly related to those placed on the institutional barriers. It represents much more than the lack of resources to hiring professionals, it is also an indicative of the need to discuss the roles played by institutions within the context of a new imposed demand. Looking beyond the RMRJ, it should be noted that several municipalities do not even have transportation bodies. In this perspective, the need to create innovative solutions is reinforced. An example of such solutions could be the formation of municipal consortiums to apply the guidelines of the PNMU through the law 11,107/05, the so-called law of public consortia.
As mentioned earlier, institutional barriers were the ones that had the highest number of barriers among the most critical, and was also the group that had the highest percentage of its barriers ranked among the top 10. Next in line, resource barriers and policies were virtually tied regarding the distribution between the most critical and the group total (it is highlighted that in terms of hierarchy, the barriers of resources were first placed). The legal and physical barriers associated with the legal protection of actions and the restrictions of urban space, respectively, were of medium importance and, finally, the academic barriers, which are related to the existence of literature and specific solutions to the problems observed by the interviewees, had all their items ranked among the least important.
At last, comparatively analyzing the results obtained by this specific survey in this set of municipalities and the European studies, there are significant differences between what is considered more critical. In the Brazilian perspective, the most serious resource barriers appear to be present in stages prior to the European ones. For example, while in Europe the fare subsidy is considered one of the most critical barriers to sustainable mobility, in the brazilian municipalities studied, critical resource problems are in the draw up stages the plan, and in implementing infrastructure. Other relevant issues that characterize the difference in the scenarios are the barriers related to technology, used data and popular participation. In Europe, these barriers are among the first placed in terms of seriousness, while in the context of the Rio de Janeiro metropolis these barriers are not even close to being considered the most critical. As it shall be highlighted, obtaining consensus among the population was considered relevant, but due to the low difficulty associated, it was not among the most critical. Despite several differences, some similarities were also observed. The training of technicians in the responsible bodies and external influence of operators were some of these similarities.
The concept of sustainable urban mobility has been widely discussed in academia in recent years. The concept, which was based on the Brundtland Report ( WCED, 1987), initially addressed only as the environment, social equity and economic development concepts, started to comprehend a myriad of concepts, hampering its fulfillment and making its operation impractical. In addition, urban mobility plans share the same difficulty in operationalizing mobility, except for having the need in its own core to implement its vision of development in its geographical scope.
With the enactment of the National Urban Mobility Policy in 2012, the elaboration of urban mobility plans has become mandatory for most Brazilian cities. Notably, most of these municipalities have not been able to draw up such plans until the initial 2015 deadline, and possibly the scale of "defaulting" municipalities with mobility planning will not be reduced until the new deadline of 2018. This paper intends to understand the main challenges for the design and implementation of sustainable urban mobility plans in Brazilian cities. In this regard, this work fulfills its main objective, while analyzing the municipalities that possibly have the worst mobility conditions in Brazil, it has identified that actions and studies should focus mainly on three contexts: budget and personnel resources, institutional capabilities (number of technicians and training) and monitoring, and political issues of integrating different levels of government. This work also achieved its goal of trying to understand, above all, the governmental perspective of the problem.
The study also identified differences between Brazilian and European approaches, emphasizing that we have different scenarios, with significantly different variables related to transport and mobility planning, such as: growth rates and deficits (social, economic and environmental), political systems, legal instruments, habits, and mainly different visions and perspectives. Therefore, it is necessary to understand the problems themselves, without abandoning the knowledge generated and the good practices applied in other places. Even so, the simple transfer of policies and actions must be viewed with caution, and it is necessary to consider the context in which they were applied, the need for adjustments and other actions usually described in academic literature.
Despite the positive perspective of changes in planning that consider the greater importance of active and public transport users and the theoretical elimination of municipal passivity on the subject, much still needs to be debated at all spheres and levels of government. The current scenario is at the ending of the design deadline, with the penalty of restrictions on receiving resources destined for mobility, and a current political-economic situation that curtails any debate of strategic scope. Nevertheless, the perspective of several municipalities, especially the smaller and poorer ones, whose only source of financial resource is the federal transfer through the Municipal Participation Fund, and which never even had alternative resources at their disposal, may understand the design of a SUMP as a burden from which the penalty is not being able to receive resources which they never sought or never had a real chance to obtain. In this regard, the creation of public consortia, as it is customarily the case for sanitation (garbage and sewage affairs, especially) can be a solution for these municipalities that alone have no capacity for planning and no integration.
In addition to what is pointed out above, there are still some legal aspects of the plan-making and of good practice to be followed by the municipality. The first aspect is that the Law on the National Urban Mobility Policy has not repealed any article of the City Statute, that is, municipalities with more than five hundred thousand inhabitants have a duty to draw up an urban transport plan integrated with the master plan and a plan of mobility compatible with the master plan, in the form of the law. Not only this duplicity of duties, but also the terms themselves can lead to different understandings about the need to draw up mobility plans or urban transport plans. Other problem is that it is not known whether the drawing up of the plan should be followed by approval in the respective municipal chamber of representatives, or whether the design of a mobility plan integrated or compatible with an approved master plan is enough. Although there is no clear legal aspect of the elaboration of the mobility plan, the law explicitly states that the National Urban Mobility Policy must be implemented and that plans are the instruments for implementing the policy.
Some recommendations for future work are the analysis of barriers in municipalities with different conditions, such as non-participants in metropolitan areas, municipalities with better economic and social conditions, or with different travel patterns and different urban categories. Another recommendation would be to evaluate the perception of different sectors of society and to distinguish the similarities and differences between their and those of entities such as universities, NGOs, transport operators, among others have. Finally, most of the analysis was applied due to the specificity of the survey (using ordinal variables) and the number of respondents, other hierarchical methods and other analysis, such as of correlation measurement can be used and compared with the ones applied in this work.
Figure 2
Municipalities of the Promob program and the municipalities of Rio de Janeiro and Niterói.
Figure 3
Example of median analysis graph
Hierarchical Results Summary
Figure 4
Positions by Median and RAM methods