
Productive Systems
STATISTICAL QUALITY CONTROL IN A SUPERMARKET CHAIN OF RIO GRANDE DO NORTE, BRAZIL
CONTROLE ESTATÍSTICO DA QUALIDADE EM UMA REDE DE SUPERMERCADOS DO RIO GRANDE DO NORTE, BRASIL
Revista Produção e Desenvolvimento
Centro Federal de Educação Tecnológica Celso Suckow da Fonseca, Brasil
ISSN-e: 2446-9580
Periodicity: Frecuencia continua
vol. 5, no. 1, 2019
Received: 16 January 2019
Accepted: 30 November 2019
Published: 03 December 2019
Abstract:
Purpose: This article aims to analyze the level of losses due to damage in a supermarket chain to understand the reason for these occurrences.
Methodology/Approach: From data collected in May 2018, a survey of the most critical departments and items with the highest percentage of losses was performed and statistical control was applied from the p graph. A case study in the capital of Rio Grande do Norte.
Findings:It was found that 84.6% of losses were concentrated in the meat, dairy, beverages, eggs and grocery departments. It was also found that the fraction non-conforming of losses is out of statistical control, which led to the interruption of monitoring.
Research Limitation/implication: The data provided by the company, as the reason for each breakdown of the items was not informed. Thus, without this information, quality control was interrupted.
Originality/Value of paper: This work lies in the gap of the Brazilian literature on the application of statistical quality control in losses by damaged products in a supermarket chain, since there are numerous studies that analyzed losses in supermarkets in Brazil. None of them performed damage monitoring, using the control chart p.
Keywords: losses, supermarkets, statistical quality control, nonconforming, ABC curve.
Resumo:
Objetivo: Este artigo objetiva realizar o controle estatístico de qualidade na fração de perdas por avarias em uma grande rede de supermercados do Rio Grande do Norte.
Metodologia:Os dados foram coletados em maio de 2018. Foi realizado um levantamento dos departamentos e itens mais críticos com maior percentual de perdas, e, aplicado o controle estatístico de qualidade por meio do gráfico p para averiguar se a fração de itens avariados do supermercado está sob controle estatístico ou não.
Constatações: Foi possível detectar que 84,6% das perdas estavam concentradas nos departamentos de carnes, laticínios, bebidas, ovos e mercearia. Além disso, as perdas por furto se devem ao mau posicionamento de câmeras de segurança. Foi constatado que a fração não conforme de perdas está fora de controle, motivo este que acarretou na interrupção do controle de qualidade.
Limitação / implicação da pesquisa: As limitações se devem ao banco de dados disponibilizado não fornecer a classificação/motivo das perdas, sendo assim, impossível diagnosticar as causas especiais.
Originalidade: Este trabalho se justifica pela lacuna na literatura brasileira sobre monitoramento estatístico das perdas em redes de supermercado. Não há estudos que fazem uso do gráfico p para o controle da fração não conforme de avarias.
Palavras-chave: perdas, supermercados, controle estatístico da qualidade, itens não conformes, curva ABC.
1. INTRODUCTION
Strategic planning allows the supermarket to define the business, mission, vision and principles, as well as to evaluate the internal and external environments to build the strategic posture, to elaborate the strategic objectives and goals, to create monitoring action plans ( ZANATTA et al., 2020).
In a world marked by fierce market disputes, where small operational advantages are capable of generating major competitive advantages, a particularly striking fact in retail sales, loss rates have grown steadily and become a source of concern for executives and entrepreneurs who, still today, find it difficult to identify the damaging impacts on their business bottom line. Thus, it can be said that losses are an inherent challenge to the supermarket activity and it is necessary to know, measure and prevent them to combat and remedy them ( ABRAS, 2018).
The topic of loss prevention is very recent in Brazil. Only from the 1990s, and specifically from 1998, have begun scientific studies on the subject ( COSTA, 2010). Cost reduction (maintaining the same level of quality and production) is of great importance for any company, so it is common the difficulty to find the source of losses, especially in supermarket chains, where the high percentage of products that are damaged or stolen is huge, making them impossible to sell. Therefore, considering the data presented, one comes to the research problem of this study. What steps should be taken to minimize the recurring losses of damaged products in a large supermarket chain?
With this problem proposed, this article aims to analyze the level of losses due to damage in a supermarket chain to understand the reason for these occurrences in order to present suggestions to minimize them. In addition to this objective, it is also sought to identify the most critical departments and items (higher loss rate) of the supermarket and to test statistically, through graph p, whether or not the percentage of losses is under control.
This work is justified by the relevance of presenting a diagnosis and monitoring of losses due to damage in a supermarket chain in the capital of Rio Grande do Norte, as well as providing a minimization of costs with losses. Besides the relevance to the company, there is also a great academic contribution, since in the Brazilian literature, there are numerous works ( Seidel (2001); Lana et al. (2002); Fagundes & Yamanishi (2002); Silva et al. (2003); Rangel et al. (2003); Santos (2006); Tofanelli et al. (2007), Pereira et al. (2008), Tofanelli et al. (2009), Costa (2010), Duarte (2016), Silva & Pires (2016) and Souza et al. (2016)), that analyzed losses in supermarket chains in Brazil, however, none of them performed the monitoring of losses through the fraction nonconforming control chart; Therefore, the study has relevance and acts in this gap. In particular, there is an academic contribution to Natal-RN, since Arcoverde (2010) developed a study in the same city and found no loss measurement in supermarkets.
Thus, this article is organized into five sections. After this introduction, Section 2 presents the theoretical framework addressing concepts of losses in supermarkets, as well as classifying their types. In addition, concepts of the Process of Statistical Control are presented in more detail in Chart p. Section 3 details the methodological procedures for data collection, information of the company studied and the software used. Section 4 discusses the case study analyzes, highlighting and discussing the results obtained. Finally, in Section 5, the main conclusions are presented, as well as the limitations of the work and suggestions for future studies.
2. BIBLIOGRAPHIC REVIEW
2.1 LOSSES IN THE SUPERMARKET SECTOR
At a time of low productivity and limited resources due to the post-World War II period in Japan, concerns about eliminating losses with the Toyota Production System (TPS) arose. Ohno (1997) comments that the objective of the TPS is to identify and completely eliminate losses to maximize process efficiency and thus minimize costs.
According to Santos (2006), Ren et al.(2019) and Campos-Vázquez and Medina-Cortina (2019), the supermarket sector suffers from high operating costs such as energy, water, high number of employees, high taxes, equipment maintenance, besides being in a highly competitive market. All of these factors affect the rate of return, making it low. The author also comments that one of the factors that contribute most to the lack of profitability in this type of business is losses. Many business owners, because they do not carry out a thorough study of this problem, believe that in their stores this fraction of damaged items is small and does not contribute significantly to the higher costs.
Retail loss is an output of a product from inventory without its being sold or recorded for any other reason ( Arcoverde, 2010; Svanes and Johnsen, 2019). If a product was purchased and not sold, is not in physical inventory and was not returned to the supplier, then there was a loss. Souza et al. (2016) point out as the main losses in supermarkets, waste, excesses, shelf life, breakages, improper storage and theft (internal and external). The authors also warn that due to the fear that there are not enough products to meet the demand, the owners work with high inventories, thus generating a high risk of losses, as well as the disadvantage of these losses, generating a stalled capital, which means that the company will not have a profitable inventory turnover.
The main loss in the retail segment is the result of the difference between accounting and physical inventories, calculated at the time of physical inventory of goods ( COSTA, 2010). Thus, it is observed in the current literature that there are at least five types of losses: (a) Inventory losses/breakage; (b) Financial losses; (c) Administrative Losses; (d) Commercial losses; (e) Productivity Losses.
Costa (2010) further details the loss with breakdowns for five main reasons. (I) Internal theft, when it is theft caused by employees; (II) External theft, when it is theft caused by customers; (III) Operational Breakdowns, when they are the damages caused to the goods due to improper handling and packaging, as well as expiration dates; (IV) Administrative errors, when they are process failures that cause accounting inventory distortions; (V) Third party fraud, when it is the fraud committed by carriers and suppliers in the process of distribution and delivery of goods.
The author Lapa (2010), in turn, lists the ten main reasons for losses with breakages presenting even more details, as follows: (1) Goods with expired expiration date; (2) Decayed fruits and vegetables; (3) counters with cooling problems; (4) Products not separated by category; (5) Products stacked above the manufacturer's recommendation; (6) Inadequate product discharge (products thrown on the floor); (7) Heavier products stocked over more fragile ones; (8) Orders over ideal quantity (purchases); (9) Production of sliced above turnover; (10) Products stolen with traces such as tampered packaging (external and internal theft). The author still distinguishes in his book the expression ?loss? from the expression ?damaged?, since it considers the two distinct concepts, being detailed below:
The ?loss? creates a difference between the actual profit and the one that was planned for a given batch of goods. In addition, it also has negative effects on the company's internal controls, such as inventory position distortion, which may lead to orders originated based on wrong information. ?Damaged? are goods identified as unfit for consumption and sale that, although still present in stock, are no longer able to trade because they are damaged, deteriorated or expired. These goods are impaired in the same way as those that disappear from inventory, so they will also negatively affect profit margins. However, the most important is that in these cases they can and should be identified and measured ( LAPA, 2010).
As defined by Lapa (2010), losses and breaks are distinct terms. However, this study will consider the term ?loss? as the sum of the top ten reasons given by the author, as it is a more common term among managers working to prevent and minimize these problems.
Concerned about the direct implications that losses may have on the Brazilian retail market, since 2000, the Brazilian Association of Supermarkets ( ABRAS) conducts research in supermarkets in the country, in order to know the loss rates of companies, and the tools used to reduce them.
According to a study conducted by ABRAS (2017), in 2016, losses of Brazilian self-service totaled R$ 7.11 billion (in 2015, it presented R$ 6.19 billion). It was also disclosed in this research that in 2016, 40% of companies had no loss prevention area, an alarming fact, since in 2015, this percentage was 34% ( ABRAS, 2016). Thus, there is an increase in the percentage of losses in these companies when comparing the ABRAS research conducted in 2016 with the research conducted in 2015.
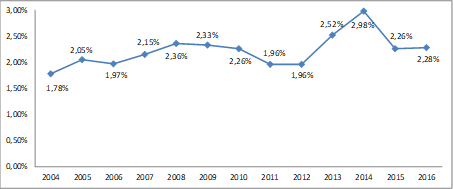
Figure 01 shows the evolution of the percentage of losses in studies carried out by ABRAS from 2004 to 2016. It is observed that the lowest percentage of losses was in 2004, and 2014 presented the highest index. It is still possible to see an increase from 2015 to 2016.
From the study conducted in 2016 with 339 companies across the country, is disclosed by ABRAS (2017), Table 01 and Table 02. The first presents the causes of losses in supermarkets; the second, the ranking of the reasons for losses in these companies. Table 01 shows that more than 60% of losses are derived from three causes: operational breakdown, theft and inventory errors. For Table 02, it can be seen that the three highest ranking losses represent more than 50%, (sweets, beverages and perfumery), being the first place (sweets), due to the high degree of implicit deteriorability of the product.
| Table 01 ? Causes of losses in supermarkets in 2016. Causes % Operational breakdown 29% External theft 18% Inventory Errors 15% Other adjustments 13% Administrative Errors 9% Internal Theft 8% Providers 8% Total 100% Source: ABRAS (2017). |
| Ranking | % |
| Sweets | 23% |
| Drinks | 18% |
| Perfumery | 12% |
| Meat | 11% |
| Deodorants | 9% |
| Shaving Razors & Blades | 7% |
| Batteries | 7% |
| Toys and Bazaar | 6% |
| Dairy Products | 5% |
| Cigarettes, smoke and lighter | 2% |
| Total | 100% |
For many retailers, retail loss prevention is not an uncommon issue and should be addressed and studied, as this action can generate significant gains for organizations, making it a strategic action ( Duarte, 2016). According to Silva & Pires (2016), to try to reduce losses, many supermarkets have created the loss prevention department. This department aims to supervise all processes, from receipt to consumption of the product by the customer.
Studies such as those by Lana et al. (2002), Fagundes & Yamanishi (2002), Silva et al. (2003), Rangel et al. (2003), Tofanelli et al. (2007), Pereira et al. (2008), Tofanelli et al. (2009) investigated losses in supermarkets in the states of DF, SP, MG and GO. In Rio Grande do Norte, there is the research by Arcoverde (2010), in which it was observed after analysis of three cities of the RN (Natal, Ceará-mirim and Parnamirim) that in the 16 supermarkets analyzed, none of the shopkeeper measured their losses, being their vulnerability to shoplifting is clear. The author also states that if the shopkeeper does not know which products disappear from stock, it is difficult to take corrective action.
Currently, there are numerous methods to perform the control and monitoring loss by damage in supermarket chains. One area of statistics that can be implemented quantitatively for such monitoring is Statistical Quality Control (SQC).
2.2 STATISTICAL QUALITY CONTROL
Statistical Quality Control is part of Industrial Statistics which includes mainly the areas of Statistical Sampling, Statistical Process Control (SPC), Design and Analysis of Experiments ( Woodall & Montgomery, 1999; Bersimis et al., 2018; Eckles et al., 2017). According to Montgomery (2016), SPC is a powerful collection of problem-solving tools, useful in achieving process stability and improving capacity by reducing variability.
Quality Control allows detecting changes in the behavior of the process in which it may be under the influence of special causes. Once the causes responsible for the unusual event (known as the special cause) are found, improvements in the process and product quality can be suggested, thus avoiding a high production of nonconforming items ( COSTA et al., 2005). The most common way to perform statistical quality monitoring to determine whether or not the process is under the influence of special causes is through quality control charts ( WEKERMA, 2006; LIU, HO, 2018; ZHOU et al., 2018).
2.2.1 QUALITY CONTROL CHARTS
Statistical Process Control uses, as one of its main tools, the analysis and interpretation of quality control charts. Control charts were introduced by Shewhart (1931), a physicist at Bell Telephone Laboratories, to control process variability over time; Shewhart is pointed out in the literature as the proponent of the statistical concept of the Control Chart (also known as the "control charts"). Costa et al. (2005) comment that with the emergence of Shewhart's control charts, the Statistical Quality Control was formally initiated.
Thus, according to Samohyl (2009), the choice of the control chart to be used in the SPC is based on the nature of the variable. If it is a quantitative variable, the control charts by variable are used; if it is a qualitative variable, the attribute control graphs are used. For more details on variable control charts, a methodology not used in this study, see Costa et al. (2005) and Montgomery (2016).
The Control Chart represents a quality characteristic measured or calculated from samples of size ?n? at intervals of duration ?m? ( Costa et al., 2005). The Shewhart Chart also serves as an aid in monitoring and controlling production, which implies process improvement. An example of Control Chart is presented in Figure 02:
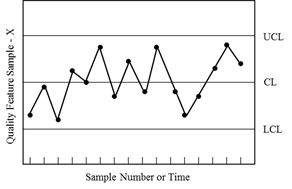
Montgomery (2016) presents the three Control Limits that are obtained from the amplitude (R), the process average (µ) and the process variability (?). These limits are represented by Equations (1), (2) and (3):


where UCL is the Upper Control Limit; CL is the Center Line (Expected value of the statistics used in monitoring); LCL is the Lower Control Limit; ?X? is a sample statistic that measures some feature of the quality of interest; ? ? and ? ? are respectively the average and standard deviation of X, and ?R? is the ?distance? from the Control Limits to the centerline, expressed in units of standard deviation. Usually R=3 is used to have 3? limits.
Costa et al. (2005) defines a process under statistical control when ?X? is recorded within the Upper and Lower Control Limits; otherwise, the process is considered out of statistical control. When it is detected that the process is out of control, an intervention is usually performed on it, stopping it to investigate and look for the cause of the lack of control (special causes or false alarm if the process was not out of control). Samohyl (2009) warns that a process out of control, there will be considerable production of items out of specification.
The specifications can be measured quantitatively and qualitatively, in the latter form, the control is performed through the attribute control graphs. Werkema (2006) comments that when it comes to analysis on these types of graphs, it is usual to monitor the process in two scenarios: (1) in case the piece is only classified as conforming or nonconforming; (2) Depending on the nature and complexity of the product, perform monitoring of the number of nonconformities (defects) per piece.
Techniques of statistical methods serve as warnings to indicate to managers that something is not going as expected ( Bastos et al., 2015). For the object of the study, which will be investigated the losses in supermarkets, it can be seen that a broken product will not be sellable, ie, this item will be considered a non-conforming product. Therefore, based on the nature of the study variable (conforming/nonconforming product), the use of the defective fraction control graph will be adopted.
2.2.1.1 DEFECTIVE FRACTION CONTROL CHART
The control chart of the defective fraction (chart p) is constructed from the binomial probability distribution. According to Montgomery (2016), suppose that the production process is operating in a stable manner (ie, it is in statistical control presenting a percentage of losses within the tolerable limit), such that the probability that a unit that is not according to the specifications is ?p?, and the successive units produced are independent.
Suppose also that each unit produced is an embodiment of a Bernoulli random variable with parameter ?p?. If a random sample of ?n? product units is selected, and if ?D? is the number of product units that are nonconforming, then ?D? has a binomial distribution with parameters ?n? and ?p?, that is, according to Equation (4):
When the nonconforming fraction of process (p) is not known, then it should be estimated from the observed data. Samohyl (2009) details that the usual procedure is to select m samples of fixed size (n) or variable ( o ), and calculate the value of p (here represented by to indicate that it is a sample size, not a non-population one). Thus, the nonconforming sample fraction is defined as the ratio of the number of nonconforming units in sample D to sample size n (or ni for a variable sample), as described in Equation (5):

The average of these non-conforming fractions of the individual samples is given by Equation (6) for the fixed sample size and by Equation (7) for the n variable ( MONTGOMERY, 2016):


Control limits for a variable size sample, according to Costa et al. (2005), are defined by equations (8), (9) and (10):
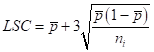

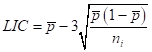
For a variable sample size, a limit will be calculated for each sample, so a total of m limits will be visible on the control chart. If the sample is fixed, the chart will present only one control limit (upper and lower) and consider ni = n ( SAMOHYL, 2009).
3. MATERIALS AND METHODS
The research is characterized by being quantitative and descriptive, since it focuses on describing the characteristics of a given phenomenon. Regarding the media, this work is classified as bibliographic and case study, since information was collected from materials published in books, conference annals, monographs, dissertations and scientific articles for the basis of the theoretical foundation and review.
The store chosen for this study was a supermarket chain, located in the capital of RN. According to SEBRAE (2013), because it has a staff of 620 employees, the supermarket chain is classified as large. The company was established in 2003 and operates in the storefront, merchandise replacement, FLV supply (fruit and vegetables), butcher, warehouse, bakery, security and administrative sectors. The chain composed by five supermarkets and two wholesale. The head office supermarket, the mart selected for this research, has 2,545 m2 of built area, ten normal flow cashiers and four fast flow cashiers and an opening hours from 6:30 am to 9 pm.
The management of the supermarket chain selected a team of collaborators to perform data collection. The collection of losses was performed every Monday of each week of the month, precisely because it is the day after the weekend, the period with the highest flow in the supermarket. Consequently, five data collections performed in May 2018 (days 07, 14, 21, 28 and 30) were defined. Thus, the team analyzed all supermarket sectors and accounted for the damaged items, the number of items displayed on the shelves for sale (damaged and in perfect condition), the location of the product (on which floor of the shelf it is), date of collection, the selling price, and the cost price of the item.
The statistical treatment of the data and the Boxplot graph was performed with the aid of R software ( R Core Team, 2016). The construction of the control chart p was developed by the Action software ( Estatcamp Team, 2014).
4. RESULTS AND DISCUSSION
4.1 Loss measurement
Table 03 shows information about data collection, such as the number of damaged or lost items. In this 3rd column, it is detected that the 4th day of collection presented the highest number of losses (2,175 items), as well as the highest cost to the company (R$ 11,389.88, in other words, 53.2% of all financial losses of the collection period). From this information on May 28th, the Boxplot of losses was constructed according to the week collected.
Thus, the respective graph is illustrated in Figure 03, which shows the presence of higher outliers (extreme values) each week, however, these are more extreme on May 28th. Thus, the database was analyzed, and noted that this high cost of losses was strongly due to the considerable number of damaged meat (beef and chicken). It is also possible to detect in Table 03, that the 3rd day of collection presented the lowest financial loss (R$ 1,402.68; ie, 6.6%). In addition, with the data recorded in these five moments, 4,405 damaged items were detected, generating a loss for the company of R$ 21,404.92; all this for May 2018 only.
| Week of the month | Date | Losses (items) | % | Costs | % |
| 1º semana | May 7th | 1008 | 22,9% | R$ 2.774,59 | 13,0% |
| 2º semana | May 14th | 120 | 2,7% | R$ 2.735,15 | 12,8% |
| 3º semana | May 21st | 208 | 4,7% | R$ 1.402,68 | 6,6% |
| 4º semana | May 28th | 2175 | 49,4% | R$ 11.389,88 | 53,2% |
| 4º semana | May 30th | 894 | 20,3% | R$ 3.102,62 | 14,5% |
| Total | 4405 | 100% | R$ 21.404,92 | 100% | |
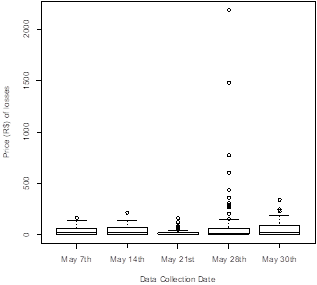
We sought to investigate in more detail the behavior of each collection day through Table 04. In this table, it is possible to analyze that the price of the damaged items ranged from R $ 0.39 to R$ 2,186.98 (this high price is due to the loss of a large amount of beef). The day with the lowest variability was the first, as it presented a coefficient of variation (CV) of 109.02%; However, if analyzed only by the standard deviation, the 3rd day showed less variability. In addition to the use of the standard deviation, the Coefficient of Variation was adopted, as it is a measure of variability given as a percentage, in which the lower its percentage, the lower the variability (CV = 0% indicates no variability) and the higher its percentage, the greater the variability.
The difference between standard deviation and coefficient of variation in Table 04 is because the mean is altered due to the presence of higher outliers (shown in Figure 03), so the average values are overestimated. Therefore, as the units of measurement are equal, one can compare the variability by both the standard deviation and the coefficient of variation, thus concluding that the days 07th of May and 21st of May showed the lowest variability. Accordingly, 28th of May, the highest, due to the high loss in the meat sector, already reported in Table 03.
), so the average values are overestimated. Therefore, as the units of measurement are equal, one can compare the variability by both the standard deviation and the coefficient of variation, thus concluding that the days 07th of May and 21st of May showed the lowest variability. Accordingly, 28th of May, the highest, due to the high loss in the meat sector, already reported in Table 03.
Still according to Table 04, it can be seen that the reason for the average ( ) being above the median in all collected days, is due to the presence of the upper extreme values, in addition, the median for being robust to outliers, separates the distribution of prices in two equal parts. The fact that it is so below average only corroborates the existence of extreme values that were visually found in Figure 03.
| Statistic | 07/05 | 14/05 | 21/05 | 28/05 | 30/05 |
| Sample | 1.008 | 120 | 208 | 2.175 | 894 |
| Minimum | R$ 0,75 | R$ 0,39 | R$ 0,62 | R$ 0,47 | R$ 1,42 |
| 1st quartile | R$ 3,54 | R$ 3,34 | R$ 3,15 | R$ 4,05 | R$ 7,02 |
| Median | R$ 22,85 | R$ 18,96 | R$ 6,76 | R$ 16,20 | R$ 18,52 |
| Average | R$ 37,49 | R$ 37,99 | R$ 19,21 | R$ 92,60 | R$ 56,41 |
| 3rd quartile | R$ 60,40 | R$ 69,00 | R$ 20,57 | R$ 92,60 | R$ 91,10 |
| Maximum | R$ 164,00 | R$ 213,60 | R$ 160,80 | R$ 2.186,98 | R$ 340,200 |
| Standard deviation | R$ 40,88 | R$ 44,17 | R$ 28,67 | R$ 259,80 | R$ 78,85 |
| Coefficient of variation | 109,02% | 116,28% | 149,19% | 280,56% | 139,78% |
Table 05 presents the most relevant results for the theme of this work. In it, it is possible to verify the losses by department of the supermarket chain. In addition, the departments were ranked as the highest financial loss to the lowest, so a department with more damaged items, but with lower cost, will be considered less critical (such as the grocery sector, which presents more items than the egg department; however, it is in a lower position as it has a lower financial loss).
It is also possible to observe in Table 05, that the two departments with the greatest financial loss are perishable products with short expiration date: the meat department (with the largest loss, R$ 6,921.63) and the dairy department. Similar result to Costa (2010). In addition to the two departments, there are non-alcoholic beverages, eggs and grocery items. These five departments add up to a loss of R$ 17,742.34 (82.9% of the total cost of the supermarket).
| Departament | Losses (items) | Cost | % | % Accumulated | R$ Accumulated |
| Meat | 952 | R$ 6.921,63 | 32,3% | 32,3% | R$ 6.921,63 |
| Dairy Products and Derivatives | 1030 | R$ 2.905,13 | 13,6% | 45,9% | R$ 9.826,76 |
| Drinks | 744 | R$ 2.799,52 | 13,1% | 59,0% | R$ 12.626,28 |
| Eggs | 347 | R$ 2.741,45 | 12,8% | 71,8% | R$ 15.367,73 |
| Grocery store | 1238 | R$ 2.374,61 | 11,1% | 82,9% | R$ 17.742,34 |
| Snacks | 114 | R$ 787,21 | 3,7% | 86,6% | R$ 18.529,55 |
| Alcoholic beverages | 283 | R$ 742,02 | 3,5% | 90,0% | R$ 19.271,57 |
| Inlaid | 78 | R$ 613,12 | 2,9% | 92,9% | R$ 19.884,69 |
| The bakery | 75 | R$ 398,94 | 1,9% | 94,8% | R$ 20.283,63 |
| Cleaning | 215 | R$ 385,46 | 1,8% | 96,6% | R$ 20.669,09 |
| Sweets | 52 | R$ 228,73 | 1,1% | 97,6% | R$ 20.897,82 |
| Bazaar | 17 | R$ 198,59 | 0,9% | 98,6% | R$ 21.096,41 |
| Disposable | 65 | R$ 181,93 | 0,8% | 99,4% | R$ 21.278,34 |
| Cold / Frozen | 195 | R$ 126,57 | 0,6% | 100,0% | R$ 21.404,91 |
| Total | 5405 | R$ 21.404,91 | 100% | - | - |
Although Table 05 has 13 departments, a methodology of analysis similar to the 80-20 rule was chosen, which would be to work with a smaller number of departments, as long as they are responsible for at least 80% of the total cost. Therefore, a goal was set to present in more detail the five highest ranking departments, which portray 82.9% of the loss caused by damaged products. For this purpose, Tables 06, 07, 08 and 09 were prepared, which present more details of the five positions with the highest ranking of financial losses.
Table 06 shows the damaged items from the department with the greatest loss to the supermarket. It is possible to observe that beef and chicken are the main responsible. Both costing R$ 6,434.77 (93% of the cost of this department). It is important to note that beef and chicken, besides presenting the highest cost, also presented an increase in the number of damaged items.
| Meat | Losses (items) | Cost | % | % Accumulated | R$ Accumulated |
| Bovine | 521 | R$ 4.702,83 | 67,9% | 67,9% | R$ 4.702,83 |
| Chicken | 370 | R$ 1.731,94 | 25,0% | 93,0% | R$ 6.434,77 |
| Pig | 50 | R$ 373,00 | 5,4% | 98,4% | R$ 6.807,77 |
| Mixed meat | 8 | R$ 59,25 | 0,9% | 99,2% | R$ 6.867,02 |
| Fish | 3 | R$ 54,61 | 0,8% | 100,0% | R$ 6.921,63 |
| Total | 952 | R$ 6.921,63 | 100% | - | - |
Starting from the second highest ranking department, it can be inferred from Table 07 that cheese, pasteurized milk, condensed milk and margarine are responsible for 83.9% of the costs, totaling a loss of R$ 2,436.60. It is also observed that milk cream had a larger number of damaged items than margarine. However, it was decided in this paper to rank the priorities in terms of cost rather than number of damaged items.
| Dairy Products and Derivatives | Losses (items) | Cost | % | % Accumulated | R$ Accumulated |
| Cheese | 242 | R$ 1.020,30 | 35,1% | 35,1% | R$ 1.020,30 |
| Pasteurized milk | 314 | R$ 746,42 | 25,7% | 60,8% | R$ 1.766,72 |
| Condensed milk | 162 | R$ 371,52 | 12,8% | 73,6% | R$ 2.138,24 |
| Margarine | 55 | R$ 298,36 | 10,3% | 83,9% | R$ 2.436,60 |
| Milk cream | 135 | R$ 216,27 | 7,4% | 91,3% | R$ 2.652,87 |
| Powdered milk | 50 | R$ 129,50 | 4,5% | 95,8% | R$ 2.782,37 |
| Coconut milk | 36 | R$ 66,60 | 2,3% | 98,1% | R$ 2.848,97 |
| Yogurt | 36 | R$ 56,16 | 1,9% | 100,0% | R$ 2.905,13 |
| Total | 1030 | R$ 2.905,13 | 100% | - | - |
Looking more closely at the beverage department, it can be seen that the industrialized juice sector and soft drinks are the department's most critical damaged items, as both represent 86.54% of the costs incurred. It is also possible to inform that the packages of the industrialized juices vary from 200 ml to 1 liter; However, the 1 liter juices were mainly responsible for the losses, since they totaled a loss of R$ 1,227.41 (out of a total of R$ 1,445.94).
Besides industrialized juices, it was observed in the database that the soft drink containers ranged from 220 ml to 3 liters, however, the ones with the highest damage rate were the drinks with the largest storage, being the 2 liter soft drink with cost of R$ 371.90, the 1.5 liters with a cost of R$ 325.04. In third and fourth place were the 350 ml cans (cost of R$ 140.52) and the 1 liter soda (cost of R$ 111.36), respectively.
| Drinks | Losses (items) | Cost | % | % Accumulated | R$ Accumulated |
| Industrialized Juice | 336 | R$ 1.445,94 | 51,65% | 51,65% | R$ 1.445,94 |
| Soda | 366 | R$ 1.060,83 | 37,89% | 89,54% | R$ 2.506,77 |
| Energetic | 34 | R$ 261,88 | 9,35% | 98,90% | R$ 2.768,65 |
| Tea | 6 | R$ 28,50 | 1,02% | 99,92% | R$ 2.797,15 |
| Coconut water | 1 | R$ 1,90 | 0,07% | 99,98% | R$ 2.799,05 |
| Mineral water | 1 | R$ 0,47 | 0,02% | 100% | R$ 2.799,52 |
| Total | 744 | R$ 2.799,52 | 100% | - | - |
Table 05 shows that selling egg trays presented the 4th highest cost to the supermarket chain. After analysis of the database, it was observed that the losses were from trays with 6, 15 and 30 eggs. However, from the loss of R$ 2,741.45 in this department, trays with 30 eggs accounted for R$ 2,613.3 (95.3%) of this value. Starting at 5th place in the ranking, Table 09 shows that three items account for 81% of the grocery department costs. Sugar (62.5%), cooking oil (15.2%) and rice (13.3%). These items totaled a loss of R$ 1,923.23 for the supermarket.
| Grocery store | Losses (items) | Cost | % | % Accumulated | R$ Accumulated |
| Sugar | 755 | R$ 1.245,55 | 52,5% | 52,5% | R$ 1.245,55 |
| Kitchen oil | 120 | R$ 361,80 | 15,2% | 67,7% | R$ 1.607,35 |
| Rice | 172 | R$ 315,88 | 13,3% | 81,0% | R$ 1.923,23 |
| Coffee | 60 | R$ 204,00 | 8,6% | 89,6% | R$ 2.127,23 |
| Bean | 38 | R$ 140,23 | 5,9% | 95,5% | R$ 2.267,46 |
| Salt | 60 | R$ 36,00 | 1,5% | 97,0% | R$ 2.303,46 |
| Cassava flour | 12 | R$ 30,90 | 1,3% | 98,3% | R$ 2.334,36 |
| Cinnamon | 12 | R$ 18,48 | 0,8% | 99,1% | R$ 2.352,84 |
| Precooked corn flour | 6 | R$ 4,25 | 0,2% | 99,3% | R$ 2.357,09 |
| Others | 3 | R$ 17,52 | 0,7% | 100% | R$ 2.374,61 |
| Total | 1238 | R$ 2.374,61 | 100% | - | - |
4.2 Statistical control of nonconforming loss fraction
Montgomery (2016) comments that to apply the Statistical Quality Control, the data must follow a normal distribution. Therefore, the Shapiro-Wilk test (test that verifies whether the data are normally distributed) was performed and a p-value of 0.844785 was found. Thus, as the test was not significant, it does not reject the null hypothesis that the data come from a normal distribution. Thus, statistical quality control is possible.
The data collected allow us to calculate the percentage of non-conforming items, that is, items that were for some reason broken and unable to sell. The percentage ( ) was calculated from Equation (5), where Di is the number of units of each of the damaged products and ni is the number of items of each of the products that were on the supermarket shelf for sale. Finally, i represents the number of distinct products.
For example, assuming that the shelf contains 30 egg trays, each with 20 units, and on this shelf, it was observed that there are 6 broken trays. Thus, as we are portraying only one distinct product, i=1, and also, Di = 6; ni = 30; therefore, = 6/30 = 0.20. Therefore, it is stated that for this item, there is a proportion of 20% loss fraction.
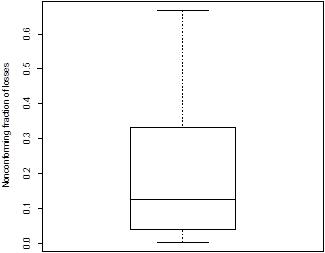
Figure 04 and Table 10 illustrate all values of the loss fraction of the supermarket. It is possible to observe that there was a very high variability (CV = 94%), that is, there are items with a low percentage of losses, as well as items with a high percentage. There is also an alarming data that the proportion of losses reached 66.67%. It can also be said that half of the damaged items showed losses between 0.42% to 14.29% and the other half, between 14.29% to 66.67%. On average, there was a fraction of losses of 21%. Although the average is far from the median, there is no presence of outliers in the data, as can be seen in Figure 04.
| Minimum | 1st quartile | Median | Average | 3st quartile | Maximum | Standard deviation | Coefficient of variation |
| 0, 0042 | 0,0417 | 0,1429 | 0,2100 | 0,3333 | 0,6667 | 0,1474 | 94% |
The quality control of the damaged items was performed through the chart p, to verify if the proportion of losses was under statistical control. The control limits represented by the color red are shown in Figure 05. It can be observed that the process is out of control, as there are points (circled in blue) out of bounds. Thus, one can observe the high number of blue circles, which represent observations whose proportion of loss was above the control limits. The chart has variable limits and width 3?. The limits were calculated based on Equations (8), (9) and (10). The nonconforming fraction ( ) was calculated according to Equation (7). Due to the large number of special causes, it is impracticable to investigate each one as the process is out of control.
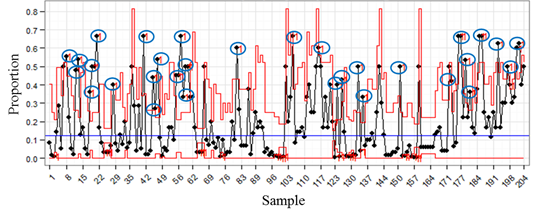
As illustrated in Figure 05, there are numerous out of control points, ie special causes present in the process. Due to the limitation of the data provided by the company, it is not possible to diagnose these special causes, since the data presented only the losses, but these damages were not classified. Thus, based on the recommendation of Costa et al. (2005), because there is more than one special cause out of control without the possibility of diagnosing it, it was decided to interrupt the monitoring process, in order to perform a more detailed analysis with a data accounting depicting the classification of losses, and only then, it is possible to perform a new quality control.
4.3 Analysis of possible causes of losses
From the results presented in Section 4.1 and 4.2, a visit was made to the supermarket chain to investigate possible causes of the main losses of the five most critical departments (presented in Table 05). Thus, it was found that, in the supermarket, there is only one walking inspector to circulate in all aisles to inhibit the population from damaging or theft (external theft), as well, this employee is solely responsible for preventing internal theft, through other employees and suppliers.
While visiting the security sector, it was noted that only one employee is responsible for monitoring on approximately 40 cameras distributed throughout the supermarket. Based on this contact, management was requested to analyze the vision perception of the cameras of the most critical sectors ( Table 11) depicted in Tables 06 to 09.
It is noticeable that blind or covert spots from the layout are at the same time bad for selling products, as well as conducive to loss by theft or breakage. Thus, it can be seen from Table 11 that in the corridors with the sale of trays of beef, cheese, juice, soda and margarine, the cameras present images. However, because they are so far away, they are not clear. Accordingly, you can see a customer buying, but you can't accurately distinguish their movements (if the customer lowers, the field of vision is more impaired). Looking at the egg, cooking oil and rice trays, the camera presents a clear view, however, of only half the shelf where the product is exposed. For cooking oil is more alarming, since the blind part is precisely in the types of oil with higher added value.
| Departament | Item | Security camera view |
| Dairy Products and Derivatives | Condensed milk | According |
| Meat | Beef | Distant camera not displaying sharp images |
| Dairy Products and Derivatives | Cheese | Distant camera not displaying sharp images |
| Drinks | Industrialized Juice | Distant camera not displaying sharp images |
| Soda | Distant camera not displaying sharp images | |
| Meat | Chicken | As in some points, unclear images in other points |
| Eggs | Egg tray | Partially blind |
| Grocery store | Kitchen oil | Partially blind |
| Rice | Partially blind | |
| Dairy Products and Derivatives | Margarine | Totally blind |
| Pasteurized milk | Totally blind | |
| Grocery store | Sugar | Totally blind |
In addition to the situations explained, it was shown in Table 11 that pasteurized milk and sugar do not have a field of view in the cameras. This way, when the only walking inspector is not passing through these corridors, if a theft or damage to the products is performed by a customer or employee, it will not be noticed by the cameras. Only chicken meat and condensed milk presented clear and consistent fields of vision for the employee to observe through the cameras. All these results indicate as possible causes of the high loss rate in these items.
5. FINAL CONSIDERATIONS
This article analyzed the losses in a large supermarket chain, seeking to diagnose the most costly damages to the products, being automatically classified as the most critical. From this selection, we sought to detail the items responsible for at least 80% of the costs of the five departments with the highest losses.
In response to the research problem, it was possible to make the following suggestions to minimize recurring losses of damaged products: (1) store the most critical products on higher shelves; thus making it difficult for children who often consume products hidden from their guardians in the supermarket; (2) increase the number of corridor inspectors and the number of employees monitoring security cameras (currently there is only one employee in each sector); This suggested measure could considerably reduce the possibilities pointed out by Lapa (2010): internal/external theft, products not separated by category, collaborator stacking items above the manufacturer's recommendation, etc. (3) immediately reposition of the security cameras to reduce blind spots; (4) reallocate lower value-added products at the camera's poor vision monitoring points; (5) In case of persistence of blind spots, it is recommended to purchase and install more cameras; (6) emphasize walking inspector to increased traffic in areas with blind spots.
Based on these recommendations and the analyzed data, unfortunately it was not possible to perform the Statistical Quality Control, however, it is believed that at a later time, with a new data collection, a new attempt of statistical monitoring can be performed in the which the non-compliant fraction is expected to decrease considerably, consequently, with a significant reduction in the loss and damage of the company.
This study presented, as a study limitation, the fact that the database provided by the company does not presents the classification of losses, that is, only the damaged items were informed, but the reason for the loss was not externalized (for example: Operational breakdown, External Theft, Internal Theft, Inventory Errors, Administrative Errors, Supplier, etc). Thus, because there was no information on the diagnosis of loss, quality control had to be interrupted. Naturally, the recommendations and suggestions were limited only to the information available, therefore, it is believed that, in possession of this unaccounted data, the study would present more complete results and with greater contributions, both academic and for the supermarket studied, since, besides quality control, could be studied the main reasons for losses and set goals for their reduction.
For future work, it is recommended to carry out inspection capacity studies, as well as obtaining a new data collection; however, with the description of the type of loss and inclusion of the fruit and vegetables sector. Besides the possibility of the continuity of the study in other supermarkets of the chain, since the work was applied only in the head office.
Referencias
ABRAS. 16ª Avaliação de Perdas no Varejo Brasileiro de Supermercados, 2016. Acesso em: . Acesso em 10 de maio de 2018.
ABRAS. 17ª Avaliação de Perdas no Varejo Brasileiro de Supermercados, 2017. Disponível em: . Acesso em 10 de maio de 2018.
ARCOVERDE, C.F.A. Modelo de classificação para pequenas empresas supermercadistas quanto ao uso de técnicas de prevenção de perdas: Um estudo de caso. Dissertação em Engenharia de Produão: Universidade Federal do Rio Grande do Norte, p. 172, 2010.
ABRAS. Associação Brasileira de Supermercados. 2018, Disponível em: . Acesso em 10 de maio de 2018.
BASTOS, E. V. P., GUIMARÃES, J. C. F., & SEVERO, E. A. Modelo de regressão linear para análise de investimentos em uma empresa do ramo petrolífero. Revista Produção e Desenvolvimento, v.1, n.1, p.77-88, 2015. https://doi.org/10.32358/rpd.2015.v1.62
BERSIMIS, S., SGORA, A., PSARAKIS, S. The application of multivariate statistical process monitoring in non-industrial processes. Quality Technology & Quantitative Management, v.15, n.4, p.526-549, 2018.
CAMPOS-VÁZQUEZ, R. M., & MEDINA-CORTINA, E. M. Pass-through and competition: the impact of soft drink taxes as seen through Mexican supermarkets. Latin American Economic Review, v.28, n.1, p.3, 2019.
COSTA, A. F. B., EPPRECHT, E. K.; CARPINETTI, L. C. R. Controle Estatístico de Qualidade. 2. ed. Editora Atlas: São Paulo, 2005.
COSTA, A.A. Prevenção de perdas: Analisar o gerenciamento da prevenção de perdas em organizações supermercadistas de varejo no DF. Monografia (Graduação em Administração) ? UnB. Brasília, p. 63, 2010.
DUARTE, G.B. Proposta de melhorias para minimizar as perdas no setor de hortifrúti em uma rede de supermercados. Monografia (Graduação em Ciências Contábeis) - UNESC. Criciúma, p. 55,2016.
ECKLES, D., KARRER, B., UGANDER, J. Design and analysis of experiments in networks: Reducing bias from interference. Journal of Causal Inference, v.5, n.1, 2017.
EQUIPE ESTATCAMP. Software Action. Estatcamp - Consultoria em estatística e qualidade, São Carlos - SP, Brasil. Disponível em: . Acesso em 10 de maio de 2018.
FAGUNDES, G.R.; YAMANISHI, O.K. Estudo da comercialização do mamão em Brasília-DF. Revista Brasileira de Fruticultura, v. 24, n. 1, p. 91-95, 2002.
LANA, M.M.; MOITA, A.W.; NASCIMENTO, E.F.; SOUZA, G.S.; MELO, M.F. Identificação das causas de perdas pós-colheita de cenoura no varejo, Brasília-DF. Horticultura Brasileira, v. 20, n. 2, p. 241-245, 2002.
LAPA, J. C. Ganhar mais perdendo menos. Brasília: Senac, 2010.
LIU, Y. C., HO, C. H. A comparison of car following behaviors: Effectiveness of applying statistical quality control charts to design in-vehicle forward collision warning systems. Transportation research part F: traffic psychology and behaviour, v.53, p.143-154, 2018.
MONTGOMERY, D.C. Introdução ao controle estatístico da qualidade. 7. ed. Rio de Janeiro: LTC, 2016.
OHNO, T. O Sistema Toyota de Produção: Além da Produção em Larga Escala. Porta Alegre: Bookman, 1997.
PEREIRA, L.V.; ABRAHÃO, E.; ANDRADEM J.C.; FRÁGUAS, J.C.; ALVARENGA, A.A. Análise do mercado de frutas em Lavras-MG. Ciência e Agrotecnologia, v. 32, n. 6, p. 1981-1984, 2008.
R CORE TEAM. R: A language and environment for statistical computing. R Foundation for Statistical Computing, Vienna, Austria. 2016. Disponível em: . Acesso em 07 de abril de 2018.
RANGEL, S.B.; FAGUNDES, G.R.; FALCÃO, T.C.C.; MENDES, R.S.; YAMANISHI, O.K. Perfil do mercado varejista e consumidor de mamão dos grupos 'solo' e 'formosa' do Distrito Federal -DF. Revista Brasileira de Fruticultura, v. 25, n. 1, p. 85-88, 2003.
REN, C. R., HU, Y., & CUI, T. H. Responses to rival exit: Product variety, market expansion, and preexisting market structure. Strategic Management Journal, v.40, n.2, p.253-276, 2019.
SAMOHYL, R.W. Controle estatístico da qualidade. Rio de Janeiro: Elsevier, 2009.
SANTOS, A.L.B. As perdas no setor supermercadista: um estudo de caso no hortifruti do supermercado primavera. Monografia (Graduação em Administração) ? UniCEUB. Brasília, p. 44, 2006.
SEBRAE. Anuário do trabalho na micro e pequena empresa. 6.ed. Brasília, DF. DIEESE: 2013.
SEIDEL, E.P. Redução das perdas em hortifrutigranjeiros, a partir do gerenciamento de processos em supermercados. Dissertação (Dissertação em Engenharia de Produção) ? UFSC. Florianópolis, p.76, 2001.
SHEWHART, W.A. Economic Control of Quality of Manufactures Product. Princeton: Van Nostrand, Reinhold Company Inc., 1931.
SILVA, C.S.; PEROSA, J.M.V.; RUA, P.S.; ABREU, C.L.M.; PANTANO, S.C.; VIEIRA, C.R.Y.; BRIZOLA, R.M.O. Avaliação econômica das perdas de banana no mercado varejista: um estudo de caso. Revista Brasileira de Fruticultura, Jaboticabal , v. 25, n. 2, p. 229-234, 2003.
SILVA, M.F.; PIRES, C.O. Avaliação das perdas no setor de FLV de um atacarejo na cidade de São Paulo. South American Development Society Journal, v.2, n.4, 2016.
SOUZA, D.F.; SEGANTIN, J.A.; ALVES, A.J.S.; ANDO, R.T.R.; SILVA, L.B.I. Controle de perdas de estoque em uma rede de supermercados. Revista Conbrad. Maringá, v.1, n.1, 71-96, 2016.
SVANES, E., & JOHNSEN, F. M. Environmental life cycle assessment of production, processing, distribution and consumption of apples, sweet cherries and plums from conventional agriculture in Norway. Journal of Cleaner Production, v.238, p.117773, 2019.
TOFANELLI, M.B.D.; FERNANDES, M.S.; CARRIJO, N.S.; MARTINS FILHO, O.B. Levantamento de perdas em hortaliças frescas na rede varejista de Mineiros. Horticultura Brasileira, v. 27, n. 1, p. 116-120, 2009.
TOFANELLI, M.B.D.; FERNANDES, M.S.; MARTINS FILHO, O.B.; CARRIJO, N.S. Perdas de frutas frescas no comércio varejista de Mineiros-GO: um estudo de caso. Revista Brasileira de Fruticultura, v. 29, n. 3, p.513-517, 2007.
WERKEMA, M.C.C. Ferramentas estatísticas básicas para o gerenciamento de processos. Belo Horizonte: Fundação Christiano Ottoni, 2006.
WOODALL, W.H.; MONTGOMERY, D.C. Research Issues and Ideas in Statistical Process Control Algorithm. Journal of Quality Technology, v31, n.2, 1999.
ZANATTA, J.M.; NUSKE, M.A.; HALBERSTADT, I.A. Strategic planning for a micro enterprise: case study in a supermarket in Rio Grande do Sul. Research, Society and Development, v. 9, n. 2, 2020.
ZHOU, R., PANG, E., & LI, G. Quality control charts used in the determination of 9 kinds of heavy metal elements in foods by inductively coupled plasma mass spectrometry. Journal of Food Safety and Quality, v.9, n.19, p.5242-5246, 2018.
Additional information
All authors stated that they had: a) actively participated in the discussion of the article results; and b) Review and approval of the final version of the paper.