Abstract:
Abstract Purpose Studying the gap between improvements in operational performance of a manufacturing organization does not necessarily represent the existent of safe and healthy work. The purpose of this paper is to fill this gap validating a scale about social practices. Design/methodology/approach The literature was studied; data analysis instrument and the scale validated by Q-sort. The reliability and validity of research instrument indicators were drawing from the analysis of judges. The data were assessed by convergence matrix. Findings It was validated five social practices factors. It was enabled the adequacy of the name of the constructs and establishment which indicators better convergence to the constructs. Research limitations/implications The judge´s number that answered the research was low. The level of convergence related of two factors was above 50 percent. Practical implications It is possible to achieve better levels of performance through social practices. Organizations must rethink the management and the routine of the workers to implement the operational practices. Social implications The practices need to have with well-defined rules, as well as action to drive compliance. This vision also needs to be expanded to suppliers, customers and society. Originality/value Highlight five points: technology is the main factor for analyzes and decisions; the search for quality leads organizations to seek practices that improve workers’ well-being, health and safety; the activities of the worker are carried out on the factory, or in the work environment; Should not to belittle the local community; culture is an essential factor to continuous improvement.
Keywords: · Sustainability · Scale development · Social practice · Health and safety at work · Q-sort .
Article
Operations social practices in safety and health at work: Scale validation and reliability through the Q-sort method
Universidade de São Paulo
In conducting studies on the implantation of best operational practices, it was noted that the main of these works is primarily related to the pursuit of increased production volume and the complexity of operational controls. Thus, it is noted that there is a direct analogy with the analysis of the index of labor risks arising from these new environments of work, or, simply, organizations fail to associate the culture created for improving the products and processes with the adopted social practices (Brown, 1996; Power et al., 2015).
In this perspective, there is still a perception by many managers that social practices have a restrictive impact on operational performance, that is, the implementation of occupational health and safety systems may reflect negatively on levels of productivity (Gimenez et al., 2012; Sobhani et al., 2015).
Romeiro Filho (2015) has investigated tools that support the application of design to sustainable principles, adapted to small and medium companies. He identified risk factors in workers’ activities, among them, complaints of pain and even diseases from work.
It is possible to verify that the number of work-related accidents in Brazil with permanent sequels or with temporary departures, did not show a significant reduction during its historical series. It is maintaining, on a yearly basis, an average number of approximately, 700 thousand people injured at a cost of R$ 17 billion per year (Brasil. Ministério do Trabalho e Emprego, 2012).
However, there is a positive approach, when organizational culture favors consistent and formalized procedures, the simultaneous development of innovation, safety and environment occurs, since the results of the investments in these areas was directly related to the role of manager and local culture (Shafiq et al., 2014).
In this way, an organization can utilize both operations and security improvements in an integrated management system, whose variables are indirectly related to the routine and the simultaneous integration of operations management and safety and health at work (Pagell et al., 2015). It is also possible to improve performance on social responsibility and profit not only in the organization but also along the supply chain (Hsueh, 2015).
The management approach in safety and health at work as a social practice seeks to expose the organizations responsibility importance in a broad social context, and not only as records of hours of leave or internal costs. The social view of the work accident also needs to take into account the care and treatment of the injured, the image of the organization, as well as the fall in service level and productivity (Shafiq et al., 2014).
Faced with this initial argument, this study seeks to validate the reliability of a research instrument. This method comprises the opportunity to apply a scale in contexts different from the original location in which it was prepared. It also seeks to identify the social practices in operations that focus on safety and health at work.
In addition, it is evident that the replication of scales in Brazilian environments requires more than the simple translation of the original language, i.e., it is necessary to adapt cultural values (Su and Sampaio, 2013). In this sense, the Q-sort tool can aid in the adequacy and promotion of the insertion of national authors in the international academic environment (Paiva and Brito, 2013).
In view of this problem, the following question emerges through the questionnaire sorting, what are the constructs that allow the measurement of the level of implementation of social practices inherent in management occupational safety and health at work?
In order to answer this question and therefore to validate this scale and to measure the reliability of the indicators of the research instrument, the judge Q-sort procedure was adopted and the technique of data analysis, in a qualitative way (Perreault and Leigh, 1989; Moore and Benbasat, 1991; Nahm et al., 2002).
In this panorama, the present paper was delimited for the validation of constructs that allow the discussion about social practices in relation to the management of safety and health at work.
In order to support the empirical study, this study show the concepts related at social practices, the survey criteria and respective questions applied to the research method regarding the scale validity and reliability.
Social practices refer to activities related to products or processes that affect human safety and well-being, as well as community development and protection of the damage coming from supply chain or operational functions (Klassen and Vereecke, 2012).
In the literature on the subject, research on social practices was share into two streams: one about the clash between social and operational practices, which put them as contradictory, and another that affirms that they are complementary.
In this sense, research suggests that the search for the effectiveness of operational indicators, without considering the increased risk of accidents, stress and occupational diseases of workers, puts operational and safety improvement as contradictory (Pagell et al., 2014).
Many operational practices increase manufacturing complexity; show disconnected elements of production, and consequently increased risk of unforeseen accidents (Pagell et al., 2015).
Practices such as reduced workloads between operations improve operational performance, but reduce worker well-being (Shah and Ward, 2003), as indirectly create worker overloads, reducing their time to complete tasks and that he feels pressured.
When research indicates that operational effectiveness, health and safety at work are complementary themes, the performance of these constructs are analyze separately. In this environment, the work is focus on the quality of the products and services offered to consumers and customers and cannot offer an analysis of worker safety perspective (Pagell et al., 2015).
In this context, many companies have had many difficulties in defining and implementing social actions without mentioning their competitive benefits (Klassen and Vereecke, 2012). One of the reasons that lead to this view is related, initially, to the increase in the total cost of the system through the systematic evaluation and investments needed to reduce risk factors at work (Sobhani et al., 2015).
For Pagell et al. (2015), the tension between the management of social practices and operational practices can be reduced when both are managed, concomitantly, by means of an integrated management and security system named joint management system (JMS), whose objective is to integration from a workers’ point of view. JMS is a set of routines that jointly allow planning, measurement, monitoring and continuous improvement in safety and performance. This system enables stability by reducing the tension between being safe and effective.
To implement this system, it is important to qualify people both to achieve harmonized improvements in operations productivity as well as occupational safety and health. According to the level of qualification and maturity of the organizational culture, workers of the same organization may have different perceptions about occupational hazards in the work environment (Oliveira and Veiga, 2013). Thus, the ability to perceive risks is also directly linked to the level of education that each individual presents to identify hazards and recognize the risks in their work environment. This level is directly related to the constant and continuous actions of education and training that have a positive effect both on the performance of operational indicators and on the understanding and compliance with safety and health at work procedures (Longoni et al., 2014). Thus, the ability to perceive risks is also directly linked to the individual level education to identify hazards and recognize the risks in their work environment. It is directly related to the constant and continuous education and training programs that have both operational performance indicators and positive effect compliance at safety and health at work procedures (Longoni et al., 2014).
According to Wheelwright and Hayes (1985), Organizations present better performance indices when all employees have full understanding of their purpose, mission, strategy and company routines. Utilize consist patterns of organizational processes or actions or resources to achieve the expected results (Peng et al., 2008). Thus, the greater gap in the individuals’ interpretation of the organization routine reflects direct in the greater operation performance variation. On the other hand, when both operational and safety routines are interpreted and improved equally, stability will be achieved. For this, it is necessary that the organization adopt a preventive and communicative character, that is, that information and knowledge transmitted to workers, highlighting the objective of improving safety and productivity, thus enhancing human capital (Pagell et al., 2015).
When one group incorporated operational practices in work environment, they generate effects in others (Shafiq et al., 2014). In this way, the valorization of the groups that incorporated the culture of safety and health with the issues of productivity strengthens the development of an integrated organizational culture. In this sense, the joint performance of the operational area and social practices in the work environment is directly related to the manager’s role in ensuring investments in safety, health and the environment. They promoting focused actions for the creation, maintenance and consolidation of the local culture of simultaneous integration of operations management and health and safety at work (Power et al., 2015).
The research work on a scale consists in using rules of symbol assignments for objects that seek to represent, numerically, quantities of attributes (Netemeyer et al., 2003). In this sense, for the development of a scale, one looks for: simplification in the rules to measure it; an empirical application; little additional effort by the respondent; and without dependence on a manager. Generally, the main authors list criteria for systematizing the work script.
According to Nahm et al. (2002), Q-sort is a method to evaluate the reliability and validity of constructs through a questionnaire of items, which would be prepared for a survey of data. In addition, contributions on this methodology are presented for the scale development, such as:
1. Unidimensionality: when it refers to the homogeneity of items. A measure is considered one-dimensional when it has statistical properties, demonstrating that its items underlie a single construct. The Q-sort methodology seeks to show, through the convergence matrix, the unidimensionality of the items for the construct. In this way, the organization in rows and columns represents a number of correct answers to the respective factors. It is evident that issues related to dimensionality should be paramount for assessing the reliability and validity of the scale.
2. Reliability: for the literature, psychometric measures are related to two factors. The first one refers to the temporal stability index, registering the deviation of the same person’s answers, at different moments, by the same respondent; and the second is related to internal consistency. By the convergence matrix, it is possible to visualize the number of responses that are being linked to another factor, or even those that are not representative for the context.
3. Validity: Pasquali (2007) shows the main topics related to the scale validity:
o Construct validity: refers to the quality of the measurement that a scale intends to use to measure a construct. In this sense, face or content validity is present, which reflects the translation quality, the convergent, discriminant and nomological validity. All these indexes seek to establish validity for the construct. The authors should, a priori, highlight the theoretical dimension and show evidence of reliability for validity.
o Content Validity: it is related to the capacity and relevance of the measurement items in reflecting a theoretical scope. The context items should be consistent and representative. To ensure content validity, for each construct, the items number or indicators must be at least three.
o Face validity: the authors define that the face validity intensity is relate to the empirical evidence presented by the instrument. Thus, the ease of reading the instructions and filling in the answers shows that the proposed document does not appear to be valid only, but applicable for respondents. In addition, face validity is concerned with the inferences that the respondents present regarding what is being measure.
o Convergent validity: shows how two measures designed to measure the same factor are related. Convergence is found if the two measures of the same construct are highly correlated. Discriminant validity assesses the degree which two indicators designed to measure similar but conceptually different constructs are related.
o Nomological validity: it shows how the scale relates to theory, research hypotheses and previous research.
In short, unidimensionality and reliability are necessary, but they are insufficient conditions for the validity of the construct. It should be noted that Q-sort is a qualitative analysis tool, therefore, by the nature of the research, it is depends to the respondents interpretation. It should be pointed out that the judges did not know each other and are from different regions in the country, so it can be said that there was no attempt to interfere in the answers, but rather the search for consensus (Nahm et al., 2002).
It is worth remembering that, to understand the terms unidimensionality, validity and reliability, we have the analysis of three factors about the quantitative research instrument: the search for the correct measure, the verification of the sample error and the verification of the non-sampling error (Freitas et al., 2000). It is expected that, while the sample error is directly related to the sample size and to the selection process, the non-sampling error is related to the research process, such as the non-return index and biased responses. In this sense, while reliability is directly related to sample error, validity depends both on the understanding of sample errors as well as non-sample errors (Malhotra and Grover, 1998).
Therefore, in order to mitigate or reduce the parcels of errors effects, the research instrument was developed under the unidimensionality and validity criteria. That is, it was verified whether the indicators would be able to measure the constructs, as well as reliability, to assess the degree of consistency of scales used for replication in future studies (Hair et al., 2009).
This step was divided into the following topics: describe how was the data collection method, expose the procedures performed to contact the respondents; expose judge´s qualifications, presenting the area of activity and time of experience of each one; exhibit the convergence percentage, which indicates the convergent validity and the reliability of the data; and, finally, data analysis.
The data collection from primary sources, whether by e-mail, questionnaire or otherwise, should support greater benefits than the perceived “costs”, which implies ease of completion and less possible delay in order to increase the return index, as Dillman (1991) points out. According to the author, as benefits, it should be emphasized that the questionnaire should be interesting in itself and offer guarantees, such as information on who is responsible for the collection and destination of the data.
Thus, when a return index considered suitable to answer the questions of the present research was obtained, the questionnaires were sent to judges with experience in the area of Operations, and their geographic distribution is directed to four Brazilian states. Initially, the research instruments were sent to three judges, who fully answered the evaluation. The period between sending and receiving first round responses was from June 29 to July 13, 2015.
After constructs re-evaluation, the instrument was sent to five other judges. The second round took place from October 20 to November 15, 2015. It should be noted that all invited judges have a doctorate or master’s degree in the areas of administration or production engineering, and having been contacted by e-mails and using Microsoft Word software.
In the first round, 25 items corresponding to the five constructs were discussed. Each construct should have at least three valid items, but two indicators were added per construct in order to increase its reliability. The items were placed randomly in the text so that there was no tendency of the judges.
In the second round, 32 items corresponding to the five constructs were discussed. Also, new items were added, according to the need, besides an evaluation and adequacy of the constructs with low convergence. Items with low convergence have been removed or changed, and new items that address the theory have been added.
In addition, it was explained how much time would be needed to complete the convergence assessment instrument. Regarding the return period, the researcher in order to determine the validity of the sample and to verify the number of no responders (see Appendix 1) established this. An example of how the instrument should be completed is presented (see Appendix 2).
Judge 1 is a Master and PhD in administration, in production and information Systems concentration area, with 30 years’ experience in the academic area. Judge 2 has a Master’s and PhD in administration at FEA-USP and economics from UEL, working in the teaching area for 13 years. In the professional area, he has been working with strategy and operations consulting for 19 years, having opened his own consulting firm in strategic planning projects. Judge 3 has a PhD in administration (UNISUL) and a Master’s degree in production engineering (UFSM) and has 15 years of academic experience. In addition, he has 23 years of professional experience, coordinated activities that promote safety, health and well-being at work, and is a member of the Internal Commission for the Prevention of Accidents. These three judges participated only in the first survey. Judge 4 has a Master’s and PhD in Production Engineering from EESC-USP, 7 years of experience in the academic area and 15 years in the profession. Judge 5 has a Master’s Degree in Computer Science, in the area of Artificial Intelligence applied to Production Management, and a Master’s Degree in Production Engineering, with 9 years of academic experience and 20 years of profession. Judge 6 is a Doctor and Master in Transport Engineering, with 27 years of experience in the academic field. Judge 7 has a PhD in administration (FGV/EAESP) and a Master’s in administration (UFU/FAGEN), with 8 years of experience and research in the area of sustainability. Judge 8 has a Master’s degree in business administration and a PhD in production engineering, having 8 years of experience as a teacher and 15 years of professional experience.
The methodology for calculating convergence percent was reported by Perreault and Leigh (1989) and is based on the number of items pointed out by the judges that coincide with those in the theory. It can be inferred that this method allows the demonstration of a convergent validity for the presented constructs. This methodology is also used as a tool to evaluate the research instrument reliability, since it demonstrates the consistency of the indicators for the constructs representation (Perreault and Leigh, 1989; Moore and Benbasat, 1991; Nahm et al., 2002).
Therefore, this research differs from the method adopted by Su and Sampaio (2013) and Souza et al. (2014), who evaluated the indicators through quantitative analysis of structural equations (Redaelli et al., 2014).
In this case, e-mails were sent to the judges to consider the indicators to be applied in assessing factors (or latent variables).
The research instrument initially addresses the basic concepts related to the constructs and bibliographic sources, but without identifying the respective indicators (see Appendices). This methodology describes that the items should be randomly arranged so that the judges fulfill the identification of the indicator that represents the construct, without bias.
Subsequently, each judge, independently, performed the indicators appointment vs constructs. When the evaluation instrument return, the consistent items were grouped in the target factors, as well as the inconsistent ones, were recognized. It was also determined the convergence index – the indicator ability to relate to the construct – which is referenced with a percentage.
For Moore and Benbasat (1991) and Perreault and Leigh (1989), this procedure is classified as qualitative and therefore is not constituted from the standards establishment to determine what is good or bad. However, Perreault and Leigh (1989) argue that the procedure for evaluating constructs vs indicators and determining the percentage of convergence are strongly influenced by the number of categories. Thus, in the next topic, will show answers’ judges convergence matrix vs the theory.
The convergence matrix is proposed by Moore and Benbasat (1991), and is constituted as follows: the column on the left refers to the target factors, while, on the horizontal line, the items evaluated by the judges and to identify the constructs. There is also the column that indicates the sum of the judgments by latent variables and, finally, the percentage of convergence, by construct.
In this scenario, the number of judges notes on the constructs forms the matrix essentially, whereas, on the main diagonal, the indicators’ sum show concordance between the judges and the theory represented.
Meanwhile, the values outside the main diagonal expose the notes that were discordant among the judges, as well as the assessment of the nature of the disagreement (Perreault and Leigh, 1989). The identification of indicators with indices of convergence below 50 percent gives the researcher the option of eliminating these indicators (Hair et al., 2009). This exclusion is called as scaling improvement.
There is also a quantitative evaluation by calculating the total convergence index denominated as Kappa (Cohen, 1960; Landis and Koch, 1977). It establishes the following scale for validity of the research instrument: indexes with values between 0.76 and 1.00 categorize the method as excellent; the moderate convergence is classified for indices obtained between 0.40 and 0.75, while values lower than 0.39 consider the research procedure to be poor.
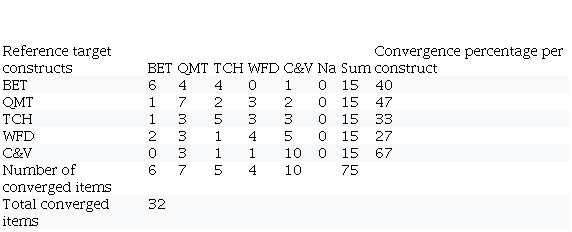
Data analysis was performed through the convergence matrix of responses on operation social practices. For didactic purposes, the constructs with the following codes were identified, as shown in Table I: business environment; quality movement; technological changes; workforce development; and, finally, culture and values. Each author should relate each of the items, presented at random, to one of the presented constructs. The “Not Applicable” column exposes the indicators pointed out by judges who do not refer to any constructs. The line represents the constructors studied in the theory and their respective items and, in the column, the constructs pointed out by the authors are represented by means of the choice of each item. The “Sum” column refers to the number of notes in which a particular indicator received notes, and finally, the “convergence percentage per construct” column exposes the number of correct responses per construct.
According to data from Table I, the criterion “Culture and Values” stands out positively, which presented a convergence index of 67 percent, while, negatively, the “labor development” factor, which had only 27 percent of consonance. In general, Table I shows that, of the 75 records, it was found that only 32 votes were correctly placed, or 43 percent of the total. According to the literature, this index is lower than expected (50 percent). Thus, a second analysis will be presented in the next topic.
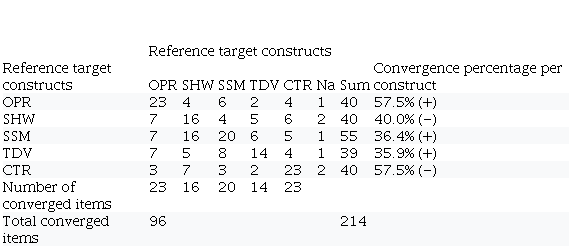
For the second analysis of the convergence matrix, the following modifications were made: first, the constructs with a convergence index of less than 50 percent were removed, namely: “Business Environment,” “Quality Movement,” and “Technological Changes.” In this sense, the evaluation sought a better theory understanding vs indicators, and the following constructs were inserted: “Operational Practices,” “Safe and Healthy Work Environment,” and “Safety System.”
Regarding the construct “Culture and Values,” after reviewing the literature, it was decided to use only the term “Culture.” The change is supported by Wu et al. (2010), which assert that the construct “Culture” is found in three levels of the organization through artifacts, values and assumptions. The authors confirm that only the artifacts represent the phenomenon considered as visible to all, therefore, these authors interpreted that the addition of “values” would be placed in a prolix way.
It is concluded that practices related to the constructs “Operational Practices,” “Safe and Healthy Environment of Work” and “Culture” should be maintained, without exclusion or addition of any of them. It is reported that in the construct “Safety System,” 11 practices or items were added. Thus, as there were five judges, this construct presented 55 new answers.
The construct “Workforce Development” presented two excluded indicators, due to the result with low convergence of the same. To this end, three practices were added that seek to better represent the construct.
For didactic purposes, the constructs with the following codes were identified, as can be observed in Table II: operational practices; safe and healthy work environment; safety system; team development; and, finally culture. The Not Applicable column exposes the indicators pointed out by judges who do not refer to any construct (Nahm et al., 2002). The negative (−) and positive (+) signs in the last column indicate whether the convergence index of the construct has improved or worsened after the second analysis.
According to the data in Table II, it is evident that, for the constructs of the second analysis, an improvement occurred in three of them. Regarding the construct “Culture,” despite the reduction of the final grade, it remained above 50 percent (cut grade). In general, Table II presents 214 records, and it can be verified that 96 votes were correctly placed, that is, 45 percent of the total.
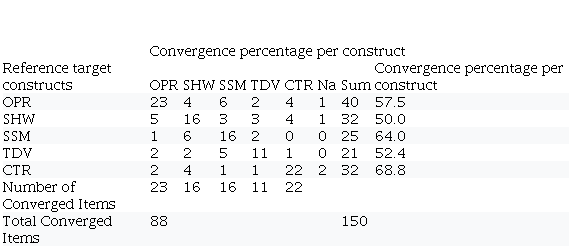
As a final step, the scale was purified with the removal of low adhesion indicators (see Table AI).
In this sense, Table III is presented, with the refined data. It is important to note that, in this table, the classification by the judges was not done, but only the data purification, that is, the items withdrawal with a convergence of less than 50 percent. Thus, each judge participated in only one round.
As shown in Table III, all the constructs had an average index greater than 50 percent (88 divided by 150 equal to 58 percent). According to the Kappa Index, the research instrument presents a moderate convergence (Cohen, 1960; Landis and Koch, 1977).
This topic addresses the theoretical model and the relationships among variables through the assumptions of the theory about sustainability, health and safety at work, and the following steps were performed.
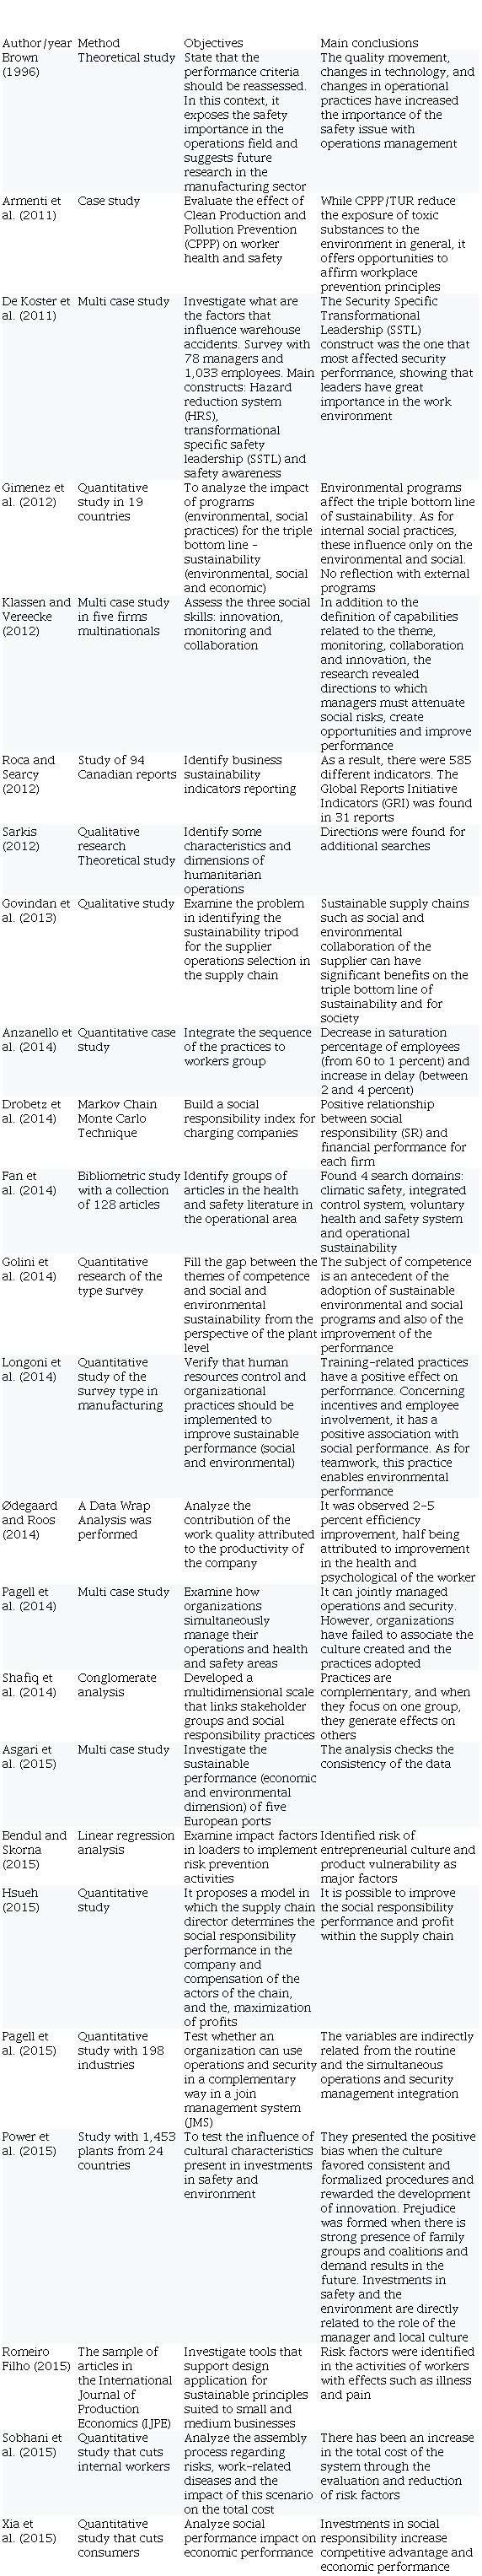
First, for the theoretical model, a bibliographical review of the seminal text (Flynn et al., 1995) was made, and from this the work published in periodicals of the manufacturing, production and operations classified as Qualis A1 and A2, during the period from 2010 to 2015, these being summarized in Table IV. It is justified the use of this time interval as relevant for the bibliographic research due to the impact factor of the material published on the topic (Amin and Mabe, 2003).
It is noteworthy that, as suggested by Su and Sampaio (2013), the instrument of data collection of the work of Pagell et al. (2015), from English to Portuguese, by the authors of the research. Subsequently, the evaluation was carried out by two specialist professors in the area of operations and production, as well as by the application of a pre-test to two managers of companies that carry out activities in the area of safety, health and environment (Cooper and Schindler, 2011).
Then, following these tasks, the construction of the theoretical model with the main constructs, that is, the social practices as a second-order construct, was made up of five factors of the first order: operational practices, safe and healthy work environment; safety system, development of the work team and, finally, culture.
The graphical representation allows visualizing that the arrows are unidirectional and having as origin the construct “social practices” and as destination each factor of firstst order. On the conceptual side, it is emphasized that the measurement of social practices is at a higher level of evaluation, since it is reflected in first-order constructs (Peng et al., 2008). It is evident that, in the context of a seconnd-order factor model, first-order factors are defined as dependent variables, since the responses of latent variables of the first order form the perceptions about second-order variables (Byrne, 2010; Koufteros et al., 2009). In the meantime, it should be pointed out that for the definition of each construct, its alignment with the theoretical foundations listed in Table IV was performed and as indicated in the data collection instrument presented in Appendix 2.
Byrne (2010) and Koufteros et al. (2009) point out that the most important is the calculation of the convergent validity of the first-order constructs for the second-order constructs. In this sense, the constructs illustrated in Figure 1, as well as the number of indicators per construct, are conceptualized (see Table AI). It should be noted that the number of indicators by constructs sought to make quantitative research feasible, as well as to guarantee the validity and reliability of the data collection instrument (Cooper and Schindler, 2011).
· Operational Practices: they refer to all activities that promote greater stability within organizations and are linked to the reduction of operational uncertainties in the search for process standardization, increase of equipment reliability and, consequently, reduction of failures and failures (Flynn et al., 1995; Pagell et al., 2015). Of the five indicators, only one item had a convergence index of less than 50 percent.
· Safe and healthy work environment: this is related to the increase of awareness about the importance of worker’s health quality and its relation with the operational results, using tools that consider worker safety and health in organizational changes. In this sense, the quest for greater quality has effects on worker safety and well-being (Brown, 1996). Of the four indicators, two presented an index of less than 50 percent, thus requiring a re-evaluation.
· Safety system: it is understood from the conformity of the workers’ behavior with the procedures, goals and safety rules that are established, monitored and reviewed by the company (Shafiq et al., 2014). Of the five items, three have a convergence index close to 50 percent. However, the simple arithmetic mean value is greater than 50 percent.
· Development of the work team: seeks to highlight investments in training, selection and retention of employees and is related to the following aspects: employees’ ability to solve problems; coordination of work, intra and inter-departmental departments; development of decision-making capacity in unforeseen or emergency situations; and compliance with the health and safety system (Flynn et al., 1995). At the end of the research, three indicators with final arithmetic mean greater than 50 percent were presented.
· Culture: it is the incorporation and sharing of assumptions, values and processes (visible and invisible) related to safety and health at work at each organizational level (Pagell et al., 2014, 2015; Wu et al., 2010). This is the construct with the highest convergence index.
The present paper presented a discussion about a scale of social practices for the manufacturing sector with emphasis on occupational health and safety. The following aspects stand out: the original of the study and the discussion of the constructs and indicators for a wide evaluation. Therefore, the main indicators that reflect the social practices related to the area of safety, health and well-being of the worker in the manufacturing sector were presented, besides proposing a model with a variable of second order.
In addition, a review of the literature was carried out in the period 2010-2015, from which it is possible to highlight the importance of the triple bottom line of sustainability as a view of organizations for decision making in general.
In a second moment, through the evaluation of the main constructs related to social practices, data collection, sample selection and evaluation were started through the convergence matrix, highlighting the five points: technology is the main factor for analyzes and decisions related to social practices, since, insofar as this can be used directly in the daily activities of the worker, it can also cause problems, such as sedentarism and repetitive strain injuries, as well as how it can contribute to the possibility of new work accidents; in addition, the search for quality leads organizations to seek practices that improve workers’ well-being, health and safety from a series of tools that solve problems related to occupational accidents and diseases; at the same time, the evaluation of the operational practices shows how the activities of the worker are carried out on the factory, or in the work environment. In this sense, the importance of the recognition of the processes and products with high reliability, with low possibility of equipment breakdown and that provide reduction in the operational uncertainties stands out; should not to belittle the local community, which one influence by its stakeholders and also the regulatory issues, which have a significant impact on the level of safety performance; still, it is important to mention that culture is an essential factor in managers’ decision to invest continuously in safety, healthy and sustainable practices, and it was observed that, among the constructs evaluated, it was the one that presented the highest convergence index among the judges interviewed.
Regarding the convergence indexes of the criteria inherent to each construct, it was observed that the main criterion of convergence of the judges refers to the existence of instructions of work on safety and health that the workers must respect, followed by the investment to the perception of the culture of safety and health at work. This means that occupational safety and health practices need to have with well-defined rules, as well as action to drive compliance. This vision also needs to be expanded to suppliers, customers and society so that these stakeholders also take into account best practices in occupational safety and health as a relevant factor in generating a prevention culture.
In short, it is possible to achieve better levels of organizational performance and, for this, organizations must rethink the management and the routine of the workers to implement the operational practices, promoting the sustainability in the three senses: financial, environmental and social.
As a limitation of the study, three constructs, “Safe and Healthy Work Environment”, “Safety System” and “Work Team Development”, have shown only two indicators with a convergence above 50 percent. As a new phase of the study, we will carry out the application of the questionnaire in order to verify how these constructs are developed and understood within the business environment. Its future application in the survey needs to take into account the form of data collection, the standardization of the data and the sample. The relationship between the variables analyzed and the researcher’s role in the definition of the method is also emphasized and, in the survey, it is not possible to exercise any control over the variables, whether dependent or independent. In this sense, the researcher must recognize the mechanisms of validity and reliability, as these are essential for the success of the application of the method of data collection. As a proposal for new studies, the quantitative evaluation, through the modeling of structural equations, can offer greater contributions to understanding the actions of a scale item.
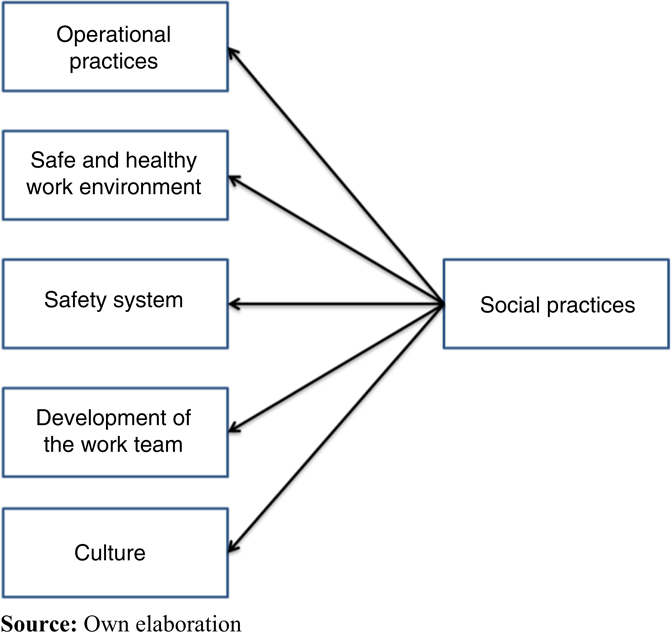
Figure 1
Theoretical model
Own elaboration
Convergence matrix on practices and competences
Own elaboration
Matrix convergence of second analysis
Own elaboration
Convergence matrix of 2nd analysis with constructs above 40 percent
Own elaboration
Research about social practices
Own elaboration
Scale purification
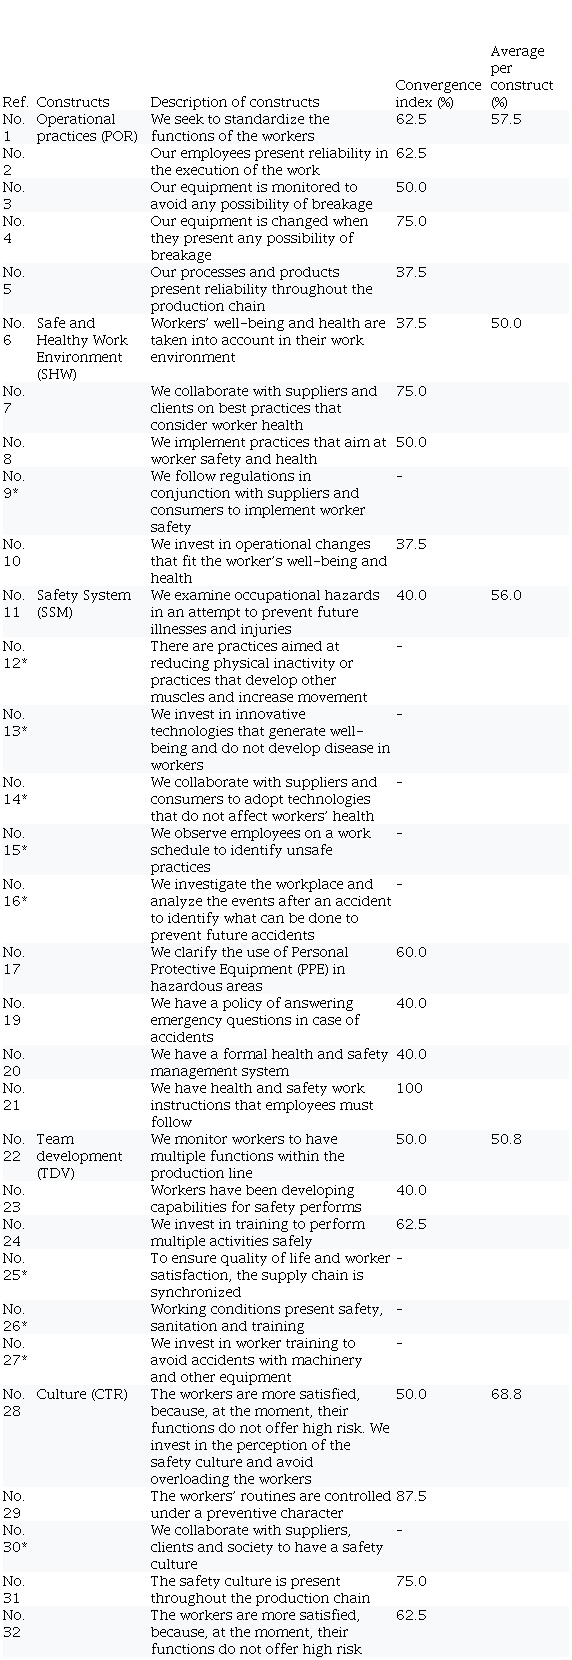
Notes: Second convergence matrix analysis – description of the constructs, indicators, index of convergence by indicator and mean of convergence by construct. Items highlighted with the (*) were removed after purification, because they presented low convergence in the Q-sort test. In this sense, for the calculation of the mean, the values obtained were not used
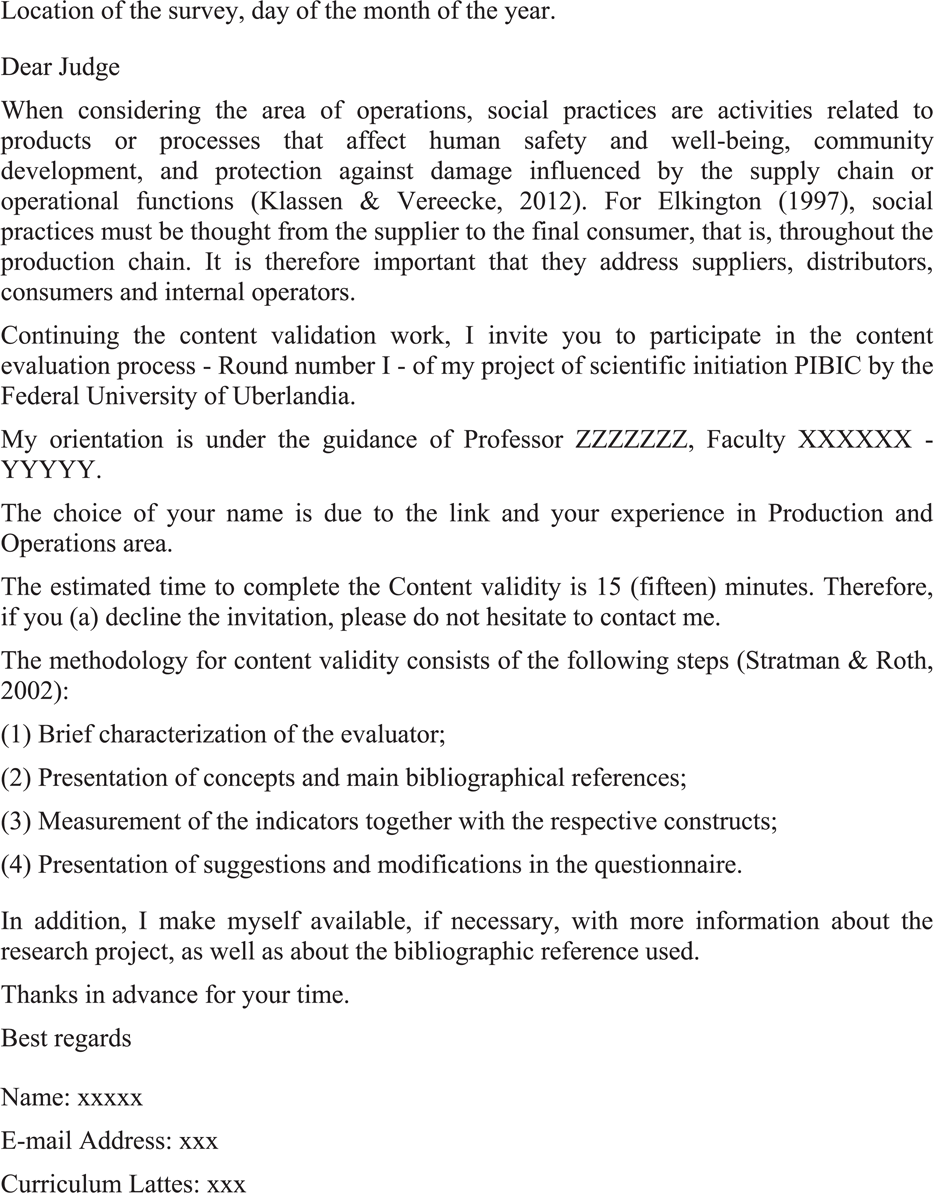
Appendix 1.
Specialist contact protocol
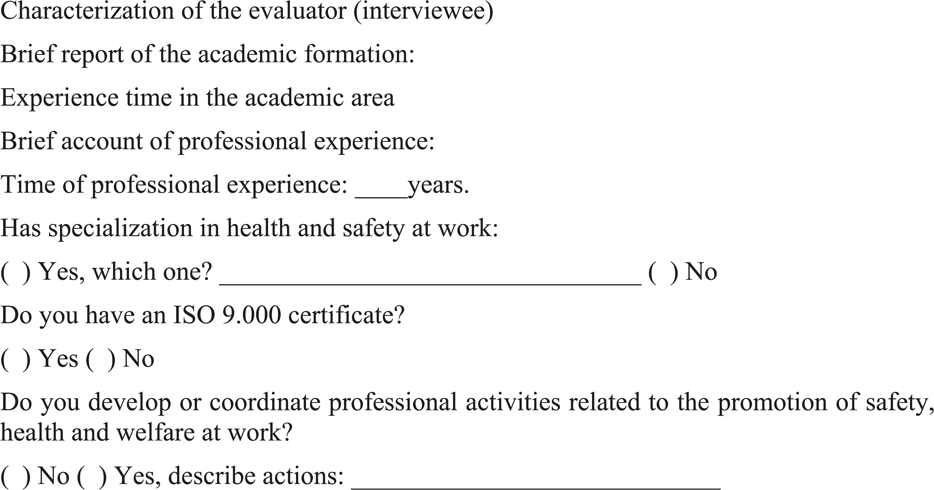
Appendix 2.
Data collection instrument
In this stage, the indicators used to measure the constructs about social practices will be evaluated. In that sense, First, you, as evaluator, should relate each indicator to a specific construct. It is worth noting that the questions are being presented at random.
The following is the list of constructs:
· No. 1: operational practices (OPR) – refers to all activities that promote greater stability within organizations and are linked to the reduction of operational uncertainties in order to standardize processes, increase equipment reliability and, consequently, reduce failures and failures. Source: Flynn et al. (1995); Pagell et al. (2015).
· No. 2: safe and healthy work environment (SHW) – it is related to increased awareness about the importance of worker's health quality and its relation to operational results. It presents tools that insure worker safety and health in organizational changes. The quest for greater quality has effects on worker safety and well-being. Source: Brown (1996).
· No. 3: safety System (SSM) – workers' behavior must be in accordance with the procedures, goals and safety rules that are established, monitored and reviewed by the company. Source: Shafiq et al. (2014); Hayes et al. (1998).
· No 4: team development (TDV) – involves investments in training, development, selection and retention of employees. It is related to the following aspects: employees' ability to solve problems, coordination of work in and between departments, development of decision-making capacity in unforeseen situations and compliance with the health and safety system. Source: Flynn et al. (1995).
· No. 5: culture (CTR) – it is the incorporation and sharing of assumptions, values and processes (visible and invisible) related to safety and health at work at each organizational level. Source: Pagell et al. (2014); Pagell et al. (2015); Wu et al. (2010).
· No. 6: none of the above-mentioned constructs.
Table AI
Figure 1
Theoretical model
Own elaboration
Convergence matrix on practices and competences
Own elaboration
Matrix convergence of second analysis
Own elaboration
Convergence matrix of 2nd analysis with constructs above 40 percent
Own elaboration
Research about social practices
Own elaboration
Scale purification
Notes: Second convergence matrix analysis – description of the constructs, indicators, index of convergence by indicator and mean of convergence by construct. Items highlighted with the (*) were removed after purification, because they presented low convergence in the Q-sort test. In this sense, for the calculation of the mean, the values obtained were not used
Appendix 1.
Specialist contact protocol
Appendix 2.
Data collection instrument