
Secciones
Referencias
Resumen
Servicios
Descargas
HTML
ePub
PDF
Buscar
Fuente

Value and growth stocks and shareholder value creation in Brazil
Revista de Gestão, vol.. 26, no. 3, 2019
Universidade de São Paulo
Abstract:
Abstract
Purpose
Investors label high (low) book-to-market (B/M) firms as value (growth) companies. The conventional wisdom supports that growth stocks grow faster than the value ones, creating greater shareholder value. The Purpose of this paper is to analyze how stocks of growth and value companies create value for their shareholders in Brazil, compared to the USA market. For this, the authors analyze three dimensions of return.
Design/methodology/approach
First, the authors perform portfolios to analyze the growth rates of shareholders’ return. Then, the authors perform regressions to study the explanatory power of the B/M in growth. The data come from Thomson Reuters Eikon database and the Brazilian Institute of Geography and Statistics. The authors select all non-financial firms with available data from 1997 to 2017.
Findings
The profitability of growth firms is higher than the value ones, in almost every year after the portfolios’ formation, with little variation. Contrary to the findings for the US market, growth companies in Brazil show higher dividend growth than value companies.
Research limitations/implications
It is possible that the database does not contain complete and entirely reliable accounting data, which may partially affect the results.
Practical implications
The findings contradict those exposed in the USA. The implications are the inverse of the US study: the duration-based explanation could be a vital factor for the value premium in the Brazilian stock market. Also, the findings support the standard valuation techniques and help the growth rates estimation in the valuation process (top-down approach).
Originality/value
This study is the first to compare the profitability and dividend growth of growth/value stocks in the Brazilian market. Overall, growth stocks have considerable profitability, and dividend growth compared to value stocks.
Keywords: Value creation · Profitability · Dividend · Growth-value stocks · Valuation.
1. Introduction
Investment managers and equity analysts label high (low) book-to-market (B/M) firms as value (growth) companies. A substantially different growth is expected between those two types of stocks since the equity valuation models establish that the firm’s value comes from its ability to generate cash flows (CF) (Sloan & You, 2015). Since these CF are expected in the long run, much of this value comes from the future film’s investment opportunities (Tobin, 1969). Also, because these firms are often at distinct organizational life cycle stages (Miller & Friesen, 1984) and the shareholder value creation is determinate by the firm’s profitability and growth (Varaiya, Kerin, & Weeks, 1987), there is a conventional wisdom that value and growth stocks have substantial differences in value creation for investors.
Based on the efficient market hypothesis (EMH), growth stocks are less risky than value stocks, due to the expected growth of companies (Santos & Montezano, 2011; Sloan & You, 2015; Chen, 2017). Given the above, in this study, we test the hypothesis that the growth stocks create greater value to shareholders (Varaiya et al., 1987) because they grow at a high rate than the value ones (Sloan & You, 2015; Chen, 2017). Hence, we analyze the relationship between B/M ratio, a standard measure of firm fundamental characteristics (with the profitability), changes in profitability and dividends growth rate in the Brazilian stock market.
For this purpose, we consider that greater shareholders value creation (whether of growth or value stocks) is represented by higher growth rates of return on equity (ROE) and dividends (or, simply, by higher “growth rate”). Also, we take the following steps: we investigate if B/M is a predictor of the levels of profitability; we investigate if B/M is a predictor of the annual changes in profitability; and if B/M is a predictor of the annual dividend per share growth rate. For this analysis, we use two correlation techniques, two types of portfolios’ formation analysis and two univariate regressions to attest the robustness, besides some multivariate regressions with several control variables.
Our findings are a contribution to the study of the firms’ growth dynamics and the valuation process in Brazil. These findings are original in their way of exploration in this market and contribute to filling the existing gap in this literature. First, in a practical perspective, this type of analysis is appealing for financial analysts and financial advisors to build dividends or quality portfolios’ investment styles (e.g. they will have answers to questions about the comparability of growth and value stocks profitability and real dividend growth). Second, in a theoretical point of view, our analysis also represents an alternative test of the duration-based explanation for the value premium, since according to Chen (2017), several studies indicate that assets with higher duration are associated with lower returns. These studies show essential explanations for the value effect (Croce, Lettau, & Ludvigson, 2007; Lettau & Wachter, 2011). Also, we present an important advance on Chen (2017) in discussing the effect of growth on value and growth stocks in an emerging market, under the context of shareholder value creation.
According to Lettau and Wachter (2011), the term structure of equity is downward sloping. In other words, the long-duration assets earn lower expected returns. In their model, analogous to long-term bonds, growth firms are high-duration assets while value firms are low-duration assets. Companies with CF weighted more to the future, endogenously have high price ratios, while firms with CF weighted next to the present have low price ratios. A logical implication is that the growth stocks show lower expected returns due to their long equity duration and that the value stocks show high expected returns. Theoretically, this relationship could explain the value premium, or, from an empirical perspective, it could explain some heterogeneity of those kinds of firms.
Therefore, testing whether growth and value stocks have significant differences in the duration of their CF contributes to exposing evidence for this relationship in the Brazilian market. We have two reasons to conduct our study in the Brazilian stock market. First, such type of study is conventional in developed countries, especially in the USA, but it is still scarce in emerging markets, especially in Brazil. The Brazilian stock market has approximately 10 percent of its number of stocks traded in the US stock market, besides being a more volatile market and with less protection to shareholders (La Porta, Lopez-De-Silanes, Shleifer, & Vishny, 1997). For this reason, identifying firms as growth or value is a more difficult but essential task.
Second, if the duration-based explanation is a valid argument for the growth and value stocks divergence, a study conducted in Brazil will bring empirical evidence for this market, since there are mixed results related to the stock returns of growth and value firms. There is evidence of an inverted value premium: growth stocks/portfolios had high returns in the years 1990, 1991 and 1997 (Mescolin, Braga, & Costa, 1997), in 2001 and 2002 (Pedreira, 2005), in 1999, 2000, 2002, 2003, 2006 and 2007 (Saito, Savoia, & Sousa, 2014) and in the period between 1995 and 2008 (Cordeiro & Machado, 2013).
Our findings can be summarized as follows. The overall average of ROE of growth firms is significantly higher than that reported by value firms in almost every year after the portfolios’ formation. The annual difference in ROE is not significant in the equally weighted portfolios, showing that the profitability of each firm shows little variation in the years after the portfolios’ formation. Overall, contrary to the findings in the US market exposed by Chen (2017), growth companies show a massive dividend growth when compared to value companies in Brazil.
We conjecture a possible explanation. First, during the majority of the analyzed period (2000–2016), the biggest firms in Brazil could get relatively cheap financing by subsidized funding lines (Kayo, 2018), express a considerable growth in their profitability and, consequently, the possibility to make more significant dividends payout. Second, this phenomenon can reflect the mandatory distribution of dividends in Brazil, in addition to the high risk of this market, which makes the shareholder prefer the CF today (dividends) to keep it in the company. On the other hand, in the US market dividends are not mandatory and the risk is lower (greater protection for shareholders) (La Porta et al., 1997).
Our findings have the following practical applications. First, in the domestic market, growth companies are expected to experience higher dividend growth and a higher return on shareholders’ equity, confirming the viability of valuation models based on multiples and dividend discount. In this case, how investors are looking to form a portfolio with dividend growth potential, in the long run, could invest in large growth stocks. However, it is crucial to observe the potential degree of overvaluation to avoid misallocation behaviors.
Also, the conventional wisdom holds that: compared to value stocks, the growth stocks have substantially higher future cash-flow growth rates and, consequently, longer cash-flow duration. Second, according to Chen (2017), in the US stock market, the growth stocks do not have substantially higher cash-flow growth rates, and in some scenarios, the value stocks CF appear to grow faster. His findings suggest that the duration-based explanation is unlikely to resolve the value premium in the USA. However, in the Brazilian stock market, growth companies show higher dividend growth and high profitability. These findings point to future research about value premium, including the effects of accounting and behavioral aspects.
2. Book-to-market ratio and shareholder value creation
The B/M ratio is one of the oldest measures in the equity financial analysis and is generally used to differentiate between growth and value stocks (Graham & Dodd, 1934). According to Santos and Montezano (2011), for example, value stocks are usually defined as those traded at low price-to-book ratio (or market-to-book (M/B) ratio) and growth stocks, on the other hand, are traded at high price-to-book ratio (or M/B ratio). Although these authors used an inverted index (M/B) to what we use in this study (B/M), the conclusion is maintained by inverting the index and its understanding. Thus, when a firm shows a high B/M compared to the rest of the firms in the market, we have a value company. When the opposite happens, the firm is classified as a growth company.
According to the EMH, value stocks are inherently riskier than growth stocks, yielding, therefore, higher returns (Santos & Montezano, 2011). And value stocks have higher B/M exactly because the market would be efficient at the time it demands higher return so that its risk is offset, and its price is high. Tobin (1969) already noted that, according to the economic literature, B/M was associated with investment efficiency and company growth. This association derives from the substantial similarity and correlation between the M/B ratio and Tobin’s (1969) Q, where the last one is generally calculated by the quotient of the market value of a company by the replacement costs of its fixed assets. In the difficulty of measuring the replacement costs, the M/B has been used, since the M/B variation results from the market value being able to capture future expectations associated with the investments made by the company, which can increase long-term stock returns (Famá & Barros, 2000).
Chen and Zhao (2006) observe that the M/B ratio reveals a company’s investment opportunity, and its relationship to market timing and growth opportunity. In this context, if the expectation of greater growth of the firm is realized and its CF becomes greater, from the point of view of Varaiya, Kerin, and Weeks (1987), the shareholder value creation is revealed. Thus, M/B is interpreted as a measure of the profitability of new capital investments, defined as the ratio between an additional unit of the market value of equity for its book value. In an efficient market (EMH), if a company’s M/B>1, it will maximize its value by investing in profitable projects, until the exhaustion of the projects and resources when the M/B will have a value of 1. At a point when M/B<1, the firm will do the reverse: it will sell part of its capital stock to rebalance the ratio. Due to this theoretical proposition, in competitive markets, the M/B (and B/M) should be close to 1. Consequently, since B/M is the inverse of M/B, an inverted reading of these values can be made for B/M.
The M/B is an indicator of the firms’ growth opportunities because firms with high M/B have more incentive to make new capital investments in comparison to those that exhibit a lower M/B (Famá & Barros, 2000). In the finance literature, the valuation techniques seek to determine the fair value (in equilibrium) of a firm and its stocks. Generally, according to the rational expectation, the valuation process suggests that the stock price is a function of the expectations of future CF discounted by a rate that reflects the required return, the cost of capital. Therefore, ceteris paribus, if there are expectations of higher growth in CF, the higher should be the shares prices (Sloan & You, 2015). This relationship has its origins from the normative stock valuation models of classical theory, such as Gordon’s dividend discount model, where the price is given by the ratio of future dividends to the cost of capital subtracted from the rate of sustainable growth from the company. The same relation can also be established according to modern models, such as that derived from the third proposition of Miller & Modigliani (1961), where dividends are irrelevant, and the price of shares depends on the investment and growth decisions that increase the free CF.
According to the valuation approach, when we apply these concepts to the M/B characteristic, it is possible to note that the M/B is a positive function of the firm’s equity and earnings. For Varaiya et al. (1987), profitability and growth do influence shareholder value. These arguments are consistent with the residual income valuation of Ohlson (1995) that implies a valuation premium for profitability as measured by ROE. Then, M/B can be a positive function of ROE and, consequently, a positive function of payout level and dividends growth. On the other hand, it is a negative function of growth required rate of return. In this sense, we present the expected relation of these variables as follows:
Mi,t/Bi,t=[E(ROEi,t)×E(DPSi,t/EPSi,t)]/(ki,t–gi,t).Mi,t/Bi,t=[E(ROEi,t)×E(DPSi,t/EPSi,t)]/(ki,t–gi,t).
If:
gi,t=(1−E(DPSi,t/EPSi,t))×ROEi,t,gi,t=(1−E(DPSi,t/EPSi,t))×ROEi,t,
we have:
Mi,t/Bi,t=[E(ROEi,t)−gi,t]/(ki,t–gi,t),Mi,t/Bi,t=[E(ROEi,t)−gi,t]/(ki,t–gi,t),
where E is the expected value operator; M the price of the stock i at time t; B the book value of the stock i at time t; DPS the dividends per share; ROE the value of return on equity; EPS the earning per share; g the sustainable growth rate of dividends defined by g=ROE (1−DPS/EPS), and k the required rate of return.
When analyzing growth opportunities, from the perspective of the corporate life cycle, companies that opened recently tend to have higher revenue growth but would still report negative or low growth profits. After the initial public offering, the companies with the most exceptional growth opportunities would invest more and present higher revenue and profit growth. Later, these companies will enter a period of maturity and exhaustion of most profitable projects, and then will distribute the profits to the shareholders (Dickinson, 2011).
For Pástor and Veronesi (2003), the M/B ratio tends to decrease as companies grow and establish themselves in the market. This is consistent with Santos and Montezano (2011)view in the Brazilian market. At this point, there is an increase in information on future profitability, implying that bigger and older companies will have lower M/B ratios (value companies). Therefore, according to this view, companies with more significant growth opportunities, which may be associated with growth stocks, would show higher growth in revenues and profits. The inverse is true. Also, the M/B ratio grows with the uncertainty about the average profitability of firms and tends to decrease as investors receive more information and learn about future profitability. At this point, according to their valuation model, it is expected that the profitability of companies will show a mean reversion, implying that companies with high (low) profitability – usually growth companies (value) – display a negative (positive) variation over the years (Pástor & Veronesi, 2003).
In empirical research conducted in the US equity markets, growth stocks have higher ROE, as well as higher stockholders’ equity growth, even after five years of their inclusion in portfolios. Also, value companies with high B/M, earnings-to-price and cash-to-price ratios show lower futures net income, while growth companies report persistently higher net income (Fama & French, 1995, 1998, 2006). The authors attribute the higher growth and persistence of ROE, net income and revenues as noise proxies for future CF, where lower performance and hence less profitable firms (financial distress) would be riskier, suffering a higher discount. However, according to Lakonishok, Shleifer, and Vishny (1994), growth stocks have high growth in net income, CF and revenues. But, after two years, the value stocks show significant growth in these indicators. The authors attribute the superior returns of value stocks in the US market to the extrapolation of recent growth based on naive investing, making growth stocks substantially more expensive and value stocks cheaper.
In more recent works, Penman, Reggiani, Richardson, and Tuna (2015) show that, after two years of portfolios’ formation, the value stocks show more significant growth in net income when compared to growth stocks. According to Chen (2017), in annually rebalanced portfolios CF from value stocks grow faster than growth stocks. In buy and hold portfolios, the CF of both types of shares grow indistinctly. The evidence presented by Chen (2017)broadens the understanding of real firm growth and the difficulty of valuation models in capturing expected growth. And in this study, we seek to present an advance on the findings of this author, from the perspective of shareholder value creating in an emerging market.
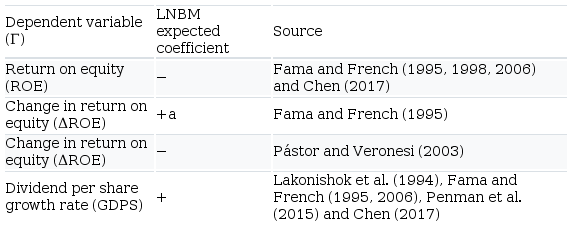
Therefore, based on the normative valuation models presented in Equations (1) and (2), and the empirical evidence set above, we established the following expected relationships:
1. ceteris paribus, companies with lower B/M present higher profitability – so, growth companies are more profitable (Fama & French, 1995, 1998; Chen, 2017);
2. ceteris paribus, companies with higher earnings growth and dividends, present lower B/M ratios (Fama & French, 1995, 2006); and
3. due to their mean reversion, growth (value) companies present negative (positive) future profitability variation (Pástor & Veronesi, 2003).
3. Research design
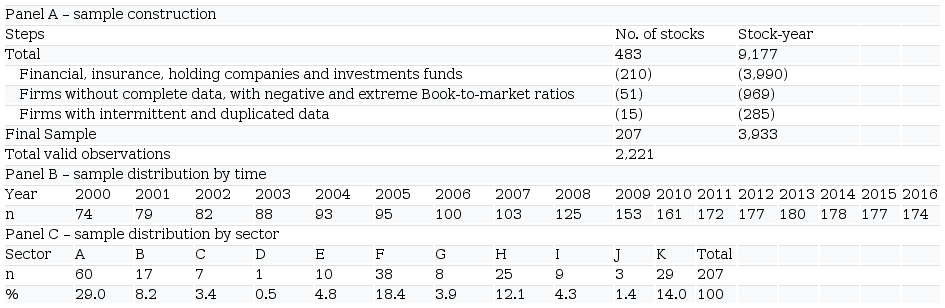
We got the data from two databases. First, we use the Thomson Reuters Eikon to get the accounting and financial data of each firm, and the website of the Brazilian Institute of Geography and Statistics (IBGE) to collect the Brazilian inflation index (IPCA). We select all companies with available data between December/1997 and April/2017. Table I summarizes the sample construction and distribution.
In Panel A, as a first filter, following the related literature (Lakonishok, Shleifer, & Vishny, 1994; Fama & French, 1995, 1998, 2006; Chen, 2017) we drop financial, insurance and holding companies. We use this methodological procedure because the B/M ratio of those companies cannot be comparable to the rest of the sample: the banks and financial companies usually have high levels of leverage and this debt can bias the B/M (Fama & French, 1992). As a second filter, we drop companies without complete data of total assets, the book value of equity, net sales, earnings before interest and taxes and dividends per share. We also drop B/M variables bigger than 500 or negative. We maintain the same number of observations per variable. Finally, because we have different kinds of stock in Brazil (e.g. ordinary and preferred), we drop firms with duplicated stocks. After all the filters, we lost the observations for the years 1997–1999.
In Panel B, we show the sample distribution by time. As a result, the sample has an average of 130 stocks per year, with a maximum of 180 stocks in the year 2013 and a minimum of 74 stocks in the year 2000. In Panel C, the “Consumer Discretionary,” “Industrial” and “Utilities” sectors concentrate almost 62 percent of our sample. This distribution is similar to the population distribution. So, on average, our sample represents 15.78 percent of the firm’s population.
3.1 Variables of interest
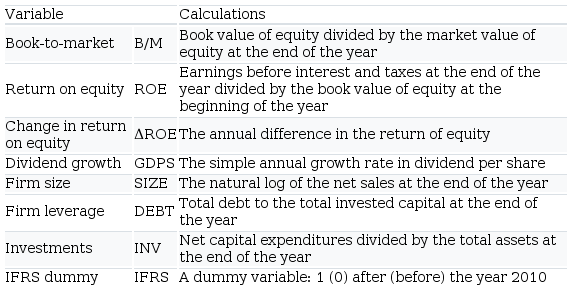
Table II summarizes the procedure that we adopt for the calculation of the variables. The main dependent variables are the level of profitability (ROE), the annual change on return on equity (ΔROE) and the annual growth of dividends (GDPS). We use the annual change on ROE because the negative earnings could generate distorted results for growth. We deflate all variables related to growth, except ratios, to January 2018 with the IBGE’s Consumer Price Index – IPCA and winsorized all values by 2.5 percent at every year t in both tails.
In the regression section of our paper, we use several control variables related to the firm’s growth and performance literature (Lakonishok et al., 1994; Fama & French, 1995, 1998, 2006). The firm size as used as a control variable because there are several pieces of evidence that large firms are in a different corporate life cycle (Miller & Friesen, 1984), large firms can issue more debt (Frank & Goyal, 2009), and are more sensitive to the size risk effect (Fama & French, 1992). To measure firm size, empiricists usually adopt the market value of equity. However, since we are trying to measure if the B/M is a predictor of firm growth potential (Santos & Montezano, 2011), we must avoid any mechanical correlation between the independent variables. This relationship can emerge if we use both the B/M and the market value in the same regression model. So, following the Dang, Li, and Yang (2018)suggestions, we adopt the natural log of net sales as the main size measure. Using this variable also avoid the same mechanical correlation problem between our Investments (INV) and another potential size measure, the total assets.
We also control for firm levels of debt and corporate investments. We add the first one because the use of debt financing can inflate the ROE, due to the financial leverage effect (Ross, Westerfield, Jaffe, & Lamb, 2015). Also, B/M is associated with the leverage effect (Bhandari, 1988) and financial distress (Dichev, 1998). The second one is added to control for firms’ investment policies: if the firm has huge growth opportunities, it generally shows a high level of capital expenditures to generate such growth (Ross et al., 2015). In addition, according to both Gordon dividend valuation model and discount CF valuation model, if a firm uses its CF to finance new projects, there will be a negative impact in the current levels of CF payout. However, we will not make inferences abort the expected coefficient for the INV since there is research that documents a non-optimal investment policy and a catering behavior to maintain an overvalued equity scenario (Jensen, 2008; Dong, Hirshleifer, & Teoh, 2012).
Finally, we add an IFRS dummy variable after the year 2010, since the transition to the IFRS can impact the firms accounting reports. In Brazil, there is evidence of a rise in the total asset and the book value of equity after the IFRS adoption. While, ROE tends to have a lower value because of the rise in its denominator (Ferreira, Flores, Martins, & Sampaio, 2015).
3.2 Portfolios’ formation
To analyze if there is a difference in the growth rates of value and growth stocks, the first part of the analysis consists of the formation of the portfolios based on the B/M ratio. The use of portfolios reduces noise and measurement errors in comparison with individual assets (Blume, 1975). This procedure is a standard approach in the asset pricing research and has used by other similar studies, like Fama and French (1995, 1998, 2006), Lakonishok et al.(1994) and Chen (2017).
For this study, we adopt a procedure like that described by Chen (2017): in April of each year t, from 1998 to 2016, we rank stocks according to their B/M ratio. Then, we form five portfolios based on the quantiles 20°, 40°, 60°, 80° and 100°. Stocks with B/M below the 20th quantile represent high-growth stocks (G5 portfolios). Stocks with B/M higher than the 20th quantile and below the 40th quantile represent growth stocks (G4 portfolios). Stocks with B/M between the 40th and the 60th quantiles represent the neutral portfolio (N3 portfolios). Stocks with B/M above the 60th quantile, but below the 80th, represent value stocks (V2 portfolios). Finally, stocks with B/M above the 80th quantile represent the high-value portfolio (V1 portfolios).
After the portfolios’ construction, we developed two types of portfolios for each variable analyzed: the equally weighted buy and hold (EWB&H) and the value-weighted buy and hold (VWB&H). Each of these two portfolios has a specific objective. The buy and hold portfolios allow the monitoring of the same stocks and the analysis of the dynamics of the variables over time. This same procedure was adopted by Chen (2017) for the US market, allowing the comparison by the size of the company. Thus, if growth rates are higher (smaller) in equally weighted portfolios (EWB&H), but do not show the same dynamics in value-weighted portfolios (VWB&H), it is possible that big firms show larger (smaller) growth rates than the small ones.
For both portfolio analyses, we provide average comparisons between growth and value portfolios every year after the portfolios’ formation and a general mean comparison test using the standard t-test for the entire period.
3.3 Regression models
The regression analysis sought to analyze the explanatory power of the B/M in the profitability (ROE) and the growth rate of earnings (ΔROE) and dividends (GDPS). As a first step, in order to make a comparison between our study and the study developed by Chen (2017), we estimate firm-level regressions of ROE, ΔROE and GDPS on several lagged B/M ratios (k). To do so, we implement the Fama and MacBeth (1973) and the fixed effect by sector procedure over the period 2000–2016, for k between 1 and 5.
This type of regression allows us to observe the long-term relationship between the B/M levels and the growth variables. The following equation summarizes the model:
Γ(ROE,ΔROE,GDPS)i,t=β0+β1(LNBM)i,t−k+εi,t,Γ(ROE,ΔROE,GDPS)i,t=β0+β1(LNBM)i,t−k+εi,t,
where for every firm i in the year t, the Gamma variable (Γ) is one of the growth variables: ROE, ΔROE or GDPS. LNBM is the natural log of the B/M ratio. We use the ln to minimize the effects of possible outliers, as pointed by Lakonishok et al. (1994). We report Newey-West t-statistics with an automatically selected number of lags for the Fama-MacBeth (1973) procedure and the Rogers (1993) cluster robust t-statistics for the fixed effects estimation.
In the second step, we want to explore the robustness of the relationship to various kinds of controls. To do so, we add several control variables to the Equation (3): the firm size (SIZE), the level of debt (DEBT), the level of corporate investments (INV) and an IFRS dummy variable. Besides, we add time and sector dummies to control for any unobservable effect that does not vary between the years and sectors. We expose the multivariable regression model in the following equation:
Γ(ROE,ΔROE,GDPS)i,t=β0+β1(LNBM)i,t+β2(SIZE)i,t+β3(DEBT)i,t+β4(INV)i,t+β5(IFRS)i,t+YearDummies+SectorDummies+εi,t,Γ(ROE,ΔROE,GDPS)i,t=β0+β1(LNBM)i,t+β2(SIZE)i,t+β3(DEBT)i,t+β4(INV)i,t+β5(IFRS)i,t+YearDummies+SectorDummies+εi,t,
where for every firm i in the year t, the Gamma variable (Γ) is one of the growth variables: ROE, ΔROE or GDPS. LNBM is the natural log of the B/M ratio. SIZE the firm size variable, measure as the ln of the net sales. DEBT the leverage variable, measured as the total amount of debt to total invested capital. INV the corporate investment variable, given by the ratio of the capex to total assets, and IFRS the dummy variable that assumes the value of 1 (0) after (before) the year 2010. We report the Rogers (1993) cluster robust by firms t-statistics for all Equation (4)regressions. Table III summarizes the expected variables coefficients and the studies.
4. Results
We split this section into three parts. The first one is descriptive and briefly presents the characteristics of our sample and the first insights into the variable’s bivariate relationships. In the second one, we analyze the two types of portfolios: equally and VWB&H portfolios. In the last part, we conduct univariate and multivariate regression analysis.
4.1 Descriptive and correlation analysis
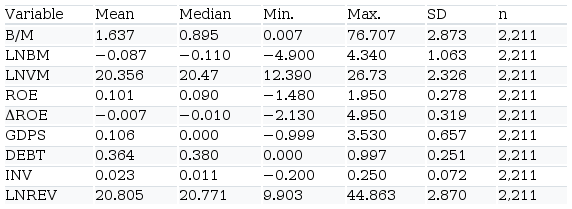
Table IV shows the summary statistics. Our main variable, the B/M ratio, shows one of the most substantial standard deviations of the sample due to the presence of significant outliers. Therefore, the B/M mean of 1.637 is lower than the average reported by Cordeiro and Machado (2013), between 1995 and 2008, of 1.81, and agrees with the tendency that the B/M has been reducing in Brazil, with the predominance of growth companies.
On average, the companies show an ROE of 10.1 percent. The annual change in ROE is −0.7 percent. This number is so close to 0 that supports the finds of the persistent real profitability ratios over the years (Fama & French, 1995; Chen, Novy-Marx, & Zhang, 2011). Regarding the real growth of the dividends (GDPS), the sample has extreme minimum and maximum values that inflate the mean statistics. Such a distribution supports the 2.5 percent winsorization that we implemented on all variables.
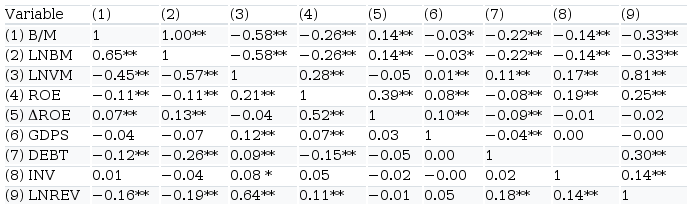
Table V shows the Pearson (in the bottom) and Spearman (in the top) correlation matrix and allows us to express the first association’s insights between the variables. Also, it allows us to observe the possible multicollinearity problems that could bias our regression models. In this sense, we reject this possibility, since according to Brooks (2014) multicollinearity problems only arise when there are correlations between independent variables higher than 0.8. However, since the simple observation of the pairwise correlation could be a weak analysis, we try to avoid any mechanical correlation between the independent variables. Also, we conduct a variance inflation factor test, and all variables are below the threshold of 5 (Wooldridge, 2010).
As reported, in general, the variables show a low to the medium association. However, we must highlight some high significant correlations: the negative association between the market value (LNVM) and B/M (LNBM) points out that the growth firms are also the largest ones in Brazil. This relationship is also observed in the correlation between the B/M and our non-mechanical correlated size measure, the ln of net sales (SIZE). This relationship contradicts the conventional wisdom that growth stocks and, consequentially, firms with high growth opportunities are small firms. Growth companies are the most profitable companies (ROE and LMBM), but they do not have the higher annual change in ROE (ΔROE) and there is no statistical relationship between the B/M and dividends growth rates (GDPS).
Finally, despite being a quick analysis of the existing relations, the Pearson/Spearman correlations tests do not allow for more considerations about the behavior and evolution of ROE, ΔROE and GDPS, since the above analysis only compares pairs of variables in the same year t. At the same time, it does not allow for control over other variables that can influence profitability and growth. The portfolios analysis, developed in the next section, seeks to fill the variables temporal evolutions gap.
4.2 Equally weighted portfolios analysis
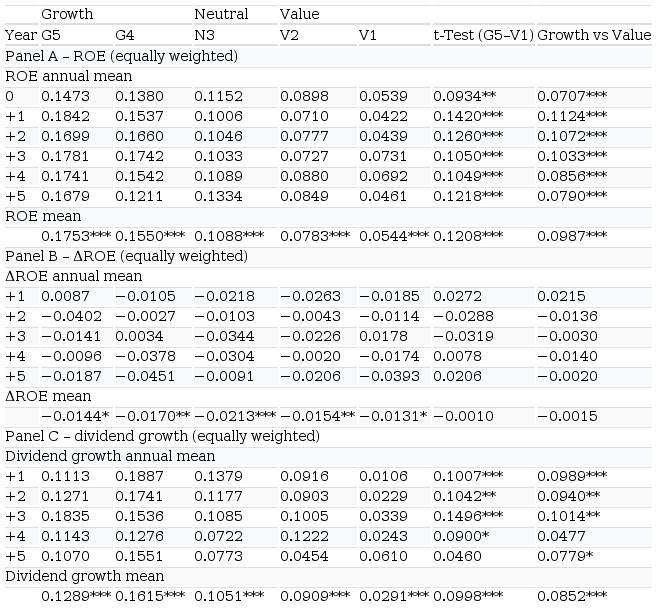
First, we present the results of the EWB&H portfolios for the ROE, ΔROE and GDPS variables in Panels A, B, and C of Table VI. These portfolios consider the same weight for all the stocks, regardless of the market value of each one. We use a t-test to test for the difference between the growth and value portfolios variables.
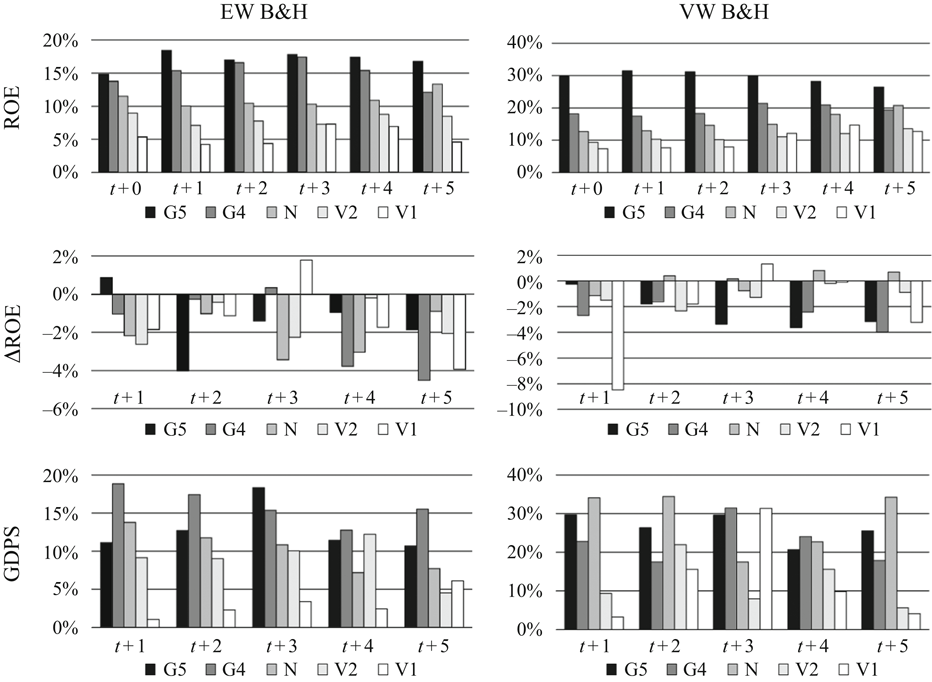
As shown in Panel A of Table VI, all portfolios have statistically significant ROE (see the ROE mean line). By comparing the overall profitability of Growth-5 portfolios (G5) with the overall profitability of Value-1 portfolios (V1), growth stocks are more profitable than value stocks, with a global mean of 17.53 percent, vs 5.44 percent, respectively. In the year-on-year comparison between the two extreme portfolios (G5 and V1), growth stocks were more profitable than value stocks in every year after the portfolios’ formation.
Panel B of Table VI compares the annual change in firm profitability (ΔROE). As reported, no portfolio comparison presents statistically different results from 0 in the year-on-year comparison. However, we have a negative variation in the entire sample mean. These findings corroborate those reported in the US market that profitability is consistent over the years, with no relevant annual variation per company (Fama & French, 1995; Chen et al., 2011).
Panel C reports the annual growth of dividends per share. According to our findings, in general, dividends of growth stocks grow faster than the dividends of value stocks, creating greater shareholder value, with a mean of 12.89 percent for growth stocks and 2.91 percent for value stocks, in the five years of portfolio formation. As for the year-on-year comparison, the growth stocks dividends growth is higher than those reported for value stocks for all year comparison, except in the fourth year. In general, in an equally weighted portfolios scenario, growth companies show higher profitability and dividends growth per share than value stocks. In this context, growth companies create greater value for their shareholders. We do not find evidence that the profitability is changing during the five years of stock’s maintenance.
4.3 Value-weighted portfolio analysis
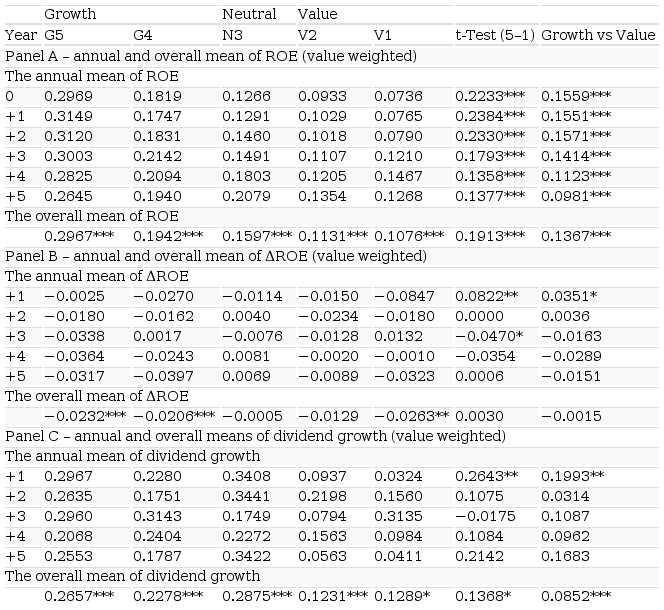
The analysis of the value-weighted portfolios aims to expose the role of large companies in stock portfolios. If the results are similar to those reported in the EWB&H, so size is not an essential characteristic for firm profitability and growth. In Panel A of Table VII, growth firms show higher overall profitability, the findings hold during all years after the portfolios’ formation, with an overall mean of 29.67 and 10.76 percent for growth and value firms, respectively. Also, in the year-on-year comparison and similar to the EWB&H portfolios, the growth stocks show a high level of profitably too.
Panel B reports the annual differences in profitability. As we note, the overall profitability of growth stocks declined −2.32 percent on average over the five years after the formation of portfolios. The analysis does not allow the assertion that there are significant differences between the two portfolios. Therefore, the findings with the value-weighted portfolios show that the firms with the highest market value contribute to a more significant reduction in the annual profitability of the portfolio.
Panel C shows the annual growth in dividends per share of value-weighted portfolios. The overall mean value of the growth portfolio (G5) was 26.57 percent, vs 12.89 percent of the value portfolio (V1). However, we only observe a statistical difference between growth and value stocks in the first year after portfolios’ formation, while all others were not statistically different from 0. These findings, when compared to those reported in the EWB&H portfolios, demonstrate that the companies with the highest market value have higher dividend growth. This finding, which differs from Chen (2017), is possible in Brazil because growth companies are more profitable, demonstrating that the Brazilian market offers a premium for firms with better performances. In Brazil, the Law 6,404/1976 requires companies to indicate a mandatory minimum dividend. Therefore, growth companies tend to be more profitable, which leads them to distribute more dividends.
Thus, the portfolios analysis allows some considerations, as listed below:
1. The ROE of growth firms is significantly higher than that reported by value firms. The weighting by market value exacerbates the difference between these two types of stocks, indicating that firm size is an essential characteristic in the profitability of those firms.
2. The annual change in ROE is not significant in the equally weighted portfolios, showing that the profitability of each firm shows little variation in the years after the portfolio’s formation. However, the difference in profitability is significantly higher in value-weighted portfolios, implying that larger companies have a greater annual reduction in profitability.
3. Growth companies have higher dividend growth in equally weighted portfolios when compared to value companies. In value-weighted portfolios, we have the same findings from the EWB&H portfolios, if the addition that the market value increases the relevance of dividends in the extreme portfolios (G5) and (V1). Figure 1 summarizes the dynamics in each of the studied portfolios.
4.4 Regression analysis with individual stocks
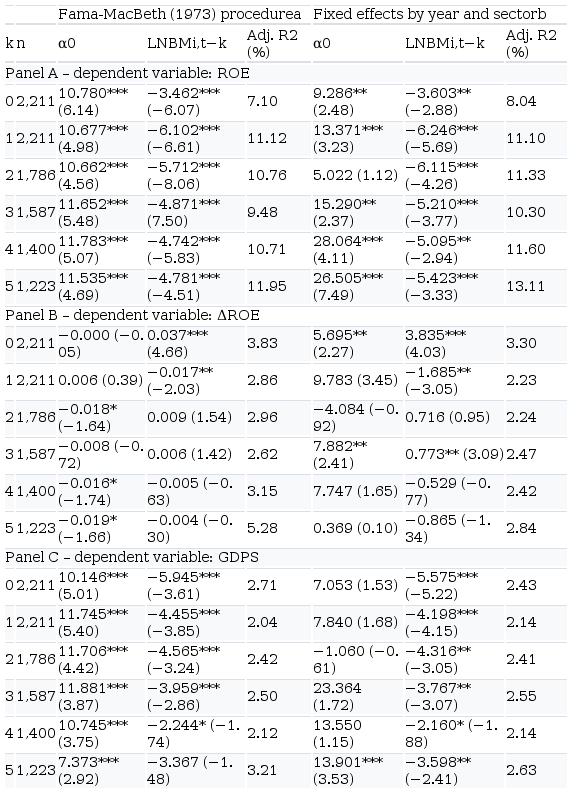
In this section, we show the results of the univariate and multivariate regressions, whose objective is to test whether B/M ratio is associated with the level and growth of profitability and the dividends growth. First, in Table VIII, we show evidence that growth (value) stocks grow faster (slowly) in the analyzed period using univariate regression models with a variety of lag values (k). We perform the analysis using both Fama and MacBeth (1973) regression and fixed effects by sector.
According to the univariate regressions in Table VIII, we can see that the rise of B/M (LNBM) is associated with a decrease in the ROE. This univariate relationship is evident in both kinds of estimation procedures and is robust in all lagged values. So, growth stocks (i.e. low B/M stocks) are associated with a low degree of profitability over the years. We can conjecture that the negative coefficients relay stable over the years too. These findings advance on the study of Santos and Montezano (2011) who identified that in the Brazilian market value stocks are actually less risky, with better market performance. For these authors, in the Brazilian market, the EMH would be contradicted, however, the authors reach such a conclusion only by comparing the market return and risk of different portfolios assembled from price-to-earnings and price-to-book ratios. On the other hand, we perform our analysis using both Fama and MacBeth (1973) regression and fixed effects by sector, controlling effects disregarded by Santos and Montezano (2011).
In addition to our findings pointing to some efficiency in the market, as previous studies (Fama & French, 1995; Chen, 2017), we strengthen those results: the positive relationship between growth and firm profitability (ROE) is significant in all analyzed periods. These findings are in line with those reported by Fama and French (1995) and Chen (2017), which present evidence of the profitability superiority of growth companies in the US market. So, firms with higher profitability tend to be better priced by the market, which leads to a smaller B/M, in line with EMH.
Moving to the next panel (Panel B), we test the annual change ROE (ΔROE) as the dependent variable. In this univariate analyses, B/M ratio (LNBM) shows mixed results. In the current year (i.e. the year without lagged variables), we have positive coefficients. But, when we lagged the variable by one year, we have negative coefficients for both kinds of estimation procedures. This pattern is dubious since according to the results, we can say that the value stock shows strong growth in the earnings in the year (k=0), but they also show subsequent negative earnings in the year ahead (k=1). So, it is hard for us to make any strong inferences about the chance of profitability (ΔROE) behavior in the long run. However, since the profitability remains relativity stable over the years, it is possible that any change in ROE is statistical irrelevant (Fama & French, 1995).
Finally, Panel C shows the univariate coefficients when we regress the dividend growth (GDPS) on the B/M ratio (LNBM). According to our findings, B/M appears to strongly forecast low dividend growth rates. All coefficients are negative in almost every year after the current observation (k=0) for both kinds of regressions. So, the growth stocks are associated with high dividend growth rates even after five years. Those results are very similar to those exposed by Chen (2017), before account for firm delisting. However, since our Brazilian time series is tiny compared to the US one and since the delisting process is not so significant in our sample, we can reject the bias related to the delisting of growth companies in the Brazilian equity market.
So far, the results obtained are strengthened those of the previous analysis: the positive relationship between growth and profitability (ROE) is significant in all periods; the annual change in ROE is robust for the current year, but we cannot affirm that this behavior is robust for the next years after portfolio formation; and the growth stocks show a strong growth in the dividends in almost every year after the portfolios’ formation. Now, we move to the following question: what will happen if we account for several control variables that could affect the profitability and growth rates? To answer this question, we add several control variables to our regression models to account for the firm size, leverage, investment policies, IFRS adoption and unobservable fixed effects on sectors and by the years.
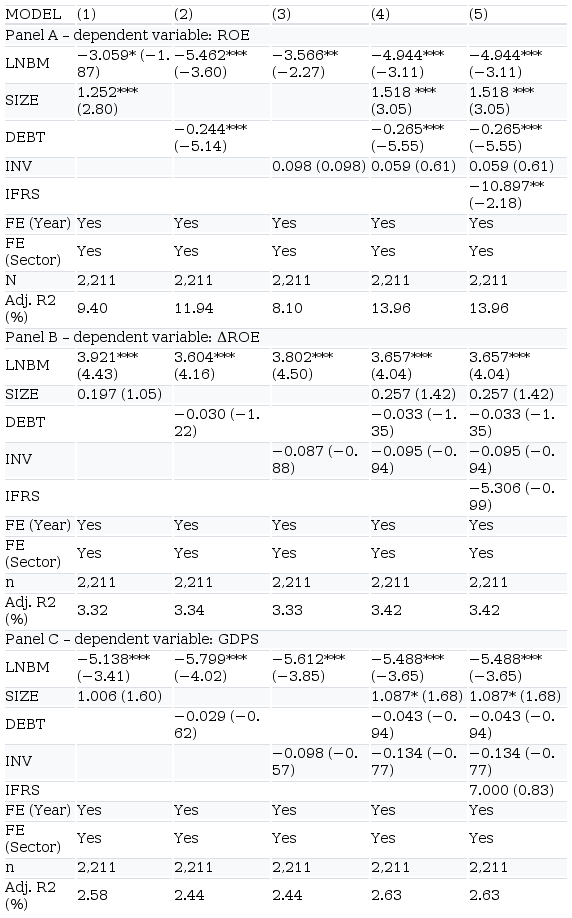
Table IX shows the multivariate regressions results. In Panel A, we have support for both portfolio and univariate regression analysis: the higher the B/M ratio (LNBM), the lower will be the level of profitability (ROE). This relationship is robust to the addition of firm size, debt, investment and IFRS adoption. The size appears to be a positive predictor of profitability. Large firms usually have more access to the financial markets because of the low cost of capital (e.g. see the positive correlation between LNREV and LNVM with DEBT). This could affect the levels of profitability if the firm uses a low cost of debt to finance projects with a high rate of return. On the other hand, the debt (DEBT) is a negative predictor of profitability. So, firms that use more debt are those with low levels of internal funds (Frank & Goyal, 2009). The level of investments (INV) seems to be insignificant in the ROE prediction, but the year with IFRS adoption has a negative impact on firm’s ROE. According to Ferreira, Flores, Martins, and Sampaio (2015), after the IFRS adoption, there is a reduction in the return of assets and ROE, due to a rise in the total asset and book value of equity.
In Panel B, we analyze the annual change in ROE. The results are similar to those exposed in the portfolio and univariate regression analyses, especially, in the case of current observation: the higher the B/M, the higher will be the ΔROE. However, we show in Table VIII that B/M is not a good predictor of ΔROE in the long run. So, our analysis is restricted to the current year (k=0). The controls do not seem to affect our dependent variable. Finally, in Panel C, we analyze the dividend growth rate GDPS. Again, the findings are similar to those exposed in the portfolio and univariate regression analyses: the higher the B/M, the lower will be the GDPS. So, growth stocks have a higher rate of growth in dividends per share compared to value stocks. This relationship is robust after the inclusion of all control variables and time and sector fixed effects. In addition, SIZE appears to be the only characteristic that matters for dividend growth prediction. However, since its p-values are above the 5 percent threshold, we will not make inferences about its relevance in our regression model.
5. Conclusion
This study sought to analyze how stocks of growth and value companies create value for their shareholders in Brazil, compared to the USA market. The rationale for this analysis is based on the corporate valuation literature that growth stocks grow faster than value stocks, with higher profitability and dividend growth. And we find that the profitability levels of growth stocks are higher than those of value stocks. However, the results are not easily observed for the annual profitability difference. In the same line, we show evidence that growth stocks have higher dividend growth both in the current year of portfolios’ formation.
Regarding the findings for dividends, our findings are contrary to the findings for US market, because in Brazil the growth companies show higher dividend growth in the overall mean and the long run after the portfolio’s formation. We conjecture two possible explanation: in Brazil, the Law 6,404/1976 requires a mandatory minimum dividend of the firms, and our findings point out that growth companies tend to be more profitable, which leads them to distribute more dividends; since the Brazilian market is characterized by a considerable presence of big companies, during the majority of the analyzed period (2000–2016), those companies could get relatively cheap financing by subsidized funding lines (Kayo, 2018) and, despite the Brazilian economic recession in 2015, they express a huge growth in their profitability and, consequently, the possibility to make bigger payouts.
In this case, investors how are looking to form a portfolio with dividend growth potential, in the long run, could invest in large growth stocks. However, it is essential to note that we just analyze the historical growth rate, but we do not make any consideration of the amount of equity mispricing. So, for future studies, it is vital to observe the potential degree of overvaluation using other metrics such as Stambaugh, Yu, and Yuan (2015) mispricing index as an additional investment decision-making tool to avoid wealth misallocations.
For practical implications, the findings help to estimate the growth rates in the valuation process of firms and stocks. In the top-down valuation approach, especially for high-growth firms, the analyst often uses a market growth rate to estimate the value of a stock. Our data can be used as a background for financial discount cash-flow modeling of growth in profitability and dividends. In part, the findings of this research contradict those observed in the literature for the US market: on the contrary to the US markets, in the Brazilian stock market, the duration-based explanation for the equity market can be a vital factor in resolving the value premium.
Finally, we point out a limitation of this study the use of economic models to represent a complex reality, and their theoretical assumptions. Especially the limitations regarding approaches to behavioral finance and accounting measurement because, although relevant, it was not the purpose of this study to discuss them. However, they should not be ignored, which may influence the results. However, in view of the gap in the literature, the robustness of our analysis and the relevance of our findings, we can affirm that such limitations do not invalidate our study, especially because we report findings in line with the international literature, but different from national studies. Thus, we suggest that future studies based on these findings should be performed, especially in order to explore such context under another methodological strategy, or under behavioral finance or accounting measurement views.
References
Bhandari, L. C. (1988). Debt/equity ratio and expected common stock returns: Empirical evidence. Journal of Finance, 43(2), 507–528.
Blume, M. E. (1975). Betas and their regression tendencies. Journal of Finance, 30(3), 785–795.
Brooks, C. (2014). Introductory Econometrics for Finance (3rd ed.). Cambridge University Press, Cambridge, MA.
Chen, H. J. (2017). Do cash flows of growth stocks really grow faster?. The Journal of Finance, 72(5), 2280–2330.
Chen, L., & Zhao, X. (2006). On the relation between the market-to-book ratio, growth opportunity, and leverage ratio. Finance Research Letters, 3(4), 253–266.
Chen, L., Novy-Marx, R., & Zhang, L. (2011). An Alternative Three-Factor Model. working paper, Available from: http://dx.doi.org/10.2139/ssrn.1418117
Cordeiro, R. A., & Machado, M. A. V. (2013). Value or growth strategy? Empirical evidence in Brazil. Review of Business Management, 15(46), 91–111.
Croce, M. M., Lettau, M., & Ludvigson, S. C. (2007). Investor information, long-run risk, and the duration of risky cash flows. NBER Working Paper No. 12912. Cambridge, MA.
Dang, C., Li, Z., & Yang, C. (2018). Measuring firm size in empirical corporate finance. Journal of Banking & Finance, 86, 159–176, Available from: https://doi.org/10.1016/j.jbankfin.2017.09.006
Dichev, I. (1998). Is the risk of bankruptcy a systematic risk?. Journal of Finance, 53(3), 1141–1148.
Dickinson, V. (2011). Cash flow patterns as a proxy for firm life cycle. The Accounting Review, 86(6), 1969–1994.
Dong, M., Hirshleifer, D., & Teoh, S. H. (2012). Overvalued equity and financing decisions. The Review of Financial Studies, 25(12), 3645–3683.
Fama, E. F., & French, K. R. (1992). The cross-section of expected stock returns. Journal of Finance, 47(2), 427–465.
Fama, E. F., & French, K. R. (1995). Size and book-to-market factors in earnings and returns. Journal of Finance, 50(1), 131–155.
Fama, E. F., & French, K. R. (1998). Value versus growth: the international evidence. The Journal of Finance, 53(6), 1975–1999.
Fama, E. F., & French, K. R. (2006). Profitability, investment, and average returns. Journal of Financial Economics, 82(3), 491–518.
Fama, E. F., & MacBeth, J. D. (1973). Risk, return, and equilibrium: Empirical tests. Journal of Political Economy, 81(3), 607–636.
Famá, R., & Barros, L. (2000). O Q de Tobin e seu uso em finanças: aspectos metodológicos e conceituais. Caderno de Pesquisas em Administração, 7(4), 27–43.
Ferreira, M., Flores, E., Martins, C., & Sampaio, J. O. (2015). Analysis of the impact of IFRS adoption on financial variables for Brazilian companies. SSRN working paper, Available from: https://ssrn.com/abstract=2591536
Frank, M. Z., & Goyal, V. K. (2009). Capital structure decisions: Which factors are reliably important?. Financial Management, 38(1), 1–37.
Graham, B., & Dodd, D. (1934). Security Analysis, McGraw-Hill, New York, NY.
Jensen, M. C. (2008). Agency costs of overvalued equity. Financial Management, 34(1), 5–19.
Kayo, E. K. (2018). Political connections, subsidized loans, and capital structure adjustments. EnANPAD, In Anais, ANPAD, Rio de Janeiro, Available from: www.anpad.org.br/~anpad/abrir_pdf.php?e=MjUxMjI=
Lakonishok, J., Shleifer, A., & Vishny, R. (1994). Contrarian investment, extrapolation, and risk. Journal of Finance, 49(5), 1541–1578.
La Porta, R., Lopez-De-Silanes, F., Shleifer, A., & Vishny, R. (1997). Legal Determinants of External Finance. The Journal of Finance, 52(3), 1131–1150.
Lettau, M., & Wachter, J. A. (2011). The term structures of equity and interest rates. Journal of Financial Economics, 101(1), 90–113.
Mescolin, A., Braga, C. M., & Costa, N. C. A. Jr (1997). Risco e retorno das value e growth stocks no mercado brasileiro. EnANPAD working paper, Rio das Pedras - RJ, Available from: www.abepro.org.br/biblioteca/enegep1997_t7106.pdf
Miller, D., & Friesen, P. H. (1984). A longitudinal study of the corporate life cycle. Management Science, 30(10), 1161–1183.
Miller, M. H., & Modigliani, F. (1961). Dividend policy, growth, and the valuation of shares. Journal of Business, 34, 411–433.
Ohlson, J. A. (1995). Earnings, book values, and dividends in equity valuation. Contemporary Accounting Research, 11(2), 661–687.
Pástor, L., & Veronesi, P. (2003). Stock valuation and learning about profitability. Journal of Finance, 58(5), 1749–1789.
Pedreira, E. B. (2005). Retorno e Risco das Ações de Valor e Crescimento no mercado brasileiro no período de janeiro de 2001 a junho de 2004, com base no IBrX-50. X Congresso USP de Controladoria e Contabilidade, FEA-USP, São Paulo, Available from: https://congressousp.fipecafi.org/anais/artigos52005/132.pdf
Penman, S., Reggiani, F., Richardson, S. A., & Tuna, I. (2015). An accounting-based characteristic model for asset pricing. working paper, Columbia University, New York, NY.
Rogers, W. H. (1993). sg17: regression standard errors in clustered samples. Stata Technical Bulletin Reprints, 3, 88–94.
Ross, S. A., Westerfield, R. W., Jaffe, J. F., & Lamb, R. (2015). Administração Financeira. Corporate Finance (10th ed.). AMGH, Porto Alegre.
Saito, A. T., Savoia, J. R. F., & Sousa, A. F. (2014). Estratégias de valor e crescimento e a avaliação de empresas no setor elétrico no Brasil. Caderno Profissional de Administração da UNIMEP, 4(2), 1–14.
Santos, L. R., & Montezano, R. M. S. (2011). Value and growth stocks in Brazil: Risks and returns for one- and two-dimensional portfolios under different economic conditions. Revista Contabilidade & Finanças, 22(56), 189–202.
Sloan, R. G., & You, H. (2015). Wealth transfers via equity transactions. Journal of Financial Economics, 118(1), 93–112.
Stambaugh, R. F., Yu, J., & Yuan, Y. (2015). Arbitrage asymmetry and the idiosyncratic volatility puzzle. Journal of Finance, 70(5), 1903–1948.
Tobin, J. (1969). A general equilibrium approach to monetary theory. Journal of Money, Credit and Banking, 1(1), 15–29.
Varaiya, N., Kerin, R. A., & Weeks, D. (1987). The relationship between growth, profitability, and firm value. Strategic Management Journal, 8(5), 487–497.
Wooldridge, J. (2010). Econometric Analysis of Cross Section and Panel Data (2nd ed.). MIT Press, Cambridge, MA, Available from: www.jstor.org/stable/j.ctt5hhcfr
Fama, E. F., & French, K. (1993). Common risk factors in the returns on stocks and bonds. Journal of Financial Economics, 33(1), 3–56