1. Introduction
Purchase intention is an important dimension in marketing literature, and has been used by companies as a variable to predict sales of new products or the repeated purchase of existing products (Diallo, 2012). For Wu, Yeh, and Hsiao (2011), purchase intention represents the possibility for consumers to plan or be willing to buy a specific product or service in the future. Thus, it is a variable of great relevance also in the supermarket sector, which is the target of this research.
Timmer (2004) observes that supermarkets make up a wide and robust logistics structure that depends on an accurate understanding of their consumers in order to avoid food waste or shortage. This strengthens the relevance of studying purchase intention of supermarket customers.
Purchase intention is not limited to simple aspects. On the contrary, as Oliver and Lee (2010)point out, several variables can influence it, either situational, as the evaluation of store image, consumer satisfaction, product price, among others; or motivational, such as values, beliefs and culture of the consumer society involved. In the present study, we considered as situational variables consumer satisfaction and evaluation of store image, because they are elements closer to the reality of purchasing at supermarkets. And we chose culture as the motivational variable.
Oliver (1981) defined satisfaction as the summary of the psychological state that occurs when emotion on the disconfirmation of expectations connects with consumers’ priority feelings about the consumption experience. On the other hand, store image is composed of the various procedures that the customer needs to follow in the physical environment of the store, the moments of contact with employees, and the retailer’s offer (Morschett, Swoboda, & Foscht, 2005). Regarding supermarkets, store image comprises several attributes. In our research, we chose the attributes layout, product and service.
Among the motivational variables, culture is an important element for understanding consumer behavior, and specific models that address consumption include such element (Alfinito & Torres, 2012; Torres & Allen, 2009). In his seminal paper, Hofstede (1980)identified four dimensions of cultural variation by investigating data of more than 116,000 questionnaires from IBM. One of its most relevant results is that culture can be used as a predictive variable. The four cultural dimensions identified in his original study were masculinity–femininity, uncertainty avoidance, power distance and individualism–collectivism (I-C). Later on, Hofstede and Bond (1988), while investigating cultural values in Asia, identified a fifth dimension, initially called Confucian Dynamism and then long-term orientation. Yet, in his work with Minkov (Hofstede, Hofstede, & Minkov, 2010; Minkov, 2007), they also identified the dimensions of indulgence–restraint and monumentalism–flexumility.
Among the identified dimensions, I-C has received more attention from researchers (Smith, Fischer, Vignoles, & Bond, 2013). Triandis (1994, 1995) argues that people’s self-concept can be defined either in terms of the endogroup (or intra-group), or as an independent entity, detached from the groups. For Triandis (1995), I-C is a very broad construct to measure accurately and suggests its measurement at the individual level of analysis. Triandis (1994)and Triandis, Chan, Bhawuk, Iwao, and Sinha (1995) proposed the personality dimensions idiocentrism–allocentrism as a construct at the individual level, which corresponds to the I-C construct at the cultural level. Idiocentrism–allocentrism can be examined through the individual definitions of the self, structure of personal goals, types of relationships emphasized by the individual, and if personal attitudes or social norms are perceived as more or less important while guiding individual behavior. They also proposed variations of idiocentrism–allocentrism in terms of their verticality or horizontality (intrinsically related to Power Distance), which are better discussed below.
However, it is important to notice that although Triandis has coined the terms idiocentrism–allocentrism to differentiate the level of I-C analysis (individual × cultural), several authors argue and accept (Smith, Fischer, Vignoles, & Bond, 2013; Smith & Schwartz, 1997) that the terms can be used interchangeably, for parsimony reasons, provided that the level of analysis used in the research is clearly indicated. In this sense, the conception of I-C at the individual level, proposed by Triandis, has received much attention, since it is a dimension that affects consumption, both in cross-cultural research and in studies of the same culture (Torres, Porto, Vargas, & Fischer, 2015). It leads to a better understanding of consumers’ characteristics and attitudes (Torres & Allen, 2009).
For Triandis (1995), individuals of collectivist cultures see themselves as belonging to some group, and submit themselves to the group’s wills. On the other hand, individuals of individualist cultures are independent, and the group goals are less important than personal goals. Frank, Enkawa, and Schvaneveldt (2015) observe the importance of investigating the role of I-C in developing purchase intention, considering the cultural diversity of consumers. Therefore, this construct composed the cultural dimension adopted in this research, whose objective was to analyze the influence of I-C on the evaluation of store image, and on the satisfaction of supermarket consumers regarding purchase intention. In addition, we sought to observe the influence of store image on consumer satisfaction, and the effect of I-C on store image evaluation.
We noticed the relevance of this research after carrying out a literature review on the subject, which showed the absence of studies addressing the cultural differences among supermarket consumers, and their influence on purchase intention and evaluation of store image. We conducted the search on the websites CAPES Journals, Science Direct and ProQuest, for the period 2010–2016. The keywords used, in a combined form, were “consumer” and “supermarket,” and their respective English translations. We identified 71 articles, which included several variables, among them consumer satisfaction (Amorim, Lago, Moscoso, & Prieto, 2016), purchase intention (Ha, Akamavi, Kitchen, & Fanda, 2014) and evaluation of store image (Kitapci, Dortyol, Yaman, & Gulmez, 2013). The only study that superficially included a cultural aspect was the one by Zhang, Door, and Leeflang (2014).
Therefore, our study explores and analyzes a model that up to now has not been addressed, since we did not find empirical studies that investigated the relationship between I-C, evaluation of store image, consumer satisfaction and purchase intention, together, or in the context of supermarkets. These relationships were tested separately in other retail contexts, as in the study by Seock and Lin (2011). Additionally, Cunha, Spers, and Zylberstajn (2011)suggest the need to study cultural aspects in the supermarket segment; and Yildirim and Aydin (2012) observe that the retail sector shows a constant path of evolution and change, depending on the culture of the company’s region or country.
We carried out the research in Brazil. After the literature review, we noticed that most of the studies that approached consumer behavior in supermarkets focused on Europe and North America. Emerging countries, especially those in South America, received little attention.
2. Theoretical background
Consumer research involves several aspects that are subjective and difficult to identify. One of them is purchase intention, which, according to Cronin, Brady, and Hult (2000), demonstrates the consumer’s trend to buy goods or services in the same store and share his/her experience with friends and family. Thus, an increase in purchase intention can mean a growth in the possibility of buying. Purchase intention can be seen as a dimension of behavioral intention (Zeithaml, Berry, & Parasuraman, 1996), and can anticipate the consumer’s current behavior.
Another subjective aspect relates to consumer satisfaction. Howard and Sheth (1969) define satisfaction as the degree of congruence between aspirations and the reality perceived from consumer’s experiences. To Oliver (1980), satisfaction is the summary of the resulting psychological state when the excitement surrounding the disconfirmation of expectations is connected with the consumer’s main feelings about the consumption experience. Following the same path, Tse and Wilton (1988) state that satisfaction is the consumer’s answer to the evaluation of the perceived difference between expectations and the perceived performance of a product after its consumption.
In Latin, the word “satisfaction” derives from satis (sufficient) and facere (doing), which represents the reach, by the consumer, of what he/she wishes, and in a way that he/she considers sufficient (Oliver & Lee, 2010). Satisfaction is a judgment that the attribute of a product or service provides a pleasant level of consumption, including low or high levels of achievement. Here, the word “pleasant” implies that the achievement provides or enhances pleasure, or reduces discomfort.
In addition to the above-mentioned definitions, the literature states that there are two types of consumer satisfaction: transaction-specific satisfaction and cumulative satisfaction. The first refers to the assessment by consumers after a specific purchase, and the second regards the rating, based on experience (Johnson & Fornell, 1991). Our research addresses the second type of satisfaction.
There are different discussions that explain the consumer satisfaction construct. The main one is the expectancy-disconfirmation paradigm, developed by Oliver (1980). It suggests that consumers prioritize the purchase of a particular good or service, and create an initial expectation. Then they develop perceptions of product performance, after using it, and consequently compare the perceived performance with their initial expectations. The level of satisfaction is built according to the disconfirmation of expectations; thus, satisfied consumers may have a repurchase intention, while dissatisfied consumers may not buy the product again (Oliver, 1980).
Store image is another important element in the context of purchasing. To date, there is no consensual definition of store image, given the disparity between several concepts (Morschett, Swoboda, & Foscht, 2005). In Martineau’s (1958) seminal paper, store image is how the store is defined in the consumer’s mind, including its functional qualities and psychological attributes. The choice of a store is mainly influenced by the image that the consumer has of it.
Most of the scientific community believes that store image is expressed by consumers’ assessment of the store attributes (Devlin, Birtwistle, & Macedo, 2003). That is, for each retail store, a distinct image forms in consumers’ minds (Bloemer & De Ruyter, 1998). The dominant perspective in the literature regards store image as the result of a multi-attribute model (Koo, 2003), which stresses the importance of the weights assigned by each type of consumer to a particular attribute or to a set of them. However, due to the multiplicity of attributes, consumers select the most meaningful one to them.
Store image evaluation is a complex process, because image perception can have different meanings according to the different consumers. Different individuals may be subject to the same stimuli and apparent conditions, but the way they recognize, select, organize and interpret them is an individual process based on the needs, values and expectations of each one of them (Bloemer & Odekerken-Schröder, 2002). Hence, the measurement of store image is an important aspect that the researcher must take into account. The main measurement methods are the evaluation scale, including the semantic differential scale, the numerical and the graphic positioning scale comparisons, open techniques and multidimensional scales (McGoldrick, 2002). For each context, there may be a set of different store image attributes. This will depend on the country, the culture, the type of retail studied, the attributes of consumers, among others.
Many authors have distinguished different dimensions that are part of a store. Lindquist (1974–1975) defined store image as a structure that promotes the merger of dimensions present in a determined activity. The author analyzed 19 studies and defined nine common elements, such as merchandise evaluation, services, convenience, among others. Hansen and Deutscher (1977–1978) conducted an exploratory survey with 900 individuals in the USA in order to identify and compare important attributes of supermarkets and department stores. The attributes were organized in three dimensions: merchandise, physical facilities and services.
There are at least four studies in Brazil that deal with store image attributes. The first, by Rojo (1998), aimed to identify the most important attributes mentioned by consumers (n=1,400) in São Paulo, Minas Gerais and Paraná, regarding the evaluation of supermarkets. These attributes were price, offers and promotions, service, quality, variety, credit, front-end cashier and perishables.
Diallo (2012) investigated the determinants of the choice of own brands in Brazilian supermarkets. The author defined store image by three factors: layout, product and service. The first refers to the layout of the shelves and sections, physical facilities of the store and the ease to find products on offer. The second factor regards the quality, variety and availability of the product; and service refers to employees’ courtesy and knowledge. Our research adopted these dimensions.
Another important variable of consumption is culture (Evanschitzky, Emrich, Sangtani, Ackfeldt, Reynolds, & Arnold, 2014), as already mentioned. A society’s national culture can be examined through the measurement of the country’s cultural dimensions (Minkov & Hofstede, 2014). One of them is I-C, adopted in our research.
I–C is the most searched construct in intercultural and cross-cultural studies (Oyserman, 2017; Walls & Triandis, 2014). In individualist cultures, individuals’ values are independent of other values, and the goals of the group are subordinated to personal goals. On the other hand, in collectivist cultures, individual values are interdependent of the general values of the group, and the group’s goals are prioritized (Hofstede, 1980).
Triandis (1995) distinguishes individualism from collectivism, based on some attributes. For collectivists, the definition of the self is interdependent of group members, while for individualists, it is autonomous and group independent. Collectivists pursue personal goals that are compatible with the group’s objectives and, if there is any discrepancy between them, priority is for the group’s goal. In contrast, individualists pursue goals that may or may not be compatible with the group. Among a variety of situations, collectivists give greater importance to norms than to attitudes, as a determinant of their social behavior. Individualists, in contrast, favor attitudes.
Triandis (1994) points out that I-C are too broad constructs to be easily measured. Thus, the author made the distinction between the horizontal and vertical dimensions. While in “horizontal collectivism” the individual sees himself/herself as a member of a group where equity is the essence of this cultural pattern, in “vertical collectivism” the individual sees himself/herself as a member of a group, but notices differences among the members of that group. In “horizontal individualism,” there is an autonomous self, but individuals are basically equal in status. On the other hand, in “vertical individualism” there is also an autonomous self, but individuals see themselves as different, that is, inequality is expected.
2.1 Research model
In order to develop the research model, we searched the studies that addressed the relationships proposed in our research. The positive relationship between satisfaction and purchase intention was proven in different contexts, both with products and services. Lee, Trail, Lee, and Shoenstedt (2013) identified the factors that affect the purchase of sports products. To do this, they applied a questionnaire to 358 consumers. The result showed that consumer satisfaction explains about 70 percent of the variability of purchase intention.
Ibrahim and Najjar (2007) conducted a survey with Carrefour consumers in Tunisia in order to develop a model for explaining the influence of self-image congruence, attitude and satisfaction on purchase intention at supermarkets. The study comprised 363 consumers, and they tested three relationships: self-image/attitude, attitude/satisfaction and satisfaction/purchase intention. The hypothesis that satisfaction positively affects purchase intention was accepted, with a β of 0.4. Betancourt, Cortiñas, Elorz, and Mugica (2007)observed the influence of satisfaction on purchase intention in Spanish supermarkets. They carried out the study in 11 supermarkets, with 874 participants. Once again, the positive relationship between satisfaction and purchase intention was confirmed, and satisfaction predicted 21 percent of intention variability.
Several studies also investigated the relationship between store image and purchase intention. Each of them characterized the store image differently; that is, the attributes considered varied in each study. Faryabi, Sadeghzadeh, and Saed (2012) studied the relationship between store image and purchase intention for mobile phones on the internet. The store is online, so it is represented by the atmosphere and convenience of the website. The result showed a positive and direct relationship between store image and purchase intention. Betancourt, Cortinãs, Elorz, and Mugica (2007) investigated the relationship between satisfaction and distribution services on purchase intention in Spanish supermarkets. Store image attributes, local access (β=0.17) and environment (β=0.19) positively influenced purchase intention.
Some studies addressed the relationship between I-C and purchase intention. Moon, Chadee, and Tikoo (2008) investigated the influence of culture on purchase intention of customized products online (computers, sunglasses and jeans), and the relationship was higher for consumers of individualist countries. Frost, Goode, and Hart (2010) explored how much individualist consumers exhibited different levels of loyalty and purchase intention online. E-commerce buyers are more individualist than those who have never bought online. Similarly, Kahttab, Al-Manasra, Zaid, and Qutaishat (2012) investigated the relationship between I-C and online purchase intention. Collectivists showed a lower online purchase intention than individualists. Zhang, Lu, Shi, Tang, and Zhao (2012) explored the influence of mood, social presence and cultural orientation on online purchase intention. The result suggested that individualism positively affects online purchase intention.
Several studies have shown the positive relationship between the evaluation of store image and consumer satisfaction. Helgesen and Nesset (2010) tested the influence of supermarkets’ store image on consumer satisfaction. Price, fruits and vegetables, store location, service and ease of finding products were some of the attributes of store image confirmed as satisfaction predictors. Martínez-Ruiz, Jiménez-Zarco, and Izquierdo-Yusta (2010) carried out a study in Spain in which they defined store image according to three factors: convenience and service, quality image and purchase economic value. The first two affected consumer satisfaction, but convenience and service had a larger weight in the explanation. Martínez-Ruiz, Jiménez-Zarco, and Cascio (2011) extended the research to the USA and achieved the same results as the study carried out in 2010. Watanabe, Lima, and Torres (2013) investigated the effect of store image attributes on consumer satisfaction in Brazilian supermarkets. The attributes tested as satisfaction predictors were: price, promotion, employees, environment, convenience and product. The significant attributes that explained satisfaction were price, employees and product, and the first had the largest weight.
The relationship between individualism/collectivism and store image has already been studied outside the supermarket environment. Seock and Lin (2011) analyzed the influence of culture on the relative importance of a clothing store image. They applied questionnaires in the USA and Taiwan. Collectivism positively influenced the evaluation of the attributes “employee response,” “product variety,” “store atmosphere” and “service delivery,” and collectivists gave more importance to the attributes “consumer care” and “convenience,” compared to individuals from individualist cultures. Torres and Allen (2009) conducted two studies: one involving the choice of automobiles and the other the choice of a tourist destination, in Brazil and Australia. In the decision-making process for the automobile and tourist destination, for Australians, who are more individualist, the cultural dimension affected the consumption behavior toward the car and the tourist destination through attributes; that is, I-C influenced the evaluation of the tangible attributes, which, in turn, affected consumer behavior. This shows that, at least at the individual level of analysis, I-C can affect the evaluation of the attributes of products and services.
Regarding the evaluation of store image, many studies still present a lack of consensus; that is, they are inconclusive. For example, Furrer, Liu, and Sudharshan (2000) observed that individualism is positively related to the tangible aspects of the service, but Atum (2008)proved that both collectivism and individualism are positively related to tangibility.
Considering the relationships identified in the above-mentioned studies and the research objective, Figure 1 presents the research model.
3. Method
The research was conducted through a quantitative survey, in two supermarket chains (Chain A and Chain B) in two Brazilian cities: Brasília (Federal District) and Itumbiara (Goiás). Although both cities are located in the Midwest region of the country, there is evidence (Hofstede, Hilal, Malvezzi, Tanure, & Vinken, 2010) suggesting that Brasília is closer to the southeast states in terms of individualism, while Goiás is more collectivist. This would make the Midwest a borderline region in terms of I-C within the national context (Hofstede, Hofstede, & Minkov, 2010; Hofstede, Hilal, Malvezzi, Tanure, & Vinken, 2010, p. 348). It is important to remember that we investigated I-C at the individual level of analysis, as proposed by Triandis, Chen, and Chan (1995), who suggests that, depending on the situation, individuals present different percentages of each cultural pattern (I-C × V-H). Respondents were consumers of supermarkets who attended one of the stores at least once a month. We chose a non-probabilistic sampling (convenience sampling) with 443 respondents; 205 from Chain A and 238 from Chain B. Chain A is regional and has five stores, while Chain B is one of the brands of a large international retail chain.
The sample size followed Cohen’s (1992) guidelines regarding the use of statistical power analysis. Considering a statistical power of 0.8, mean effect of 0.25 and significance of 0.05, the minimum sample estimated a priori was 120 individuals. In this study, we reached a sample of 443 questionnaires, of which 397 were valid, which meets the criteria required for the analysis. Thus, the post hoc analysis of statistical power for the sample of 397 consumers attained 0.99, which is considered satisfactory (Cohen, 1977; Sedlmeier & Gigerenzer, 1989).
In order to apply the questionnaires, we made contact with one of the owners of Chain A and with the marketing manager of Chain B. After their acceptance, we began data collection, first at Chain A and then at Chain B. We approached the respondents at the queue and after leaving the front-end cashiers. Those who accepted to take part in the survey received the questionnaire and answered it. We used the self-fulfillment strategy to mitigate potential social desirability bias.
The research instrument comprised five scales. The first one measured purchase intention and was adapted from Yoo, Donthu, and Lenartowicz (2001) and Kuo, Wu, and Deng (2009). The first instrument was validated in Brazil by Garcia and Santos (2011), and showed discriminant validity and reliability index of 0.89. We only used one item of Kuo, Wu, and Deng (2009) scale, regarding the supermarket recommendation to friends and family. The scale had four items: first, it is likely that I will buy again at this supermarket; second, I will definitely buy again at this supermarket; third, I will recommend this supermarket to my friends and family; and fourth, I intend to buy at this supermarket in the near future.
To measure satisfaction, respondents were asked to show agreement on a Likert scale with the following items: how satisfied they were with the supermarkets they attended; how these supermarkets met their expectations; and how close was the supermarket to their ideal (Fornell, 1992).
The store image was measured by the scale that Diallo (2012) developed and validated in Brazil. The identified dimensions, store layout, product and service, presented Cronbach’s α of 0.96, 0.95 and 0.97, respectively. The first dimension was measured by three items: “Store facilities are attractive”; “The store layout is clear”; “It is easy to find items on offer at this store.” The “product” dimension comprised the following items: “Products are available when I need”; “The store offers high quality products; “The store offers a wide variety of products.” Finally, the “service” dimension also had three items: “Employees answer appropriately to questions asked”; “Employees are courteous”; “Employees are willing to find customized solutions.” It was also a metric and Likert scale.
For measuring I-C, we used the instrument developed by Triandis, Chen, and Chan (1998), composed of 16 scenarios. These authors began their study with focus groups of students. This first procedure resulted in 50 scenarios, comprised by social, economic, political, philosophical, religious and aesthetic situations. After several qualitative and quantitative procedures, 16 scenarios remained.
For each of the 16 scenarios presented, respondents had to choose an alternative. Each one represented a cultural dimension and its respective variations: vertical individualism, horizontal individualism, vertical collectivism and horizontal collectivism, in a matrix of 2 (I-C) × 2 (V-H). For example, the first scenario read as follows: “You and your friends decided to go out for dinner at a restaurant. How would you deal with the check?” Respondents had to choose the following alternatives: split it equally, regardless of who asked for what (corresponds to horizontal collectivism); split it according to what each one earns (vertical individualism); the group leader pays the bill or decides to split it (vertical collectivism); they calculate what each person pays, according to what he/she ordered (horizontal individualism). Respondents should choose the alternative that best represented their behavior in view of that scenario.
For the operationalization of variables, each individual got a score from 1 to 16, and this value meant the number of responses that corresponded to individualism. In the analyses, the distinction between vertical and horizontal dimensions was not considered. For example, if respondent 1 scored 6 for individualism, this means that of the 16 scenarios presented, he/she chose 6 alternatives corresponding to individualism. This instrument was submitted to reverse translation in order to adapt it to Portuguese, following Brislin’s (1970) instructions.
We started data processing after checking the correct filling of the questionnaires, according to Tabachnick and Fidell’s (2007) guidelines. In this stage, we identified 36 missing cases that were discarded from the research. Data were submitted to the analysis of multivariate extreme cases, through Mahalanobis Distance. Ten observations were withdrawn in the analysis, reaching the 397 valid questionnaires, of which 187 were from Chain A and 210 from Chain B. We analyzed data normality by Kolmogorov–Smirnov test, and it was not confirmed. In this case, literature suggests the use of the maximum likelihood (ML) estimation method and bootstrap (Marôco, 2011), which we did.
We carried out data analysis by using structural equations modeling (SEM). First, the confirmatory factorial analysis (CFA) was carried out with the constructs shop image, satisfaction and purchase intention. Next, we evaluated the relationships between the latent variables, as proposed by the research model.
We adopted the individual level of analysis. Surveys that use I-C use either the national level or the individual level of analysis (Chelminski & Coulter, 2007). Researchers who measure I-C at the individual level recognize that individuals within a given society (e.g. individualist) are more likely to be individualist, but they consider that there is variability in I-C at the individual level (Triandis, 1995). According to McCoy, Galletta, and King (2005), the researcher cannot assume that the individual characteristics of a country are the same as those of its individuals.
4. Results
The first stage of the analysis was descriptive, and included the calculation of mean, median, mode and standard deviation. Table I shows the results.
Among the variables of consumer behavior, items PROD2 and INT1 had the highest means, 4.23 and 4.40, respectively. The first item refers to the supply of high quality products and the second to the likelihood of the consumer returning to the store. The median and mode of most items was 4, and standard deviation ranged from 0.65 (INT1) to 1.06 (SATIS3). Regarding I-C, which varied from 1 to 16, it was changed into an observed variable. The mean of the responses related to individualism was 7.93, and the median and mode were 8.
Next, considering the 397 valid cases, we did the CFA with the constructs store image, consumer satisfaction and purchase intention. These latent variables were inserted into a single measurement model. The method used to estimate the measurement model was the ML estimation, which is the most used in CFA. The ML basic assumptions are: large sample size; continuous variables; and multivariate normal distribution of data (Brown, 2006). We used ordinal scales: Likert and one that ranged from 1 to 16. Even so, according to Byrne (2010), they can be considered continuous.
We notice, in Table II, that all observed variables of the measurement model were significant (p<0.01). In addition, all critical reasons (CR) were above |1.96|.
The next stage was to check the model’s adjustment measures. The indices were adequate: GFI=0.91; CFI=0.92; TLI=0.91; RMSEA=0.07; and SRMR=0.05. Therefore, the measurement model was confirmed. It has six latent variables, one of second order (store image), and 16 observable variables.
Then, we checked the convergent validity of the constructs. Table II shows that most items presented the standardized regression estimate above 0.5, as recommended by Hair, Black, Babin, Anderson, and Tatham (2009). In addition, we analyzed factor reliability by Jöreskog’s ρ. According to Chin (1998), it is a reliability measure better than Cronbach’s α for SEM, because it is based on factor loads and not on the observed correlations among variables. The second order factor store image showed a ρ of 0.77, the satisfaction factor of 0.86 and the purchase intention factor of 0.83. The indices should be higher than 0.7 (Chin, 1998). Hence, we confirmed the convergent validity of the latent variables.
To check discriminant validity, we analyzed if the estimated value of the variance extracted from each factor exceeded the squared correlation among them, according to Fornell–Larcker’s criterion. The discriminant validity was confirmed, as shown in Table III.
The following step was to test all the relationships proposed by the research model of Figure 1. Therefore, variable I-C was introduced in the model as an observable variable. Figure 2shows the significant relationships.
All relationships were significant at p<0.01. Considering I-C, only its relationship with store image evaluation was confirmed. The model fit was checked, and all indices were appropriate: GFI=0.91; CFI=0.93; TLI=0.91; RMSEA=0.06; and SRMR=0.05. Through the R² of each dependent variable, 53 percent of the variability of purchase intention was explained by consumer satisfaction, 64 percent of the variability of satisfaction was explained by store image, and, finally, only 2 percent of the variability of store image was explained by I-C.
The results show that store image affects consumer satisfaction (β=0.8); and, in turn, satisfaction affects purchase intention (β=0.73). The relationship between store image and purchase intention was not confirmed. Thus, we tested a mediating relationship between these variables, where the mediating variable was satisfaction. Theoretically, the test makes all sense, since studies show that store image and satisfaction positively influence purchase intention (Betancourt, Cortinãs, Elorz, & Mugica, 2007; Yang & Chang, 2011).
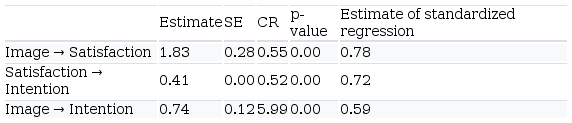
First, we checked three direct relationships: store image and satisfaction; satisfaction and purchase intention; and store image and purchase intention. All relationships were significant and are shown in Table IV.
Then, we calculated the direct and indirect effects between store image and purchase intention. Total mediation was proven; that is, when satisfaction is inserted in the relationship between store image and purchase intention, the relationship becomes weak and not significant. And when satisfaction is not considered, the relationship is strong and significant. The indirect effect of store image on purchase intention was 0.49 (p<0.01). This shows that store image positively affects purchase intention in supermarkets.
5. Discussion
The direct relationships between store image and satisfaction, and between satisfaction and purchase intention were confirmed. These two relationships were high and significant (p<0.01), with β values of 0.78 and 0.64, respectively. This result confirms studies in the field of consumer behavior. Noyan and Simsek (2011) showed that store image accounted for 31.8 percent of the variability of consumer satisfaction at supermarkets in Thailand. In their study, store image was composed by a single dimension made up by items related to service, store atmosphere, loyalty programs and service offered by the supermarket. Roy, Bhattacharya, and Sengupta (2011) showed that store image explained 45 percent of the variability of consumer satisfaction. In their study, image comprised physical structure, service reliability and employees’ competence and courtesy. Finally, Ali, Kim, and Ryu (2016)specifically investigated the influence of an airport’s physical environment on passengers’ satisfaction, and a positive relationship was confirmed. Our study supports their research, since the layout of supermarkets, a component of store image, also affected satisfaction.
Ibrahim and Najjar (2007) reached the same result as we did: satisfaction positively influenced purchase intention in a supermarket. They studied the supermarket Carrefour located in Tunisia, and the ratio β was 0.4. Yang and Chang (2011) compared the relationship between service experience, money value, emotional response and satisfaction, as well as purchase intention, at department stores and at supermarkets. To pursue such goal, they collected 600 questionnaires and carried out a SEM. The results showed that, both in the department store and in the supermarket, consumer satisfaction positively influenced purchase intention. Hsu, Chen, Kikuchi, and Machida (2017) addressed an online service and the result was the same as ours: satisfaction positively affected consumers’ purchase intention. However, Kim’s (2015) research suggests that purchase intention is independent of consumer satisfaction in low-cost airline companies. One possible explanation is that the low price is the primary motivation of consumers for buying air tickets from these companies.
The results also showed that the more individualist is the consumer, the worse will be his/her evaluation of the store image, and the more collectivist he/she is, the better will be the evaluation. However, the prediction percentage was only 2 percent. Some studies specifically address the influence of I-C on the assessment of store layout, product and service, and support our results. We also discuss them below.
Our findings are in line with the studies by Seock and Lin (2011) and Dash, Bruning, and Acharya (2009). The first study proved the positive relationship between collectivism and the attributes “employee’s response,” “consumer care,” “product” and “store atmosphere.” The study by Dash, Bruning, and Acharya (2009), whose objective was to investigate the relationship between national culture and expectations regarding banking services, showed that individualist consumers, compared to collectivists, care less about the perceived quality of the service, which includes tangibility, trust, receptivity, compliance and employees’ empathy. And the more individualist, the less importance they give to empathy, compliance and receptivity. Empathy refers to the individualized attention given to the consumer, compliance is the ability to deliver the promised service, and receptivity regards the willingness to help consumers.
The relationship between individualism and purchase intention was not significant. One possible explanation could be the type of retail. Existing studies (Frost, Goode, & Hart, 2010; Kahttab, Al-Manasra, Zaid, & Qutaishat, 2012; Zhang, Lu, Shi, Tang, & Zhao, 2012) confirm the relationship between individualism and purchase intention only for other online services.
At last, the positive relationship between store image and purchase intention had already been identified in other surveys. Betancourt, Cortinãs, Elorz, and Mugica (2007) observed that store image, made up of accessibility to the place and the store environment, explains 7 percent of purchase intention at supermarkets in Spain. Erdil (2015) investigated, among other relationships, the influence of store image evaluation of a clothing service on consumers’ purchase intention; the identified relationship was significant and positive, with a β of 0.51.
6. Conclusions
The research objective was to analyze the influence of culture, in terms of I-C, the evaluation of store image, and consumer satisfaction, on the purchase intention of supermarket consumers. In addition, we also wanted to identify the relationship between store image evaluation and satisfaction, and between I-C and the evaluation of store image. Store image and satisfaction positively affected the purchase intention of the surveyed supermarket consumers. However, the cultural dimension had no effect on purchase intention.
Individualism negatively affected the evaluation of store image by consumers, and collectivism influenced it positively. We highlight that the prediction percentage was low (2 percent). These results showed that I-C is not a strong predictor of the independent variables tested herein. These findings have theoretical implications, also mentioned by Valadão, Medeiros, and Guedes (2007): due to Brazil’s large size, the investigation of regional cultural dimensions may reach different results. Torres, Porto, Vargas, and Fischer (2015) observed the presence of systematic differences in the hierarchy of values adopted by different participants coming from all the country’s five regions, which can explain low or even absent predictions if researchers do not use intercultural samples, thus increasing the expected variability (Hofstede, Hofstede, & Minkov, 2010; Hofstede, Hilal, Malvezzi, Tanure, & Vinken, 2010). Finally, store image evaluation positively affects consumer satisfaction.
Our results contribute to advance discussions on the predictors of purchase intention in supermarkets. In addition, we built and empirically tested a structural model that encompasses the various relationships between three dimensions of consumer behavior and a cultural variable. Besides, our findings may pave the way for future studies that confirm that IC may not be a good predictor of purchase intention, neither of the evaluation of store image; or that it may not be appropriate to relate to geographic entities, like nations, to culture, since by doing this, we end up ignoring the cultural diversity found at the national level. Iliste (2017) suggests that managerial decisions, including those related to potential consumers, should take into account such intra-cultural differences. This suggestion is shared by Bergiel, Bergiel, and Upson (2012), who advocate an increase of similarities in management decisions among cultures with strong international links. For Porras and Robertson (1992), there are larger intra-cultural than intercultural variations, and propose a research agenda for the organizational context that takes into consideration the intra-cultural diversity of nations.
As for managerial contributions, the study identified: the way customers evaluate the supermarket with regard to service, available products and store layout; and which variables affect consumers’ satisfaction and purchase intention. Therefore, in order to increase satisfaction and purchase intention, it is necessary to prioritize the attributes related to service and to the variety and quality of products. Even if the supermarket is considered a self-service, consumers appreciate educated employees who are willing to help and know well the place they work at. These elements are important for the supermarket manager, since they enable the identification of elements that need improvement and the creation of strategies that deliver more value to consumers. Regarding I-C, we found evidence that managers do not need to worry about this element, since I-C does not affect consumers’ purchase intention.
Despite careful planning, this study has some limitations: two of them are the convenience sampling and the omission of vertical and horizontal variations of I-C in data analysis. Another limitation concerns the operationalization of the scale that measures I-C, proposed by Triandis, Chen, and Chan (1998). For each proposed scenario, the consumer should indicate the response that was closer to his behavior in a given situation. We used this simplification because we worked with multiple choice questions. Thus, the scale could not be validated, since it was transformed into a single observed variable.
With regard to a research agenda, we suggest the adoption of a probabilistic sample. In addition, the relationships addressed, especially those related to I-C and consumer behavior dimensions, can be investigated in other contexts, including studies with different types of services and with consumers from other locations in the country, in order to approach intra-cultural issues. Taking into account the relationship between store image, purchase intention and satisfaction, future studies could adopt experimental designs by manipulating aspects related to store image, and check their impact on consumer satisfaction and purchase intention.
Another suggestion is to include the vertical and horizontal variations of I-C in future research, as well as to use the scenarios scale proposed by Triandis, Chen, and Chan (1998), with a change to make the construct operationalization simpler (e.g. a Likert scale for each scenario response option, rather than multiple choice). Thus, for each variation of I-C, a person would indicate his/her degree of agreement with each of them. This would enable the validation of the instrument.
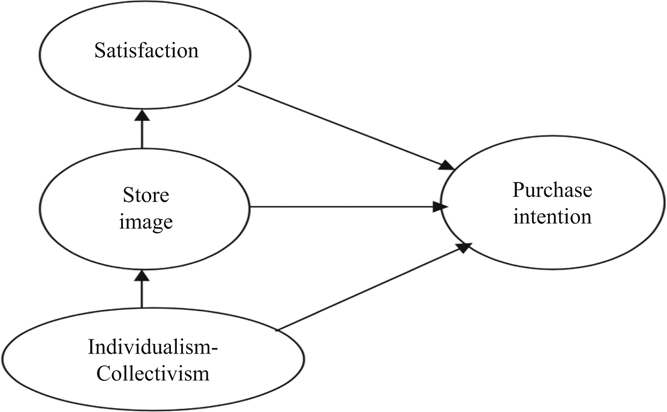 Figure 1
Research model
Figure 1
Research model
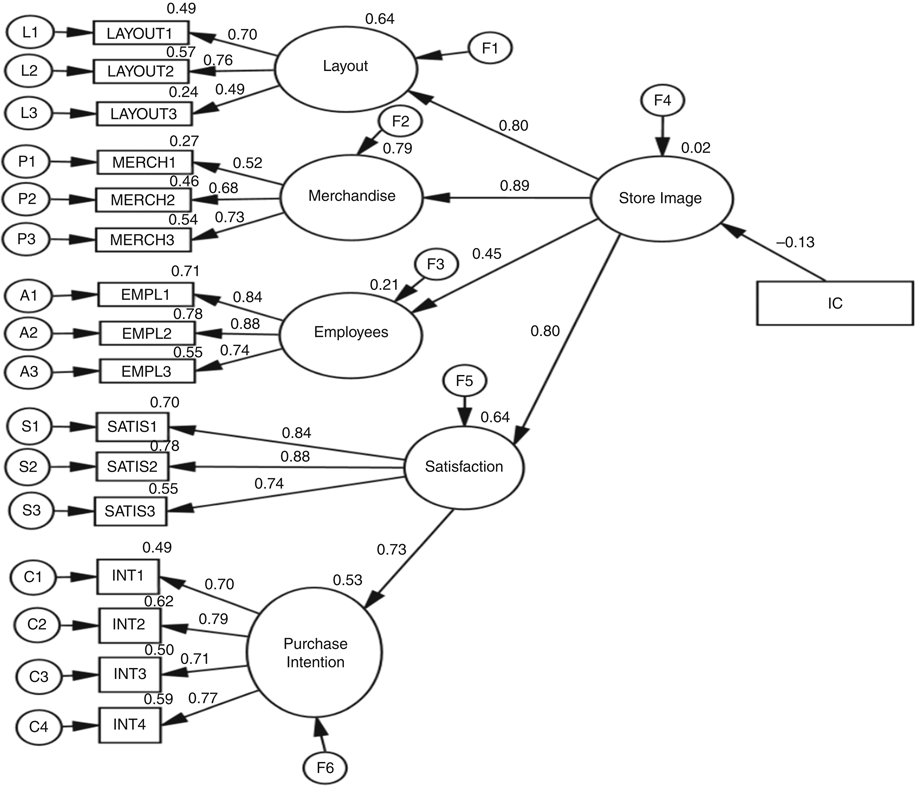 Figure 2
Structural equations modeling
Figure 2
Structural equations modeling
Table I
Descriptive
statistics analysis

|
Construct
|
Variable
|
Mean
|
Median
|
Mode
|
SD
|
|
Satisfaction
|
SATIS1
|
3.86
|
4
|
4
|
0.92
|
|
SATIS2
|
3.79
|
4
|
4
|
0.93
|
|
SATIS3
|
3.26
|
3
|
3
|
1.06
|
|
Layout
|
LAYOUT1
|
4.00
|
4
|
4
|
0.79
|
|
LAYOUT2
|
3.97
|
4
|
4
|
0.80
|
|
LAYOUT3
|
3.52
|
4
|
4
|
1.02
|
|
Product
|
PROD1
|
3.70
|
4
|
4
|
0.91
|
|
PROD2
|
4.23
|
4
|
4
|
0.74
|
|
PROD3
|
3.98
|
4
|
4
|
0.90
|
|
Service
|
SERV1
|
3.67
|
4
|
4
|
0.99
|
|
SERV2
|
3.70
|
4
|
4
|
0.96
|
|
SERV3
|
3.47
|
4
|
3
|
1.00
|
|
Purchase
intention
|
INT1
|
4.40
|
4
|
5
|
0.65
|
|
INT2
|
4.11
|
4
|
4
|
0.8
|
|
INT3
|
3.70
|
4
|
4
|
0.95
|
|
INT4
|
4.08
|
4
|
4
|
0.79
|
|
Individualism/collectivism
| |
7.93
|
8
|
8
|
1.94
|
Table II
Estimation
of the confirmatory factorial analysis
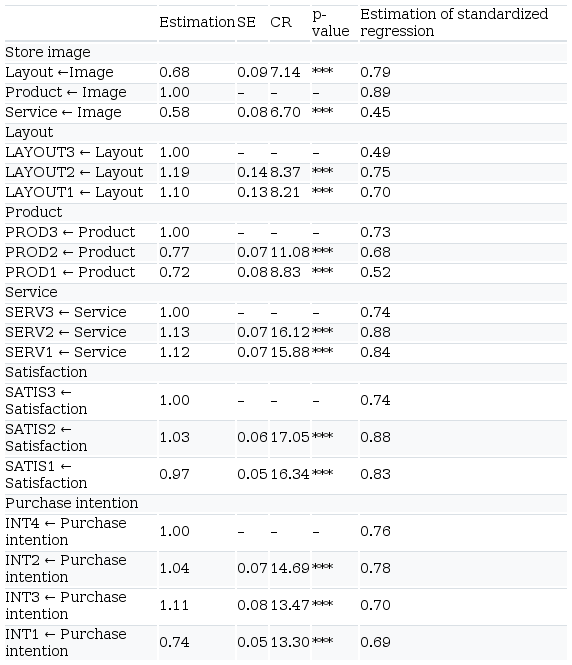 Note ***p<0.01
|
Estimation
|
SE
|
CR
|
p-value
|
Estimation of standardized regression
|
|
Store
image
|
|
Layout
←Image
|
0.68
|
0.09
|
7.14
|
***
|
0.79
|
|
Product
← Image
|
1.00
|
–
|
–
|
–
|
0.89
|
|
Service
← Image
|
0.58
|
0.08
|
6.70
|
***
|
0.45
|
|
Layout
|
|
LAYOUT3
← Layout
|
1.00
|
–
|
–
|
–
|
0.49
|
|
LAYOUT2
← Layout
|
1.19
|
0.14
|
8.37
|
***
|
0.75
|
|
LAYOUT1
← Layout
|
1.10
|
0.13
|
8.21
|
***
|
0.70
|
|
Product
|
|
PROD3 ←
Product
|
1.00
|
–
|
–
|
–
|
0.73
|
|
PROD2 ←
Product
|
0.77
|
0.07
|
11.08
|
***
|
0.68
|
|
PROD1 ←
Product
|
0.72
|
0.08
|
8.83
|
***
|
0.52
|
|
Service
|
|
SERV3 ←
Service
|
1.00
|
–
|
–
|
–
|
0.74
|
|
SERV2 ←
Service
|
1.13
|
0.07
|
16.12
|
***
|
0.88
|
|
SERV1 ←
Service
|
1.12
|
0.07
|
15.88
|
***
|
0.84
|
|
Satisfaction
|
|
SATIS3
← Satisfaction
|
1.00
|
–
|
–
|
–
|
0.74
|
|
SATIS2
← Satisfaction
|
1.03
|
0.06
|
17.05
|
***
|
0.88
|
|
SATIS1
← Satisfaction
|
0.97
|
0.05
|
16.34
|
***
|
0.83
|
|
Purchase
intention
|
|
INT4 ←
Purchase intention
|
1.00
|
–
|
–
|
–
|
0.76
|
|
INT2 ←
Purchase intention
|
1.04
|
0.07
|
14.69
|
***
|
0.78
|
|
INT3 ←
Purchase intention
|
1.11
|
0.08
|
13.47
|
***
|
0.70
|
|
INT1 ←
Purchase intention
|
0.74
|
0.05
|
13.30
|
***
|
0.69
|
Table III
Discriminant
validity
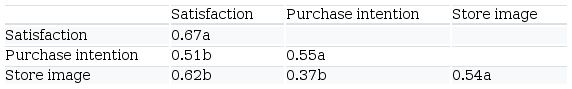 Notes aVariance extracted; bsquared correlations
|
Satisfaction
|
Purchase intention
|
Store image
|
|
Satisfaction
|
0.67a
| | |
|
Purchase
intention
|
0.51b
|
0.55a
| |
|
Store
image
|
0.62b
|
0.37b
|
0.54a
|
Table IV
Relationships
between store image, satisfaction and purchase intention
|
Estimate
|
SE
|
CR
|
p-value
|
Estimate of standardized regression
|
|
Image →
Satisfaction
|
1.83
|
0.28
|
0.55
|
0.00
|
0.78
|
|
Satisfaction
→ Intention
|
0.41
|
0.00
|
0.52
|
0.00
|
0.72
|
|
Image →
Intention
|
0.74
|
0.12
|
5.99
|
0.00
|
0.59
|
References
Alfinito, S., & Torres, C. V. (2012). Modelo de influência cultural no consumo: uma proposta baseada em axiomas sociais. Revista de Administração Mackenzie, 3(5), 15–38.
Ali, F., Kim, W. G., & Ryu, K. (2016). The effect of physical environment on passenger delight and satisfaction: Moderating effect of national identity. Tourism Management, 57, 213–224.
Amorim, M., Lago, A., Moscoso, P., & Prieto, E. (2016). Assisted vs. self-checkout in retail: An empirical analysis of the impact of operational process dimensions on customer satisfaction, recommendation and reuse. Journal of Service Science Research, 8(1), 1–39.
Atum, G. (2008). The influence of individual cultural value orientation on the evaluation of a retail store environment. master thesis in Administration, University of Pretoria, Pretoria.
Bergiel, E. B., Bergiel, B., & Upson, G. J. W. (2012). Revisiting Hofstede’s dimensions: Examining the cultural convergence of the United States and Japan. American Journal of Management, 12(1), 69–79.
Betancourt, R. R., Cortinãs, M., Elorz, M., & Mugica, J. M. (2007). The demand for and the supply of distribution services: A basis for the analysis of customer satisfaction in retailing. Quantitative Marketing and Economics, 5(3), 293–312.
Bloemer, J., & De Ruyter, K. (1998). On the relationship between store image, store satisfaction and store loyalty. European Journal of Marketing, 32(5/6), 499–513.
Bloemer, J. M. M., & Odekerken-Schröder, G. J. (2002). Store satisfaction and store loyalty explained by customer-and store-related factors. Journal of Consumer Satisfaction/Dissatisfaction and Complaining Behaviour, 15(1), 68–80.
Brislin, R. W. (1970). Back-translation for cross-cultural research. Journal of Cross-Cultural Psychology, 1(3), 185–216.
Brown, T. A. (2006), Confirmatory Factor Analysis for Applied Research, Guildford, New York, NY.
Byrne, B. M. (2010), Structural Equation Modeling with Amos: Basic Concepts, Applications, and Programming, Routledge, Ontario.
Chelminski, P., & Coulter, R. A. (2007). On market mavens and consumer self-confidence: A cross cultural study. Psychology & Marketing, 24(1), 69–91.
Chin, W. W. (1998). The partial least squares approach to structural equation modeling. Modern Methods for Business Research, 8(2), 295–336.
Cohen, J. (1977), Statistical Power Analysis for the Behavioral Sciences, Academic Press, New York, NY.
Cohen, J. (1992). Quantitative methods in psychology: A power primer. Psychological Bulletin, 112(1), 155–159.
Cronin, J. J., Brady, M. K., & Hult, C. T. M. (2000). Assessing the effects of quality, value, and customer satisfaction on consumer behavioral intentions in service environments. Journal of Retailing, 76(2), 193–218.
Cunha, C. F., Spers, E. E., & Zylbersztajn, D. (2011). Percepção sobre atributos de sustentabilidade em um varejo supermercadista. Rae, 51(6), 542–552.
Dash, S., Bruning, E., & Acharya, M. (2009). The effect of power distance and individualism on service quality expectations in banking: A two-country individual- and national-cultural comparison. International Journal of Bank, 27(5), 336–358.
Devlin, D., Birtwistle, G., & Macedo, N. (2003). Food retail positioning strategy: A means-end chain analysis. British Food Journal, 105(9), 653–667.
Diallo, M. F. (2012). Effects of store image and store brand price-image on store brand purchase intention: Application to an emerging market. Journal of Retailing and Consumer Services, 19(3), 360–367.
Erdil, T. S. (2015). Effects of customer brand perceptions on store image and purchase intention: An application in apparel clothing. Procedia, 207(20), 196–205.
Evanschitzky, H., Emrich, O., Sangtani, V., Ackfeldt, A. L., Reynolds, K. E., & Arnold, M. J. (2014). Hedonic shopping motivations in collectivistic and individualistic consumer cultures. International Journal of Research in Marketing, 31(3), 335–338.
Faryabi, M., Sadeghzadeh, K., & Saed, M. (2012). The effect of price discounts and store image on consumer’s purchase intention on online shopping context casa study: Nokia e HTC. Journal of Business Studies Quarterly, 4(1), 197–205.
Fornell, C. (1992). A national customer satisfaction barometer: The Swedish experience. Journal of Marketing, 56(1), 6–21.
Frank, B., Enkawa, T., & Schvaneveldt, S. J. (2015). The role of individualism vs. collectivism in the formation of repurchase intent: A cross-industry comparison of the effects of cultural and personal values. Journal of Economics Psychology, 51, 261–278.
Frost, D., Goode, S., & Hart, D. (2010). Individualist and collectivist factors affecting online repurchase intentions. Internet Research, 20(1), 6–28.
Furrer, O., Liu, B. S., & Sudharshan, D. (2000). The relationship between culture and service quality perceptions: Basis for cross-cultural market segmentation and resource allocation. Journal of Service Research, 2(4), 355–371.
Garcia, G. M., & Santos, C. P. (2011). O impacto das características pessoais na intenção de compra pela internet e o papel da mediação da familiaridade e da atitude ante a compra pela internet. Revista de Administração da Mackenzie, 12(5), 151–181.
Ha, H., Akamavi, R. K., Kitchen, P. J., & Fanda, S. (2014). Exploring key antecedents of purchase intentions within different services. Journal of Services Marketing, 28(7), 595–606.
Hair, J. F. Jr, Black, W. C., Babin, B. J., Anderson, R. E., & Tatham, R. L. (2009), Análise Multivariada de Dados, 6a ed., Bookman, Porto Alegre.
Hansen, R. A., & Deutscher, T. (1977–1978). An empirical investigation of attribute importance in retail store selection. Journal of Retailing, 53(4), 64–69.
Helgesen, O., & Nesset, E. (2010). Gender, store satisfaction and antecedents: A case study of a grocery store. Journal of Consumer Marketing, 27(2), 114–126.
Hofstede, G. (1980), Culture’s Consequences, Sage, Beverly Hills, CA.
Hofstede, G., & Bond, M. H. (1988). The Confucian connection: From cultural roots to economic growth. Organizational Dynamics, 16(4), 5–21.
Hofstede, G., Hilal, A. V. G., Malvezzi, S., Tanure, B., & Vinken, H. (2010). Comparing regional cultures within a country: Lessons from Brazil. Journal of Cross-Cultural Psychology, 41(3), 336–352, doi: 10.1177/0022022109359696
Hofstede, G., Hofstede, G. J., & Minkov, M. (2010), Software of the Mind, New York, NY: McGraw-Hill.
Howard, A. J., & Sheth, N. J. (1969), The Theory of Buyer Behavior, New York, NY: Wiley.
Hsu, C., Chen, M., Kikuchi, K., & Machida, I. (2017). Elucidating the determinants of purchase intention toward social shopping sites: A comparative study of Taiwan and Japan. Telematics and Informatics, 34(4), 326–338.
Ibrahim, H., & Najjar, F. (2007). Assessing the effects of self-congruity, attitudes and customer satisfaction on consumer behavioral intentions in retail environment. Marketing Intelligence & Planning, 26(2), 207–227.
Iliste, A. (2017). The personality dimension of idiocentrism-allocentrism among international students. master thesis presented to the Programme for Master of Science in Psychology, Umea Universitet, Umea.
Johnson, M. D., & Fornell, C. (1991). A framework for comparing customer satisfaction across individuals and product categories. Journal of Economic Psychology, 12(2), 267–286.
Kahttab, S. A., Al-Manasra, E. A., Zaid, M. K. S. A., & Qutaishat, F. T. (2012). Individualist, collectivist and gender moderated differences toward online purchase intentions in Jordan. International Business Research, 5(8), 85–93.
Kim, Y. (2015). Assessing the effects of perceived value (utilitarian and hedonic) in LCCs and FSCs: Evidence from South Korea. Journal of Air Transport Management, 49, 17–22.
Kitapci, O., Dortyol, I. T., Yaman, Z., & Gulmez, M. (2013). The paths from service quality dimensions to customer loyalty. Management Research Review, 36(3), 239–255.
Koo, D. M. (2003). Inter-relationship among store images, stores satisfaction, and store loyalty among Korea discount retail patrons. Asia Pacific Journal of Marketing and Logistics, 15(4), 42–71.
Kuo, Y., Wu, C., & Deng, W. (2009). The relationship among service quality, perceived value, customer satisfaction, and post-purchase intention in mobile value-added services. Computers in Human Behavior, 25(4), 887–896.
Lee, D., Trail, G. T., Lee, C., & Shoenstedt, L. J. (2013). Exploring factors that affect purchase intention of athletic team merchandise. Journal of Research, 8(1), 40–48.
Lindquist, J. D. (1974–1975). Meaning of image Q survey of empirical and hypothetical evidence. Journal of Retailing, 50(4), 29–38.
McCoy, S., Galletta, D. F., & King, W. R. (2005). Integrating national culture into IS research: The need for current individual-level measures. Communications of the Association for Information Systems, 15(12), 211–224.
McGoldrick, P. J. (2002), Retail Marketing, Berkshire: McGraw-Hill.
Marôco, J. (2011), “Análise estatística com o SPSS Statistics”, Report Number, Pêro Pinheiro.
Martineau, P. (1958). The personality of retail store. Harvard Business Review, 36(1), 47–55.
Martínez-Ruiz, M. P., Jiménez-Zarco, A. I., & Cascio, R. (2011). Assessing the maximum level of customer satisfaction in grocery stores: A comparison between Spain and the USA. International Journal of Retail & Distribution Management, 39(7), 504–521.
Martínez-Ruiz, M. P., Jiménez-Zarco, A. I., & Izquierdo-Yusta, A. (2010). Customer satisfaction’s key factors in Spanish grocery stores: Evidence from hypermarkets and supermarkets. Journal of Retailing and Consumer Service, 11(4), 278–285.
Minkov, M. (2007), What Makes us Different and Similar: a New Interpretation of the World Values Survey and Other Cross-cultural Data?, Sofia: Klasika y Stil Publishing House.
Minkov, M., & Hofstede, G. (2014). Clustering of 316 European regions on measures of values: Do Europe’s countries have national cultures?. Cross-Cultural Research, 48(2), 144–176.
Moon, J., Chadee, D., & Tikoo, S. (2008). Culture, product type, and price influences on consumer purchase intention to buy personalized products online. Journal of Business Research, 61(1), 31–39.
Morschett, D., Swoboda, B., & Foscht, T. (2005). Perception of store attributes and overall attitude towards grocery retailers: The role of shopping motives. International Review of Retail Distribution and Consumer Research, 15(4), 423–447.
Noyan, F., & Simsek, G. G. (2011). Structural determinants of customer satisfaction in loyalty models: Turkish retail supermarkets. Social and Behavior Sciences, 30, 2134–2138.
Oliver, J. D., & Lee, S. (2010). Hybrid car purchase intentions: A cross-cultural analysis. Journal of Consumer Marketing, 27(2), 96–103.
Oliver, R. L. (1980). A cognitive model of the antecedents and consequences of satisfaction decisions. Journal of Marketing Research, 17(4), 460–469.
Oliver, R. L. (1981). Measurement and evaluation of satisfaction process in retail setting. Journal of Retailing, 57(3), 25–48.
Oyserman, D. (2017). Culture three ways: Culture and subcultures within countries. Annual Review of Psychology, 68, 435–463.
Porras, J. I., & Robertson, P. J. (1992), “Organizational development: theory, practice and research”, in Dunnette, M. D., & Hough, L. M. (Eds), Handbook of Industrial and Organizational Psychology, Consulting Psychologists Press, Palo Alto, CA, 719–822.
Rojo, F. J. G. (1998). Pesquisa: O comportamento do consumidor nos supermercados. Revista de Administração de Empresas, 38(3), 16–24.
Roy, R., Bhattacharya, A. K., & Sengupta, P. P. (2011). A comparative study of customer satisfaction between two Indian retail brands. Global Business Review, 12(2), 331–342.
Sedlmeier, P., & Gigerenzer, G. (1989). Do studies of statistical power have an effect on the power of studies?. Psychological Bulletin, 105(2), 309–316.
Seock, Y., & Lin, C. (2011). Cultural influence on loyalty tendency and evaluation of retail store attributes: An analysis of Taiwanese and American consumers. International Journal of Retail and Distribution Management, 39(2), 94–113.
Smith, P. B., & Schwartz, S. H. (1997), “Values”, In J. W., Berry, M. H., Segall, & C., Kagitçibasi(Eds), Handbook of Cross-cultural Psychology, Boston, MA: Allyn & Bacon.
Smith, P. B., Fischer, R., Vignoles, V. L., & Bond, M. H. (2013), Understanding Social Psychology Across Cultures: Engaging with Others in a Changing World (2nd ed.). London: Sage, pp. 77-118.
Tabachnick, B., & Fidell, L. S. (2007), Using Multivariate Statistics, San Francisco, CA: Allyn and Bacon.
Timmer, C. P. (2004). Food policy in the era of supermarkets: What’s different?. Journal of Agricultural and Development Economics, 1(2), 50–67.
Torres, C. V., Porto, J. B., Vargas, L. M., & Fischer, R. (2015). A Meta-analysis of basic human values in Brazil: Observed differences within the country. Revista Psicologia Organizações e Trabalho, 15(1), 89–102.
Torres, C. V., & Allen, M. W. (2009). Influência da cultura, dos valores humanos e do significado do produto na predição de consumo: síntese de dois estudos multiculturais na Austrália e no Brasil. Revista de Administração Mackenzie, 10(3), 127–152.
Triandis, H. C. (1994), “Cross-cultural industrial and organizational psychology”, In H. C., Triandis, M. D., Dunnete, & L. M., Hough (Eds), Handbook of Industrial and Organizational Psychology, Palo Alto, CA: Consulting Psychologists Press, pp. 103-172.
Triandis, H. C. (1995), Individualism and Collectivism, Boulder, CO: Westview Press.
Triandis, H. C., Chen, X. P., & Chan, D. K. S. (1998). Scenarios for the measurement of collectivism and individualism. Journal of Cross-Cultural Psychology, 29(2), 275–289.
Triandis, H. C., Chan, D. K. S., Bhawuk, D. P., Iwao, S., & Sinha, J. B. (1995). Multimethod probes of allocentrism and idiocentrism. International Journal of Psychology, 30(4), 461–480.
Tse, D. K., & Wilton, P. C. (1988). Models of consumer satisfaction: An extension. Journal of Marketing Research, 25(2), 204–212.
Valadão, V. M. Jr, Medeiros, C. R. O., & Guedes, R. R. (2007). A influência das dimensões culturais nacionais brasileiras na orientação dos líderes de uma instituição financeira. I Encontro de Gestão de Pessoas e Relações de Trabalho, Natal-RN. Available from: www.anpad.org.br/admin/pdf/ENGPR354.pdf (Acessado em Januray 26, 2019 em).
Walls, J. L., & Triandis, C. H. (2014). Universal truths: Can universally held cultural values inform the modern corporation?. Cross Cultural Management, 21(3), 345–356.
Watanabe, E. A. M., Lima-Filho, D. O., & Torres, C. V. (2013). Store image attributes and customer satisfaction in supermarkets in Campo Grande-MS. Revista Brasileira de Marketing, 12(4), 85–107.
Wu, P. C. S., Yeh, G. Y. Y., & Hsiao, C. R. (2011). The effect of store image and service quality on brand image purchase intention for private label brands. Australasian Marketing Journal, 19(1), 30–39.
Yang, H. W., & Chang, K. F. (2011). A comparison of service experience on repatronage intentions between department stores and hypermarkets in Taiwan. African Journal of Business Management, 5(19), 7818–7827.
Yildirim, Y., & Aydin, O. (2012). Investigation of the effects of discount announcements on consumer’s purchase decisions: A case study in supermarket. Procedia, 62(24), 1235–1244.
Yoo, B., Donthu, N., & Lenartowicz, T. (2001). Measuring cultural values: Development and validation of the CVSCALE. working paper, Georgia State University, Atlanta, GA.
Zeithaml, V., Berry, L., & Parasuraman, A. (1996). The behavioral consequences of service quality. Journal of Marketing, 60(2), 31–46.
Zhang, H., Lu, Y., Shi, X., Tang, Z., & Zhao, Z. (2012). Mood and social presence on consumer purchase behavior in C2C E-commerce in Chinese culture. Electronic Markets, 22(3), 143–154.
Zhang, S., Door, J. V., & Leeflang, P. S. H. (2014). Does the importance of value, brand and relationship equity for customer loyalty differ between Eastern and Western cultures?. International Business Review, 23(1), 284–292.