

Artigos
Value relevance of R&D expenses in capital market: a study of brazilian IT Sector companies
Value Relevance das despesas de P&D no mercado de capitais: Um estudo das empresas brasileiras do Setor de TI
Value relevance of R&D expenses in capital market: a study of brazilian IT Sector companies
RACE-Revista de Administração, Contabilidade e Economia, vol. 19, no. 1, 2020
Editora Unoesc
Received: 23 September 2019
Accepted: 10 March 2020
Abstract: Although R&D expenses be relevant to any company, the IT sector stands out in this way, since these companies make constant investments in these intangibles in order to develop solutions and systems for their clients, so, this study aimed to verify the relevance of R&D expenses for companies in the IT sector listed in B3 between 2010 and 2018. Regressions were performed by least absolute deviations considering the stock price as response variable and R&D expenses as explanatory variable. In addition, complementary analyzes were made using logistic regressions. It was always considered a confidence level of 95%. Our results show that R&D expenses explain the variation in stock prices, as expected. The positive sign indicates that investments in these intangibles increase the market value of IT companies, however, there are limits to these benefits. An interesting comparative is that, for the electric sector, target of the study of Alves, Silva, Macedo, and Marques (2011), R&D expenses did not indicate predictive power against stock prices. This confirms the relevance of this measure to the IT sector given its importance to the activities of these companies. Although there is a common sense of the relevance of R&D expenses for the IT sector, there was no literature that would provide such evidence in an empirical way. This research fills this gap and denotes greater relevance of the accounting information regarding R&D expenses for investors of B3 IT companies.
Keywords: R&D, Research and Development, Value Relevance, IT.
Resumo: Embora as despesas de P&D sejam relevantes para qualquer empresa, o setor de TI se destaca nesse sentido, uma vez que essas empresas fazem investimentos constantes em ativos intangíveis para desenvolver soluções e sistemas para seus clientes. Portanto, este estudo teve como objetivo verificar a relevância das despesas de P&D para empresas do setor de TI listadas na B3 entre 2010 e 2018. As regressões foram realizadas por desvios mínimos absolutos, considerando o preço das ações como variável de resposta e as despesas de P&D como variável explicativa. Além disso, análises complementares foram feitas usando regressões logísticas. Foi considerado sempre um nível de confiança de 95%. Os resultados mostram que as despesas de P&D explicam a variação nos preços das ações, conforme o esperado. O sinal positivo indica que os investimentos em intangíveis aumentam o valor de mercado das empresas de TI, no entanto, existem limites para esses benefícios. Um comparativo interessante é que, para o setor elétrico, alvo do estudo de Alves, Silva, Macedo, e Marques (2011), as despesas de P&D não indicaram poder preditivo com relação aos preços das ações. Isso confirma a relevância dessa medida para o setor de TI, dada a sua importância para as atividades dessas empresas. Embora exista um senso comum da relevância das despesas de P&D para o setor de TI, não havia literatura que fornecesse essas evidências de maneira empírica. Esta pesquisa preenche essa lacuna e denota maior relevância das informações contábeis referentes às despesas de P&D para investidores das empresas de TI da B3.
Palavras-chave: P&D, Pesquisa e Desenvolvimento, Value Relevance, TI.
1 INTRODUCTION
According to the Conceptual Framework for Financial Reporting Pronouncement (2010), for accounting information be considered useful, it must present two characteristics considered as fundamental: relevance and faithful representation. In dealing specifically with the relevance of accounting information, Alves et al. (2011) states that this has been the subject of numerous studies from different perspectives.
The studies of relevance of accounting information as a function of added value to listed companies, commonly called value relevance, were based on Beaver (1968) and Ball and Brown (1968). For Rezende (2005), after the 1960s, a great number of studies of this genre focused their objectives in the capital markets trying to understand the relationship between the accounting information disclosed by listed companies and their respective stock prices.
Crisóstomo and González (2006) reported that, in the economic scenario, the importance of intangible assets for companies was increasing with emphasis on Research and Development (R&D) spending given their capacity to create value. Wang, Lu, Huang, and Lee (2013) explain that this value creation occurs because R&D expenses are crucial for profitability and competitive advantage.
Although R&D expenses are considered by many authors as fundamental for any type of company, it should be pointed out that a particular sectorInformation Technology (IT)—has a special focus on this issue, since it seeks to develop solutions and systems for its clients, thus requiring a high index of constant investigations (Souza, Costa & Clemente, 2016).
Given this, the objective of this study was to verify the relevance of R&D expenses to companies listed in the Bolsa, Brasil, Balcão (B3) Information Technology (IT) sector. This work follows from the suggestion proposed by Alves et al. (2011) for new studies to verify the relevance of R&D expenses in capital markets, but in other sectors than electric energy, which was the target of their work.
In addition, the study by Alves et al. (2011) used observations dating from 2002 to 2009, that is, the values collected were not yet in accordance with the international standard of accounting practices established by the International Accounting Standard Board (IASB), which was mandatory only in 2010 by Brazilian companies.
The present study is limited to the IT companies listed in B3 between 2010 and the first quarter of 2018. Therefore, the suggestion proposed by Alves et al. (2011) is followed in this work being replaced by the sector observed, the chronological interval and the accounting standard of the disclosed information.
It wasn’t found any research in the present academic literature to verify the effects of R&D expenses on the capital market when dealing specifically with the IT sector, even with the importance of this item for such sector is presented in theory. It is on the basis of this gap and the relevance of R&D spending for IT companies that this work is justified. In sum, the contributions of this work are intended to corroborate empirically what is already supported in theory but has not yet been tested.
And another point is that the correlated studies used, mainly, samples prior to the moment of the obligation of accounting convergence of Brazilian companies to the International Financial Reporting Standards (IFRS) standard. Thus, this study differs from the others (mainly) in this way too.
The findings of this study contribute to the field of value relevance research, more specifically those that deal with research and development spending, allowing sectoral and/or chronological comparisons with the results obtained in related studies, as well as helping fill the sectoral gap (IT) of this core.
2 BACKGROUND
This section presents, in the following sequence, concepts and theories about: value relevance; R&D expenses; and IT Sector. And, in a complementary way, a subtopic on previous research correlated with the objective of the present research is presented at the end of this section.
2.1 VALUE RELEVANCE
According to Rezende (2005), studies that address the relevance of any accounting variable for the determination of the value of a company are grouped in the field of research of value relevance. This agrees with Barth, Beaver, and Landsman (2001), who explain that when the information generated and disclosed by accounting has a predictive capacity for the prices or returns of publicly traded stocks—that is, they predict the market value of companies—such information becomes known as value relevant.
These studies, according to Alves et al. (2011), amount to a large amount since the surveys of Ball and Brown (1968) and Beaver (1968). Holthausen and Watts (2001) also affirm that countless works of value relevance have been elaborated in the last decades, emphasizing the importance of this group of research in the academic scene.
The observed aspects and variables are diverse, but, in general, value relevance studies can be classified into three groups: market reaction to accounting information; behavioral changes in the relationship between returns and accounting information and; relevance of accounting information compared to non-financial information (Bezerra & Lopes, 2004).
According to Barth et al. (2001), in the last decades several econometric models have tested the aforementioned relationship through accounting data. The authors cite the frequent use of the Ohlson (1995) model which treats the firm value as a linear function of book value and abnormal profits. Alves et al. (2011), in turn, highlight the great use of the model of Collins, Maydew, and Weiss (1997) that uses earnings per share (E) and book value per share (BV) to explain stock prices.
It is important to emphasize that, as a rule, value relevance studies are closely linked to the Efficient Markets Hypothesis (HME), proposed by Fama (1970), since the market could absorb accounting information and generate some stock price.
According to Fama (1970), market efficiency can take three forms: Weak, Semi-Strong and Strong. According to Lima (2003), the weak form is one in which the prices of the past are not tools that can be anticipated in the search for future prices. The semi-strong form, according to Pereira and Urpia (2011), is that in which not only past prices are reflected in present prices, but also all information that has been disclosed, such as those presented in financial statements.
Finally, the strong form is, according to Fama (1970), the way in which no investor can obtain abnormal returns since even the undisclosed information would have effects already reflected in the present prices.
In this way, value relevance studies would not be effective in strong markets since the disclosure of accounting information would be irrelevant to the determination of stock prices. This agrees with Barth et al. (2001) when they explain that accounting information falls into the value relevance field only when they have the capacity to predict values in the capital market.
Holthausen and Watts (2001) believe that the market usually incorporates information that is not available to ordinary investors or is available in a lagged way, and therefore, value relevance studies could not capture this effect.
2.2 RESEARCH AND DEVELOPMENT (R&D) EXPENSES
According to International Accounting Standard 38 (IAS, 2014), research is “original and planned investigation undertaken with the prospect of gaining new scientific or technical knowledge and understanding”. Already the concept of development is defined by the same norm as “the application of research findings or other knowledge to a plan or design for the production of new or substantially improved materials, devices, products, processes, systems or services before the start of commercial production or use”.
Thus, while research is only an expectation of acquiring or creating something, development is the effective application of research results in the construction of that something. Based on this understanding, the amounts allocated to research are recorded as expenses for the period, but when they reach the development phase, these amounts may be activated in the group of Intangibles.
The capitalization of intangible assets will occur if and only if the company can meet the basic requirements described in item 57 of IAS 38 (2014). Such requirements lead to conditions of technical feasibility of completing the item; intention to sell or use the future asset; reliability in the measurement of expenses; among others. This subjectivity derived from the interpretation of information can be used as a tool for the earnings management (Ferreira & Cunha, 2017; Nunes, Botinha, & Lemes, 2015).
Cazavan-Jeny and Jeanjean (2006) found a negative association between capitalized R&D costs and the capital market. This fact, even if it is not a common sense, can, in fact, sustain the idea of possible manipulation in the capitalization or not of the spending in development.
For Hendriksen and Van Breda (1999), a company that invests more in research may be on the road to success and, on the other hand, the company that does not invest in this group may be doomed to failure. This seems to be in agreement with Jensen, Menezes-, and Sbragia (2004) when they affirm that the importance of research and development spending in the richest countries is unquestionable. This distinction between R&D expenses in developed and less developed countries is also mentioned by Andreassi and Sbragia (2002).
On the other hand, Queiroz (2010) states that, in the short term, R&D expenses tends to be detrimental to the financial aspect of the company, since the final product will only be released after a certain period. This understanding is corroborated by Chan, Lakonishok, and Sougiannis (2001) in explaining that companies that invest in R&D are initially undervalued by the market but, according to the authors, in the future, such expenses eventually generate abnormal returns to shareholders. Ferreira and Cunha (2017) also point to a positive reflection of R&D investments in the long term.
2.3 INFORMATION TECHNOLOGY (IT) SECTOR
Queiroz (2010) suggests that according to the sector of activity of the company, R&D expenditures can play a fundamental role in maintaining competitive advantages and economic-financial availability. For Duqi and Torluccio (2013), companies operating in technology sectors have a higher return on their R&D investments compared to others.
Antonini and Saccol (2011) explain that the IT sector is characterized by strong competition and the high speed of innovations. For Hungarato and Lopes (2008), according to the need for innovation of a company, the values related to R&D spending play a prominent role in its development. Due to the high competitiveness and the continuous need for innovation, Souza, Zwicker, Vidal, and Siqueira (2005) state that the IT sector is fundamental to the Brazilian economy.
Stefanuto (2004) says that IT companies emerge from some innovative idea or to meet new demands. Thus, it is evident the need for investments in research for companies in this sector. This is in agreement with Kaplan and Norton (2000) when they stated that technology companies need to anticipate customer needs and innovate in their products and services for good performance.
According to Souza et al. (2005), the conception of IT implies a combination of technology and organization and, with this, investigations about the subject should penetrate the theoretical, organizational and interaction perspectives of the analyzed object. However, there are few studies that go much deeper in this way, highlighting the research proposed by Weber and Klein (2013), whose objective was to understand the process of strategic management of an IT company located in Rio Grande do Sul.
With regard to the Brazilian capital market, regulated by B3, actions can be segmented through some criteria, such as that of sector classification. Currently, this classification consists of 8 sectors, one of them is IT, which is subdivided into two segments: Computers and Equipment and; Programs and Services.
2.4 PREVIOUS STUDIES
It is possible to perceive the existence of numerous works of value relevance in recent years. Barth et al. (2001) discuss in their study the validity of accounting information for accounting scholars and also for investors. Conversely, Holthausen and Watts (2001) point out that the lack of a theory on the subject makes shallow results obtained in searches of value relevance.
Sarlo (2004) studied the reaction of the Brazilian capital market to the disclosure of the accounting results of the companies and concluded that the accounting information serves as a tool to reduce informational asymmetry to investors. Galdi (2008), in a similar study, attests through its results that accounting information is useful to investors in pursuing stocks that generate abnormal returns.
Batista, Oliveira, and Macedo (2017) studied the relevance of Net Income and Operating Cash Flow in the capital market, with these variables considered relevant. Macedo, Romana, and Silva (2014) suggest that some of the determining factors for such relevance are the performance, size, and governance practices of the Brazilian capital markets, in a study aimed at explaining the relevance of Net Income and Book Value of the companies.
Some studies deal specifically with the relationship between R&D spending and the capital market through stock price impacts. For example, Hungarato and Lopes (2008) find that R&D expenses, when treated in isolation, are not able to explain the stock price of observed firms.
Alves et al. (2011) found no gain in marginal information on R&D expenditures in comparison with Earnings and Book Value in the formation of stock prices. Lev and Sougiannis (1996) have found a strong association between capitalized R&D values and share prices in US market.
Queiroz (2010) verifies the relationship between R&D expenses and company profits in the short term, attesting that there is no positive relation between them. On the other hand, Azevedo and Gutierrez (2009) point out that there is a long-term growth of companies due to R&D spending. Both the assertion of a short-run negative effect on the market and a positive long-run effect are corroborated by Lev (1999) in a survey of the US market.
Crisóstomo and González (2006) point to a positive sensitivity of the Brazilian capital market in relation to research and development spending and, similarly, Zhao (2002) also finds this positive reaction of the market due to R&D expenses for four different samples, which were France, Germany, United States and the United Kingdom. In contrast, Cazavan-Jeny and Jeanjean (2006) attest to a negative reaction in the price and return of French market shares between 1993 and 2002 for capitalized R&D values.
Ferreira and Cunha (2017) research, which verifies the relationship between capitalized R&D values in the Brazilian capital market, segregating research in pre-IFRS and post-IFRS moments. The authors find statistical significance in both cases.
3 METHOD
Regarding the methodological procedures used, this study is empirical-positivist and uses a quantitative approach, since there is a collection of data regarding stock prices, R&D expenses and other accounting information, followed by treatment and analysis of them (Martins & Theóphilo, 2009).
This study uses a non-probabilistic sample which refers to the IT companies listed in B3 between 2010 and 2018. At the present moment, there are eight companies listed in the IT sector of B3, however, only five companies have described R&D expenses in their accounting statements for the observed period. Considering this fact, quarterly data was used with the purpose to expand the sample, given the small number of observed companies. Besides that, quarterly data was used by Ritta, Cunha, and Klann (2017) in a related study about intangible assets and their relation with economic performance, corroborating this methodological choice.
It was collected data about R&D from Comdinheiro® platform, the unique which was verified this information, and the other data, which is described in sequence, was collected from Economatica® platform. R&D, as was mentioned, was not available in this platform.
In order to determine whether R&D expenses can be considered relevant to the capital market, regression analyzes were taken using the Stock Price (SP) as a dependent variable and, as an independent variable, R&D expenses per share, generating the variable RDPS. While R&D was weighted by number of shares, the scale problem between these variables is mitigated and, besides this, it’s also isolated the companies’ size effect. this procedure was also done by Alves et al. (2011).
It is important to emphasize that the SP variable was considered within ten days after the publication of each quarterly report, that is, D+10. This is in accordance with the semi-strong efficiency of the Brazilian market recently diagnosed by Batista, Maia, and Romero (2018). A tolerance of up to 5 days has been added for cases that fall on non-useful dates.
In addition, two control variables were used: Earnings per Share (EPS)—in case, the net profit—and Book Value per share (BVPS), originating from the work of Collins et al. (1997). These variables were considered as control because, according to Alves et al. (2011), are common in studies of value relevance, increasing the robustness of the econometric model. With such inclusion, there is a mitigation of the risk of specification error by omission of relevant variables.
At the end, the sample amount a total of 77 observations. Due to the lack of data in all the proposed periods, it was not possible to obtain a balanced panel, so, these observations were pooled for later analysis.
Since it is a reduced sample and, therefore, an inherent risk of the presence of outliers, the analyzes were made from regressions estimated by minimizing the absolute weighted errors, in the form of Least Absolute Deviations (LAD) regressions.
For Ohlson and Kim (2015), although regressions estimated by Ordinary Least Squares (OLS) are more often in accounting research, they can generate erroneous results due to necessary corrections such as heteroskedasticity problems and outlier’s treatment. These adjustments bias the mean of the data, used as a parameter, which is a measure of high sensitivity to extreme values. A solution to these problems pointed by these authors is to estimate the regressions by a less sensitive parameter. Unlike the OLS estimation, LAD estimation doesn’t use mean as a parameter, instead, it uses the median.
Moreover, accounting research’s rarely uses this methodology, a fact that represents a gap to be explored, according Duarte, Girão, and Paulo (2017), whereas, moreover, point out as advantages of these estimations in relation to the traditional OLS regressions: exemption of normality and homoscedasticity, common problems in samples of accounting studies; and greater robustness to discrepant data.
Thus, the following simple regression was initially performed:
 (1)
(1)
Where, respectively:
SPi,t is the Stock Price of company i, at the moment t;
 is the parameter of the regression, which is the median;
 is the Intercept;
 is the angular coefficient of the regression;
RDPS i,t is the expenses with R&D per share of company i, at the moment t;
 is the term of error.
Then, a new LAD regression equation was generated including the control variables EPS and BVPS, arranged by Collins et al. (1997) as predictors of stock price.
 (2)
(2)
Considering:
 is Earnings per share of company i, at the moment t;
 is the Book Value per share of company i, at the moment t.
And, given the results obtained in the quantile regression (2) it was possible to test the main hypothesis of this study:
H1: R&D spending helps explain the formation of stock prices of companies in the IT sector of B3.
This research hypothesis is supported by the relevance of intangible assets, including R&D, to IT companies (Duqi & Torluccio, 2013; Souza et al., 2016; Stefanuto, 2004) and the understanding that these items are important for the market value of firms, regardless of their sector (Crisóstomo & González, 2006; Wang et al., 2013).
In addition, two logistic regressions were carried out in order to verify if the negative and positive extreme values in R&D expenses could influence the presence of the firm’s stock price in the lowest or highest range among the observations of the sample. For this, the 25% lower (higher) values of the variable RDPS and of the SP variable were treated as extreme values, that is, the first quartile represented the lower portion and the third quartile did it in the upper portion.
Thus, the logistic regressions proposed were:
 (3)
(3)
and 
Where, respectively:
 (4)
(4)
and 
In which:
EXTPOSSP is a dummy variable that assumes value 1 for Extreme Positive Stock Prices;
EXTNEGSP is a dummy variable that assumes value 1 for Extreme Negative Stock Prices;
EXTPOSRDPS is a dummy variable that assumes value 1 for Extreme Positive R&D;
EXTNEGRDPS is a dummy variable that assumes value 1 for Extreme Negative R&D.
For the logistic regressions we tested the following secondary hypotheses:
H2a: For companies listed in the IT sector of B3, large investments in R&D increase the possibility of presence in the highest price range of the sector.
H2b: For companies listed in the IT sector of B3, small investments in R&D increase the possibility of presence in the lowest price range of the sector.
These assumptions are supported by Hendriksen and Van Breda (1999), who assert that firms that invest heavily in R&D tend to be successful, while the reverse occurs when there are no such investments; the relevance of R&D for IT companies for market survival (Hungarato & Lopes, 2008; Kaplan & Norton, 2000); and the higher returns obtained by companies of this sector from R&D (Duqi & Torluccio, 2013).
All regressions were performed using STATA®, considering always a 95% confidence level.
4 RESULTS
The first part of this section presents the statistical results of the tests and models required to achieve the proposed objectives. In a second moment, these results are discussed in relation to those obtained in similar research as well as to the theoretical premises.
4.1 ANALYSIS
The first step made in this section concerns the descriptive statistics of the variables used.
| Variable | Mean | Median | Std. Dev. | Min. | Max. |
| SP | 23,756 | 24,188 | 9,186 | 7,243 | 42,952 |
| EPS | 0,202 | 0,511 | 3,944 | -33,307 | 4,382 |
| BVPS | 11,255 | 7,206 | 10,498 | 3,770 | 45,955 |
| RDPS | 0,424 | 0,287 | 0,423 | 0,025 | 1,995 |
According to Table 1, a high dispersion can be verified for almost all data, except for the variable RDPS. The values of the means are not close to those of the median, suggesting the discrepancy of some data and, therefore, making usefull the LAD regressions according to Ohlson and Kim (2015).
Although Duarte et al. (2017) have explained that quantile regressions and, consequently, LAD regressions, are semi-parametric techniques and do not require basic assumptions, it is emphasized here that the presence of normality of residues was identified for Equation (1) – which will be presented next – with a p-value of 0.3438 in the Jarque-Bera test. This test is suitable for such a function according to Corrar, Paulo, and Dias (2007). Said that:
| Panel A | ||||||
| SP | Coefficient | Std. Err. | t | p-value | ||
| RDPS | 14.923 | 3.277 | 4.55 | 0.000*** | ||
| Intercept | 17.874 | 2.014 | 8.87 | 0.000*** | ||
| Panel B | ||||||
| Mean VIF | - | Higher VIF | - | Pseudo R² | 0.2154 | |
In an initial analysis it is possible to verify the statistical significance of the independent variable (RDPS) at a confidence level of 95%, given its p-value 0.000. According to the pseudo R², and because it is a simple regression, it would be possible to infer that, for the selected sample, R&D expenses would explain about 21% of the stock price variation. A unit change in such expenses would imply an increase of approximately 14.92 units in the share price.
Now, Equation (2) presents the results considering the control variables EPS and BVPS, initially arranged by Ohlson (1995) and Collins et al. (1997) and used in large scale in value relevance surveys, according to Alves et al. (2011).
| Panel A | |||||||||
| SP | Coefficient | Std. Err. | t | p-value | |||||
| EPS | 0.581 | 0.088 | 6.61 | 0.000*** | |||||
| BVPS | -0.703 | 0.175 | -4.02 | 0.000*** | |||||
| RDPS | 28.515 | 4.437 | 6.43 | 0.000*** | |||||
| Intercept | 19.052 | 1.498 | 12.72 | 0.000*** | |||||
| Panel B | |||||||||
| Mean VIF | 2.485 | Higher VIF | 3.230 | Pseudo R² | 0.3093 | ||||
Since this is a multiple regression, Equation (2) required a previous multicollinearity test among the regressors. For this, the practical rule proposed by Gujarati and Porter (2011) was used, that values below 10 in the Variance Inflation Factor (VIF) test suggest the absence of serious problems in this aspect. Therefore, considering the average FIV and also the highest FIV, there are no indications of multicollinearity problems.
Once again, the Jarque-Bera test was performed to test the normal distribution of the residues and, as in Equation (1), there is acceptance of the null hypothesis given the p-value 0.1839. Regarding the results per se, Table 3 denotes statistical significance for all independent variables. The variable of interest in this model, RDPS, is not only significant as it presents the largest coefficient among all the regressors. Its coefficient makes it possible to assert that, before the sample present in this study, the increase of 1 unit in this variable would imply a consequent increase of about 28 units in the stock price.
Continuing the proposal initially described in the methodology section, the results of logistic regressions (3) and (4) are presented below.
Initially, on Equation (3), the Hosmer-Lemeshow test had a p-value of 0.3431, so the null hypothesis of the test was accepted, suggesting that the adjustment of the model according to Fávero, Belfiore, Takamatsu, and Suzart (2014). In addition, the area under the Receiver Operating Characteristic (ROC) curve was 0.6368—considering a standard cutoff of 0.5—indicating an acceptable power of discrimination between the categories of the dependent variable. This can best be represented by the following graph:
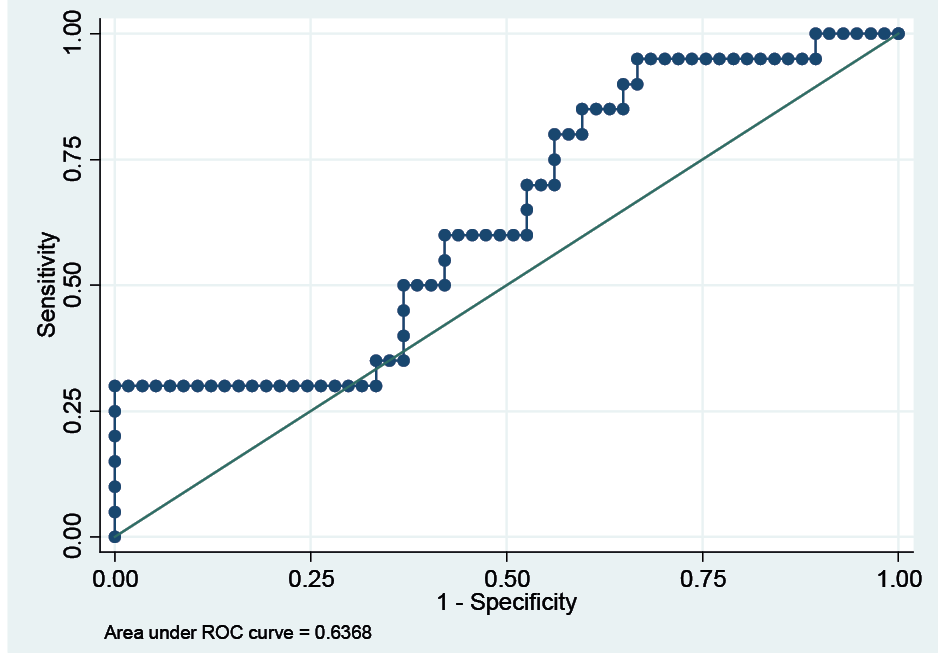
Thus, they follow the results of Equation (3) according to Table 4.
| EXTPOSSP | z | p-value | ||||
| EPS | 0.155922 | 0.2770117 | Panel A | 0.676 | ||
| BVPS | 0.096604 | 0.0362637 | Coefficient | Std. Err. | ||
| EXTPOSRDPS | -0.8741275 | 0.9252281 | -0.94 | 0.345 | ||
| Intercept | -2.059769 | 0.4765228 | -4.32 | 0.000*** | ||
| Panel B | ||||||
| Mean VIF | 1.350 | Higher VIF | 1.527 | Pseudo R² | 0.1281 | |
| Log-Likelihood | -38.455 | Prob > Chi² | 0.0102** | |||
It can be seen that the model presents at least one statistically significant variable when the rejection of the null hypothesis of the likelihood ratio test (LR test) is verified, given a p-value of 0.01 < 0.05 (Fávero et al., 2014); besides presenting a power of explanation of approximately 13%. We also highlight the non-identification of any problem regarding the collinearity between the independent variables according to the FIVs.
Following the same steps as in Equation (3), the Hosmer-Lemeshow test done for Equation (4) also suggests suitability of the proposed model (p-value 0.3772) and the area under the ROC curve was 0.6009, indicating the acceptable discrimination between the categories of the dependent variable, as in the previous case, respecting a cutoff of 0.5.
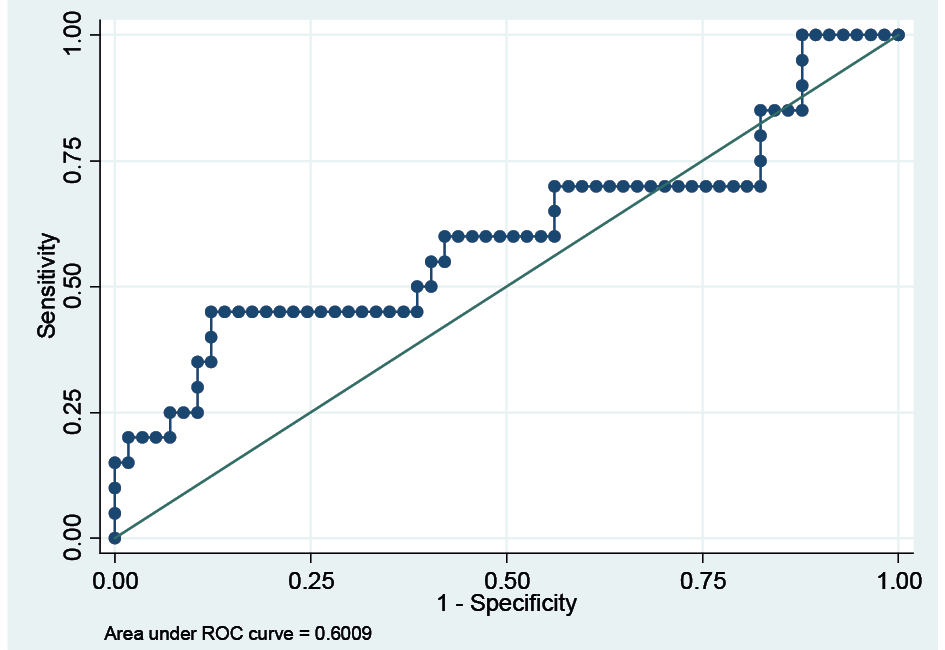
Finally, the results of Equation (4) are presented in front of Table 5.
| Panel A | ||||||
| EXTNEGSP | Coefficient | Std. Err. | z | p-value | ||
| EPS | 0.1589819 | 0.3548279 | 0.45 | 0.654 | ||
| BVPS | -0.010752 | 0.0315924 | -0.34 | 0.734 | ||
| EXTNEGRDPS | 1.245401 | 0.6291920 | 1.98 | 0.048** | ||
| Intercept | -1.407402 | 0.5826132 | -2.42 | 0.016** | ||
| Panel B | ||||||
| Mean VIF | 1.051 | Higher VIF | 1.076 | Pseudo R² | 0.0620 | |
| Log-Likelihood | -41.368 | Prob > Chi² | 0.1404 | |||
Differently from what happened in the previous model, the model derived from Equation (4) does not pass the adjustment quality LR test. The p-value 0.1404 makes it possible to accept the null hypothesis of insignificance of the parameters together, so it is already possible to refute the hypothesis H2b.
4.2 DISCUSSION
The result presented in Table 2 is in agreement with the initial finding of Alves et al. (2011) when they also found significance of R&D expenditures when analyzed in isolation. On the other hand, this result is not in line with the findings of Hungarato and Lopes (2008), which indicated that there is no relationship between R&D expenses and stock prices when these expenses are considered separately. (Error 1: La referencia: Table 2 está ligada a un elemento que ya no existe)
Table 3 presents that the EPS and BVPS control variables, although significant, show opposite signs. While the first one follows the results of previous research from Collins et al. (1997), the last one contradicts the frequent positive signs found in related research. Perhaps this is a perception of the market in the IT sector that, because it focuses on intangible assets, could be partially disregarding other assets and, consequently, the net worth of the companies.
An interesting result to be compared with the research of Alves et al. (2011) is that, in such a research, the inclusion of EPS and BVPS control variables in the initial simple regression model caused the RDPS significance lost, being this the main result of the authors before the electric sector of B3. However, as seen in Table 3, this is not repeated in the IT sector of B3. This result seems to be in line with the idea that R&D spending is extremely relevant to the IT sector, as explained by Duqi and Torluccio (2013), Souza et al. (2016) and Stefanuto (2004).
Thus, considering the results obtained and the confirmation of some issues reported in previous research, it is not plausible to reject H1 from this study. That is, it is not reliable to say that R&D spending can’t explain the stock price formation of B3 IT companies.
About Table 4, when observing the regressors analytically, we can see that only the BVPS control variable remains statistically significant, that is, the quantitative increase in equity would favor the possibility of extremely high prices in a positive direction. But, the variable of interest, RDPS, is not statistically significant, so it is not possible to accept the H2a hypothesis.
In short, large-scale investments in the RDPS variable would not favor the possibility of high share prices of B3 IT companies. This result runs counter to Hendriksen and Van Breda (1999) assertion (for the market as a whole) that intense R&D investment would drive business success; in addition, this limits the relevance of R&D investments to the IT sector made by Hungarato and Lopes (2008) and Kaplan and Norton (2000) to a certain extent, thus, it means there are no infinite benefits due to R&D spending.
Table 5 denotes that it is not possible to say that investing little in R&D can lead B3 IT companies to fail in the market in terms of pricing their assets. This result, equally to the last one, represents a limit of R&D relevance for IT companies, but now, this limit is in the opposite direction, indicating that although R&D expenses are important for these companies, market value will not be drastically affected if such investments are reduced, contradicting in parts what was explained by Stefanuto (2004).
5 CONCLUSIONS
Studies on value relevance have been prominent in the accounting academic scenario since the 1960s, and with this, several information presented by accounting were tested over the years in classic models to ascertain their respective predictive powers against stock prices.
About this diverse information, intangible assets, especially those related to research and development spending, have gained some prominence, being observed, for example, by Alves et al. (2011) in the B3 energy sector.
And considering the importance of R&D for one or another sector, it is considered that the IT sector treats such values as of the highest importance. Therefore, this study sought to verify the relevance of R&D expenses for IT companies listed in B3.
The results point to a positive relationship between R&D investments and IT companies’ market value, corroborating the idea of the relevance of this information in this sector. In addition, this relevance was maintained with the inclusion of control variables (EPS and BVPS), a fact not identified in the study by Alves et al. (2011) in the energy sector. Therefore, there are indications that, in fact, the market denotes greater importance of these intangible assets for the IT sector.
It was also possible to realize that these benefits derived from the variable RDPS are finite, that is, invest too much in research and development will not necessarily add market value to the point of being prominent among the competitors of the sector. Similarly, low investments in this area will not necessarily bring the company’s share price to the bottom group of IT companies.
The main contribution of this research is to empirically point out the relevance of R&D to a particular sector (IT), where such relevance had already been reported, but only in a theoretical way. Investors can, from the results of this research, better predict the market reaction to this sector and, in parallel, the managers of these companies can consider R&D spending as real investments.
As with any research, this paper has limitations. One concerns the small number of observations. This limitation stems from the small number of IT companies listed on B3, which makes it basically incorrigible. Another limitation concerns the risk of omission of other important variables for the pricing of the assets of these companies that could result in a potential endogeny in the disposed model.
As suggestions for further research, it is indicated: the use of international samples in the hope of a wider range of IT companies in other markets; the verification of R&D relevance to other sectors, as suggested by Alves et al. (2011); and the use of other methods that may exploit the data from a different perspective in order to identify the maintenance or divergence of the present results.
REFERENCES
Alves, A., Silva, T., Macedo, M., & Marques, J. A. (2011). A relevância dos gastos com P&D para o mercado brasileiro de capitais: UM estudo com distribuidoras de energia elétrica no período de 2002-2009. INMR—Innovation & Management Review, 8(2), 216-239. Retrieved from http://www.revistas.usp.br/rai/article/view/79220
Andreassi, T., & Sbragia, R. (2002). Relações entre indicadores de P&D e de resultado empresarial. Revista de Administração da Universidade de São Paulo, 37(1), 72-84.
Antonini, L. D. S., & Saccol, A. Z. (2011). Educação corporativa em pequenas e médias empresas do setor de software: Um estudo exploratório. Revista Eletrônica de Sistemas de Informação, 10(2), 1-23.
Azevedo, F. N., & Gutierrez, C. E. C. (2009). A relação dos gastos com P&D na taxa de crescimento de longo prazo das empresas listadas na NYSE. Anais do Congresso ANPCONT, São Paulo, 3.
Ball, R., & Brown, P. (1968). An Empirical Evaluation of Accounting Income Numbers. Journal of Accounting Research, 6(2), 159-178. doi:10.2307/2490232
Barth, M. E., Beaver, W. H., & Landsman, W. R. (2001). The Relevance of the Value Relevance Literature for Financial Accounting Standard Setting: Another View. Journal of Accounting and Economics, 31, 77-104.
Batista, A. R. A., Maia, U., & Romero, A. (2018). Stock market under the 2016 Brazilian presidential impeachment: A test in the semi-strong form of the efficient market hypothesis. Revista Contabilidade & Finanças, 29(78), 405-417.
Batista, T. C. O., Oliveira, J. F., & Macedo, M. A. S. (2017). Relevância da informação contábil para o mercado brasileiro de capitais: Uma análise comparativa entre lucro líquido, lucro abrangente e fluxo de caixa operacional. RACE, Revista de Administração, Contabilidade e Economia, 16(1), 381-408.
Beaver, W. (1968). The information content of annual earnings announcements. Journal of Accounting Research, 6, 67-92.
Bezerra, F. A., & Lopes, A. B. (2004). Lucro e preço das ações. In S. de Iudícibus, & A. B. Lopes, Teoria avançada da contabilidade. São Paulo: Atlas.
Cazavan-Jeny, A., & Jeanjean, T. (2006). The negative impact of R&D capitalization: A value relevance approach. European Accounting Review, 15(1), 37-61.
Chan, L. K., Lakonishok, J., & Sougiannis, T. (2001). The stock market valuation of research and development expenditures. The Journal of Finance, 56(6), 2431-2456.
Collins, D. W., Maydew, E. L., & Weiss, I. S. (1997). Changes in the value-relevance of earnings and book values over the past forty years. Journal of accounting and economics, 24(1), 39-67.
Corrar, L., Paulo, E., & Dias, J. M., Filho. (2007). Análise multivariada para os cursos de administração, ciências contábeis e economia. São Paulo: Atlas.
Crisóstomo, V. L., & González, E. V. (2006). Possível reação do Mercado Brasileiro aos investimentos em P&D. Revista de Administração Mackenzie, 7(1), 96-114.
Duarte, F. C. L., Girão, L. F. A. P., & Paulo, E. (2017). Avaliando Modelos Lineares de Value Relevance: Eles Captam o que Deveriam Captar? [Edição especial]. Revista de Administração Contemporânea, 21, 110-134.
Duqi, A., & Torluccio, G. (2013). The impact of R&D on the value of European firms. International Journal of Accounting, Auditing and Performance Evaluation, 9(3), 1-26.
Fama, E. (1970). Efficient Capital Markets: A Review of Theory and Empirical Work. The Journal of Finance, 25(2), 383-417. doi:10.2307/2325486
Fávero, L. P., Belfiore, P., Takamatsu, R. T., & Suzart, J. (2014). Métodos Quantitativos com Stata. Rio de Janeiro: Elsevier.
Ferreira, D. S., & Cunha, M. F. (2017). A adoção das IFRS, a Pesquisa & Desenvolvimento e o Valor da Empresa. Anais do Congresso UnB de Contabilidade e Governança, Brasília, DF, 3.
Financial Reporting Pronouncement. (2010). Conceptual Framework for Financial Reporting. Retrieved from http://www.ifrs.org/News/PressReleases/Documents/ConceptualFW2010vb.pdf
Galdi, F. C. (2008). Estratégias de investimento em ações baseadas na análise de demonstrações contábeis: É possível prever o sucesso? (Tese de doutorado). Universidade de São Paulo, São Paulo.
Gujarati, D. N., & Porter, D. C. (2011). Basic econometrics. Boston, Mass: McGraw-Hill.
Hendriksen, E. S., & Van Breda, M. F. (1999). Teoria da Contabilidade (A. Z. Sanvicente Trad.). São Paulo: Atlas.
Holthausen, R. W., & Watts, R. L. (2001). The Relevance of the Value Relevance Literature for Financial Accounting Standard Setting. Journal of Accounting and Economics, 31, 3-75.
Hungarato, A., & Lopes, A. B. (2008). Value-relevance dos gastos em P&D para o preço das ações das empresas brasileiras negociadas na Bovespa. Anais do Simpósio de Gestão da Inovação Tecnológica, Brasília, DF, 25.
International Accounting Standard 38. (2014). Retrieved from http://eifrs.ifrs.org/eifrs/bnstandards/en/IAS38.pdf
Jensen, J., Menezes-, N., Filho, & Sbragia, R. (2004). Os determinantes dos gastos em P&D no Brasil: Uma análise com dados em painel. Estudos Econômicos, 34(4), 661-691.
Kaplan, R. S., & Norton, D. P. (2000). The Balanced Scorecard: Translating strategy into action. Boston: Harvard Business School Press.
Lev, B., & Sougiannis, T. (1996). The capitalization, amortization, and value relevance of R&D. Journal of Accounting and Economics, 21(1), 107-138.
Lev, B. (1999). R&D and capital markets. Journal of Applied Corporate Finance, 11(4), 21-35.
Lima, L. A. O. (2003). Auge e declínio da hipótese dos mercados eficientes. Revista de Economia Política, 23(4).
Macedo, M. D. S., Romana, T. D., & Silva, J. C. Q. (2014). Análise dos Determinantes da Relevância das Informações Contábeis no Brasil: Um estudo com base no lucro líquido (LL) e no patrimônio líquido (PL) para o período de 2010 a 2012. Anais do Congresso USP de Controladoria e Finanças, São Paulo, 14.
Martins, G. D. A., & Theóphilo, C. R. (2009). Metodologia da investigação científica. São Paulo: Atlas.
Nunes, I. V., Botinha, R. A., & Lemes, S. (2015). Escolha contábil no reconhecimento dos gastos de pesquisa e desenvolvimento em empresas de alta e média-alta tecnologia. Anais do Congresso USP de Controladoria e Contabilidade, São Paulo, 15.
Ohlson, J. A. (1995). Earnings, book values, and dividends in equity valuation. Contemporary accounting research, 11(2), 661-687.
Ohlson, J. A., & Kim, S. (2015). Linear Valuation Without OLS: The Theil-Sen Estimation Approach. Review of Accounting Studies, 20(1), 395-435.
Pereira, E. J. A. L., & Urpia, A. G. B. C. (2011). Hipótese dos mercados eficientes vis-à-vis incerteza, convenção e especulação: Por uma mudança de paradigma nos mercados financeiros. Pesquisa & Debate. Revista do Programa de Estudos Pós-Graduados em Economia Política, 22(1).
Queiroz, O. D. (2010). Impacto do crescimento dos gastos em P&D na taxa de crescimento dos lucros das empresas de acordo com o modelo OJ: UM estudo no mercado de capitais brasileiro. Anais do Congresso Anpcont, Natal, 4.
Rezende, A. J. (2005). The Relevance of Accounting Information in the Process of Valuation of Companies in the New and Old Economy—An Analysis of Asset Investments and their Effects on the Value Relevance of Earnings and Book Value. Brazilian Business Review, 2(1), 33-52.
Ritta, C. D. O., Cunha, L. C., & Klann, R. C. (2017). Um estudo sobre causalidade entre ativos intangíveis e desempenho econômico de empresas (2010-2014). Revista de Contabilidade do Mestrado em Ciências Contábeis da UERJ, 22(2), 92-107.
Sarlo, A., Neto. (2004). A reação dos Preços das Ações à Divulgação dos Resultados Contábeis: Evidências Empíricas sobre a Capacidade Informacional da Contabilidade no Mercado Acionário Brasileiro (Dissertação de mestrado). Fundação Instituto Capixaba de Pesquisas em Contabilidade, Economia e Finanças—FUCAPE, Vitória.
Souza, A. R., Costa, M. C., & Clemente, A. (2016). Regulação e o nível dos gastos em pesquisa e desenvolvimento: Uma análise das empresas listadas na BM&FBOVESPA. Anais do Congresso ANPCONT, Ribeirão Preto, 10.
Souza, C. A., Zwicker, R., Vidal, A. G. R., & Siqueira, J. O. (2005). Avaliação do Grau de Informatização de Empresas: Um estudo em indústrias brasileiras. Anais do Encontro da Associação Nacional de Programas de Pós-Graduação em Administração, Brasília, DF, 29.
Stefanuto, G. N. O. (2004). O programa softex e a indústria de software do Brasil (Tese de doutorado). Universidade Estadual de Campinas, Campinas.
Wang, C. H., Lu, Y. H., Huang, C. W., & Lee, J. Y. (2013). R&D, productivity, and market value: An empirical study from high-technology firms. Omega, 41(1), 143-155.
Weber, M., & Klein, A. (2013). Gestão estratégica em empresas de tecnologia da informação: Um estudo de caso. Revista Ibero Americana de Estratégia, 12(3).
Zhao, R. (2002). Relative value relevance of R&D reporting: An international comparison. Journal of international financial management & accounting, 13(2), 153-174.
Additional information
Como citar este artigo: ABNT: MARÇAL, Ronan Reis; FLACH, Leonardo. Value Relevance OF R&D expenses in capital market: A study of brazilian IT Sector companies. RACE, Revista de Administração, Contabilidade e Economia, Joaçaba: Editora Unoesc, v. 19, n. 1, p. 29-52, jan./abr. 2020. Disponível em: http://editora.unoesc.edu.br/index.php/race. Acesso em: dia/mês/ano.
Como citar este artigo: APA: Marçal, R. R., & Flach, L. (2020). Value Relevance OF R&D expenses in capital market: A study of brazilian IT Sector companies. RACE, Revista de Administração, Contabilidade e Economia, 19(1), 29-52. Recuperado de http://editora.unoesc.edu.br/index.php/race


